
|
|||||
|
 | |
| |
| |
| |
| |
| |
|
Gene: GFM2 |
Gene summary for GFM2 |
| Gene information | Species | Human | Gene symbol | GFM2 | Gene ID | 84340 |
| Gene name | GTP dependent ribosome recycling factor mitochondrial 2 | |
| Gene Alias | EF-G2mt | |
| Cytomap | 5q13.3 | |
| Gene Type | protein-coding | GO ID | GO:0006412 | UniProtAcc | Q969S9 |
Top |
Malignant transformation analysis |
| Identification of the aberrant gene expression in precancerous and cancerous lesions by comparing the gene expression of stem-like cells in diseased tissues with normal stem cells |
| Entrez ID | Symbol | Replicates | Species | Organ | Tissue | Adj P-value | Log2FC | Malignancy |
| 84340 | GFM2 | HCC1_Meng | Human | Liver | HCC | 1.31e-18 | 3.34e-03 | 0.0246 |
| 84340 | GFM2 | HCC2 | Human | Liver | HCC | 5.77e-11 | 2.49e+00 | 0.5341 |
| 84340 | GFM2 | S014 | Human | Liver | HCC | 3.95e-08 | 3.24e-01 | 0.2254 |
| 84340 | GFM2 | S015 | Human | Liver | HCC | 1.56e-11 | 5.56e-01 | 0.2375 |
| 84340 | GFM2 | S016 | Human | Liver | HCC | 5.20e-09 | 3.24e-01 | 0.2243 |
| 84340 | GFM2 | S027 | Human | Liver | HCC | 1.93e-04 | 3.80e-01 | 0.2446 |
| 84340 | GFM2 | S028 | Human | Liver | HCC | 1.74e-06 | 3.52e-01 | 0.2503 |
| 84340 | GFM2 | S029 | Human | Liver | HCC | 1.18e-07 | 4.30e-01 | 0.2581 |
| 84340 | GFM2 | C04 | Human | Oral cavity | OSCC | 1.66e-02 | 1.72e-01 | 0.2633 |
| 84340 | GFM2 | C21 | Human | Oral cavity | OSCC | 2.25e-10 | 3.57e-01 | 0.2678 |
| 84340 | GFM2 | C30 | Human | Oral cavity | OSCC | 1.72e-09 | 5.64e-01 | 0.3055 |
| 84340 | GFM2 | C38 | Human | Oral cavity | OSCC | 3.87e-08 | 5.54e-01 | 0.172 |
| 84340 | GFM2 | C43 | Human | Oral cavity | OSCC | 2.66e-05 | 2.42e-01 | 0.1704 |
| 84340 | GFM2 | C46 | Human | Oral cavity | OSCC | 1.09e-06 | 2.09e-01 | 0.1673 |
| 84340 | GFM2 | C51 | Human | Oral cavity | OSCC | 3.74e-06 | 2.58e-01 | 0.2674 |
| 84340 | GFM2 | C57 | Human | Oral cavity | OSCC | 1.80e-04 | 1.05e-01 | 0.1679 |
| 84340 | GFM2 | LN22 | Human | Oral cavity | OSCC | 6.20e-04 | 3.68e-01 | 0.1733 |
| 84340 | GFM2 | LN46 | Human | Oral cavity | OSCC | 3.20e-07 | 2.40e-01 | 0.1666 |
| 84340 | GFM2 | SYSMH3 | Human | Oral cavity | OSCC | 4.20e-04 | 2.29e-01 | 0.2442 |
| Page: 1 |
| Tissue | Expression Dynamics | Abbreviation |
| Liver | 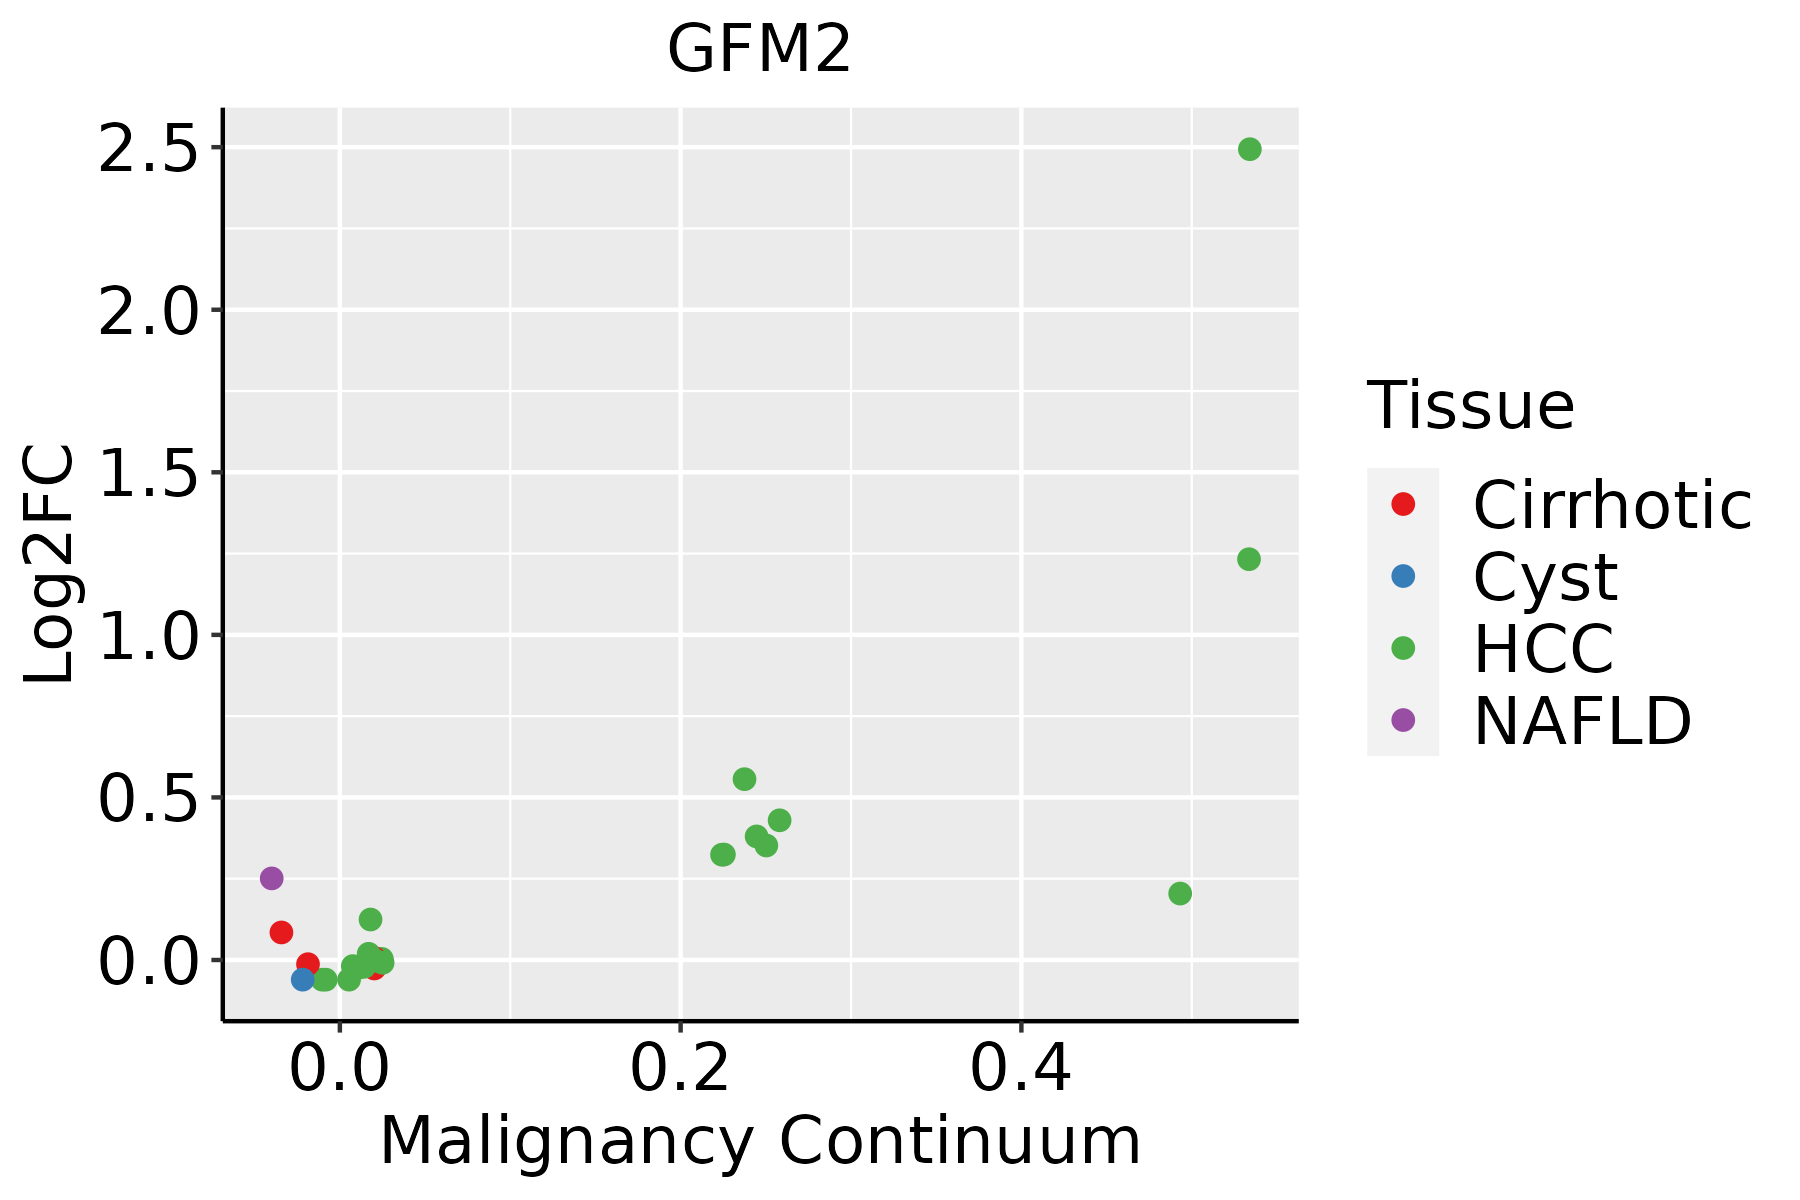 | HCC: Hepatocellular carcinoma |
| NAFLD: Non-alcoholic fatty liver disease | ||
| Oral Cavity |  | EOLP: Erosive Oral lichen planus |
| LP: leukoplakia | ||
| NEOLP: Non-erosive oral lichen planus | ||
| OSCC: Oral squamous cell carcinoma |
| ∗log2FC in expression of this searched gene in stem-like cells from each diseased tissue sample relative to stem-like cells in normal samples in each tissue plotted against the malignancy continuum. Samples are colored based on if they are from different disease stage. |
Top |
Malignant transformation related pathway analysis |
| Find out the enriched GO biological processes and KEGG pathways involved in transition from healthy to precancer to cancer |
| Tissue | Disease Stage | Enriched GO biological Processes |
| Colorectum | AD |  |
| Colorectum | SER |  |
| Colorectum | MSS |  |
| Colorectum | MSI-H |  |
| Colorectum | FAP |  |
| ∗Top 15 enriched GO BP terms are showed in the bar plot of each disease state in each tissue. Each row represents a significant GO biological process which is colored according to the -log10(p.adjust). |
| Page: 1 2 3 4 5 6 7 8 9 |
| GO ID | Tissue | Disease Stage | Description | Gene Ratio | Bg Ratio | pvalue | p.adjust | Count |
| GO:002241112 | Liver | HCC | cellular component disassembly | 282/7958 | 443/18723 | 1.02e-19 | 1.38e-17 | 282 |
| GO:190300811 | Liver | HCC | organelle disassembly | 89/7958 | 114/18723 | 8.68e-15 | 5.73e-13 | 89 |
| GO:01400531 | Liver | HCC | mitochondrial gene expression | 82/7958 | 108/18723 | 1.49e-12 | 7.20e-11 | 82 |
| GO:00325431 | Liver | HCC | mitochondrial translation | 62/7958 | 76/18723 | 2.95e-12 | 1.34e-10 | 62 |
| GO:003298411 | Liver | HCC | protein-containing complex disassembly | 138/7958 | 224/18723 | 5.59e-09 | 1.46e-07 | 138 |
| GO:00436242 | Liver | HCC | cellular protein complex disassembly | 71/7958 | 136/18723 | 1.39e-02 | 4.95e-02 | 71 |
| GO:002241119 | Oral cavity | OSCC | cellular component disassembly | 283/7305 | 443/18723 | 9.57e-27 | 3.37e-24 | 283 |
| GO:19030088 | Oral cavity | OSCC | organelle disassembly | 85/7305 | 114/18723 | 1.15e-14 | 6.93e-13 | 85 |
| GO:01400533 | Oral cavity | OSCC | mitochondrial gene expression | 78/7305 | 108/18723 | 2.37e-12 | 9.86e-11 | 78 |
| GO:00325434 | Oral cavity | OSCC | mitochondrial translation | 59/7305 | 76/18723 | 7.21e-12 | 2.70e-10 | 59 |
| GO:003298410 | Oral cavity | OSCC | protein-containing complex disassembly | 136/7305 | 224/18723 | 3.42e-11 | 1.13e-09 | 136 |
| GO:0006415 | Oral cavity | OSCC | translational termination | 13/7305 | 18/18723 | 4.45e-03 | 1.79e-02 | 13 |
| GO:00436244 | Oral cavity | OSCC | cellular protein complex disassembly | 68/7305 | 136/18723 | 5.84e-03 | 2.24e-02 | 68 |
| Page: 1 |
| Pathway ID | Tissue | Disease Stage | Description | Gene Ratio | Bg Ratio | pvalue | p.adjust | qvalue | Count |
| Page: 1 |
Top |
Cell-cell communication analysis |
| Identification of potential cell-cell interactions between two cell types and their ligand-receptor pairs for different disease states |
| Ligand | Receptor | LRpair | Pathway | Tissue | Disease Stage |
| Page: 1 |
Top |
Single-cell gene regulatory network inference analysis |
| Find out the significant the regulons (TFs) and the target genes of each regulon across cell types for different disease states |
| TF | Cell Type | Tissue | Disease Stage | Target Gene | RSS | Regulon Activity |
| ∗The dot plots of a searched regulon are shown for all cell subpopulations in each disease state of each tissue based on the regulon specific score inferred using pySCENIC and by calculating the average expression. |
| Page: 1 |
Top |
Somatic mutation of malignant transformation related genes |
| Annotation of somatic variants for genes involved in malignant transformation |
| Hugo Symbol | Variant Class | Variant Classification | dbSNP RS | HGVSc | HGVSp | HGVSp Short | SWISSPROT | BIOTYPE | SIFT | PolyPhen | Tumor Sample Barcode | Tissue | Histology | Sex | Age | Stage | Therapy Types | Drugs | Outcome |
| GFM2 | SNV | Missense_Mutation | novel | c.1795N>A | p.Glu599Lys | p.E599K | Q969S9 | protein_coding | tolerated(0.4) | benign(0.102) | TCGA-5L-AAT1-01 | Breast | breast invasive carcinoma | Female | <65 | III/IV | Hormone Therapy | letrozol | SD |
| GFM2 | SNV | Missense_Mutation | c.1619T>C | p.Ile540Thr | p.I540T | Q969S9 | protein_coding | deleterious(0) | benign(0.224) | TCGA-A8-A083-01 | Breast | breast invasive carcinoma | Female | >=65 | I/II | Unknown | Unknown | SD | |
| GFM2 | SNV | Missense_Mutation | c.2093N>T | p.Arg698Ile | p.R698I | Q969S9 | protein_coding | deleterious(0.02) | benign(0.251) | TCGA-A8-A09Z-01 | Breast | breast invasive carcinoma | Female | >=65 | I/II | Unknown | Unknown | SD | |
| GFM2 | SNV | Missense_Mutation | rs761283105 | c.569N>A | p.Arg190Gln | p.R190Q | Q969S9 | protein_coding | deleterious(0.03) | probably_damaging(0.993) | TCGA-AN-A046-01 | Breast | breast invasive carcinoma | Female | >=65 | I/II | Unknown | Unknown | SD |
| GFM2 | SNV | Missense_Mutation | c.425N>T | p.Thr142Ile | p.T142I | Q969S9 | protein_coding | deleterious(0) | probably_damaging(1) | TCGA-C8-A274-01 | Breast | breast invasive carcinoma | Female | <65 | I/II | Hormone Therapy | tamoxiphen | SD | |
| GFM2 | SNV | Missense_Mutation | c.385N>G | p.Thr129Ala | p.T129A | Q969S9 | protein_coding | deleterious(0) | possibly_damaging(0.902) | TCGA-D8-A1JP-01 | Breast | breast invasive carcinoma | Female | >=65 | I/II | Hormone Therapy | tamoxiphen | SD | |
| GFM2 | insertion | Nonsense_Mutation | novel | c.1243_1244insACCCTTAACTG | p.Leu415TyrfsTer3 | p.L415Yfs*3 | Q969S9 | protein_coding | TCGA-AO-A128-01 | Breast | breast invasive carcinoma | Female | <65 | I/II | Chemotherapy | doxorubicin | SD | ||
| GFM2 | deletion | Frame_Shift_Del | novel | c.1556delN | p.Leu519Ter | p.L519* | Q969S9 | protein_coding | TCGA-D8-A27V-01 | Breast | breast invasive carcinoma | Female | <65 | I/II | Hormone Therapy | tamoxiphen | SD | ||
| GFM2 | SNV | Missense_Mutation | c.2334N>C | p.Leu778Phe | p.L778F | Q969S9 | protein_coding | tolerated(0.71) | benign(0.003) | TCGA-EK-A2RC-01 | Cervix | cervical & endocervical cancer | Female | <65 | I/II | Unknown | Unknown | SD | |
| GFM2 | SNV | Missense_Mutation | novel | c.172N>C | p.Ser58Pro | p.S58P | Q969S9 | protein_coding | deleterious_low_confidence(0.03) | probably_damaging(0.949) | TCGA-FU-A3HZ-01 | Cervix | cervical & endocervical cancer | Female | <65 | I/II | Chemotherapy | cisplatin | CR |
| Page: 1 2 3 4 5 6 7 8 |
Top |
Related drugs of malignant transformation related genes |
| Identification of chemicals and drugs interact with genes involved in malignant transfromation |
| (DGIdb 4.0) |
| Entrez ID | Symbol | Category | Interaction Types | Drug Claim Name | Drug Name | PMIDs |
| Page: 1 |

Copyright 2023-Present -The University of Texas Health Science Center at Houston |