
|
|||||
|
 | |
| |
| |
| |
| |
| |
|
Gene: GFER |
Gene summary for GFER |
| Gene information | Species | Human | Gene symbol | GFER | Gene ID | 2671 |
| Gene name | growth factor, augmenter of liver regeneration | |
| Gene Alias | ALR | |
| Cytomap | 16p13.3 | |
| Gene Type | protein-coding | GO ID | GO:0001889 | UniProtAcc | P55789 |
Top |
Malignant transformation analysis |
| Identification of the aberrant gene expression in precancerous and cancerous lesions by comparing the gene expression of stem-like cells in diseased tissues with normal stem cells |
| Entrez ID | Symbol | Replicates | Species | Organ | Tissue | Adj P-value | Log2FC | Malignancy |
| 2671 | GFER | LZE4T | Human | Esophagus | ESCC | 1.06e-06 | 1.78e-01 | 0.0811 |
| 2671 | GFER | LZE20T | Human | Esophagus | ESCC | 1.01e-07 | 2.27e-01 | 0.0662 |
| 2671 | GFER | LZE22D1 | Human | Esophagus | HGIN | 1.56e-03 | 1.56e-01 | 0.0595 |
| 2671 | GFER | LZE24T | Human | Esophagus | ESCC | 1.59e-16 | 4.89e-01 | 0.0596 |
| 2671 | GFER | LZE21T | Human | Esophagus | ESCC | 2.74e-02 | 3.42e-01 | 0.0655 |
| 2671 | GFER | P1T-E | Human | Esophagus | ESCC | 9.40e-10 | 4.03e-01 | 0.0875 |
| 2671 | GFER | P2T-E | Human | Esophagus | ESCC | 5.66e-34 | 6.68e-01 | 0.1177 |
| 2671 | GFER | P4T-E | Human | Esophagus | ESCC | 3.03e-28 | 7.06e-01 | 0.1323 |
| 2671 | GFER | P5T-E | Human | Esophagus | ESCC | 8.07e-37 | 6.71e-01 | 0.1327 |
| 2671 | GFER | P8T-E | Human | Esophagus | ESCC | 1.22e-12 | 2.98e-01 | 0.0889 |
| 2671 | GFER | P9T-E | Human | Esophagus | ESCC | 2.14e-04 | 1.96e-01 | 0.1131 |
| 2671 | GFER | P10T-E | Human | Esophagus | ESCC | 8.62e-06 | 1.23e-01 | 0.116 |
| 2671 | GFER | P11T-E | Human | Esophagus | ESCC | 3.34e-15 | 7.13e-01 | 0.1426 |
| 2671 | GFER | P12T-E | Human | Esophagus | ESCC | 5.00e-25 | 5.62e-01 | 0.1122 |
| 2671 | GFER | P15T-E | Human | Esophagus | ESCC | 8.84e-28 | 6.21e-01 | 0.1149 |
| 2671 | GFER | P16T-E | Human | Esophagus | ESCC | 8.96e-05 | 1.87e-01 | 0.1153 |
| 2671 | GFER | P17T-E | Human | Esophagus | ESCC | 7.73e-11 | 5.28e-01 | 0.1278 |
| 2671 | GFER | P19T-E | Human | Esophagus | ESCC | 1.77e-08 | 7.46e-01 | 0.1662 |
| 2671 | GFER | P20T-E | Human | Esophagus | ESCC | 2.13e-09 | 2.91e-01 | 0.1124 |
| 2671 | GFER | P21T-E | Human | Esophagus | ESCC | 4.53e-41 | 8.02e-01 | 0.1617 |
| Page: 1 2 3 4 5 6 |
| Tissue | Expression Dynamics | Abbreviation |
| Esophagus |  | ESCC: Esophageal squamous cell carcinoma |
| HGIN: High-grade intraepithelial neoplasias | ||
| LGIN: Low-grade intraepithelial neoplasias | ||
| Liver | 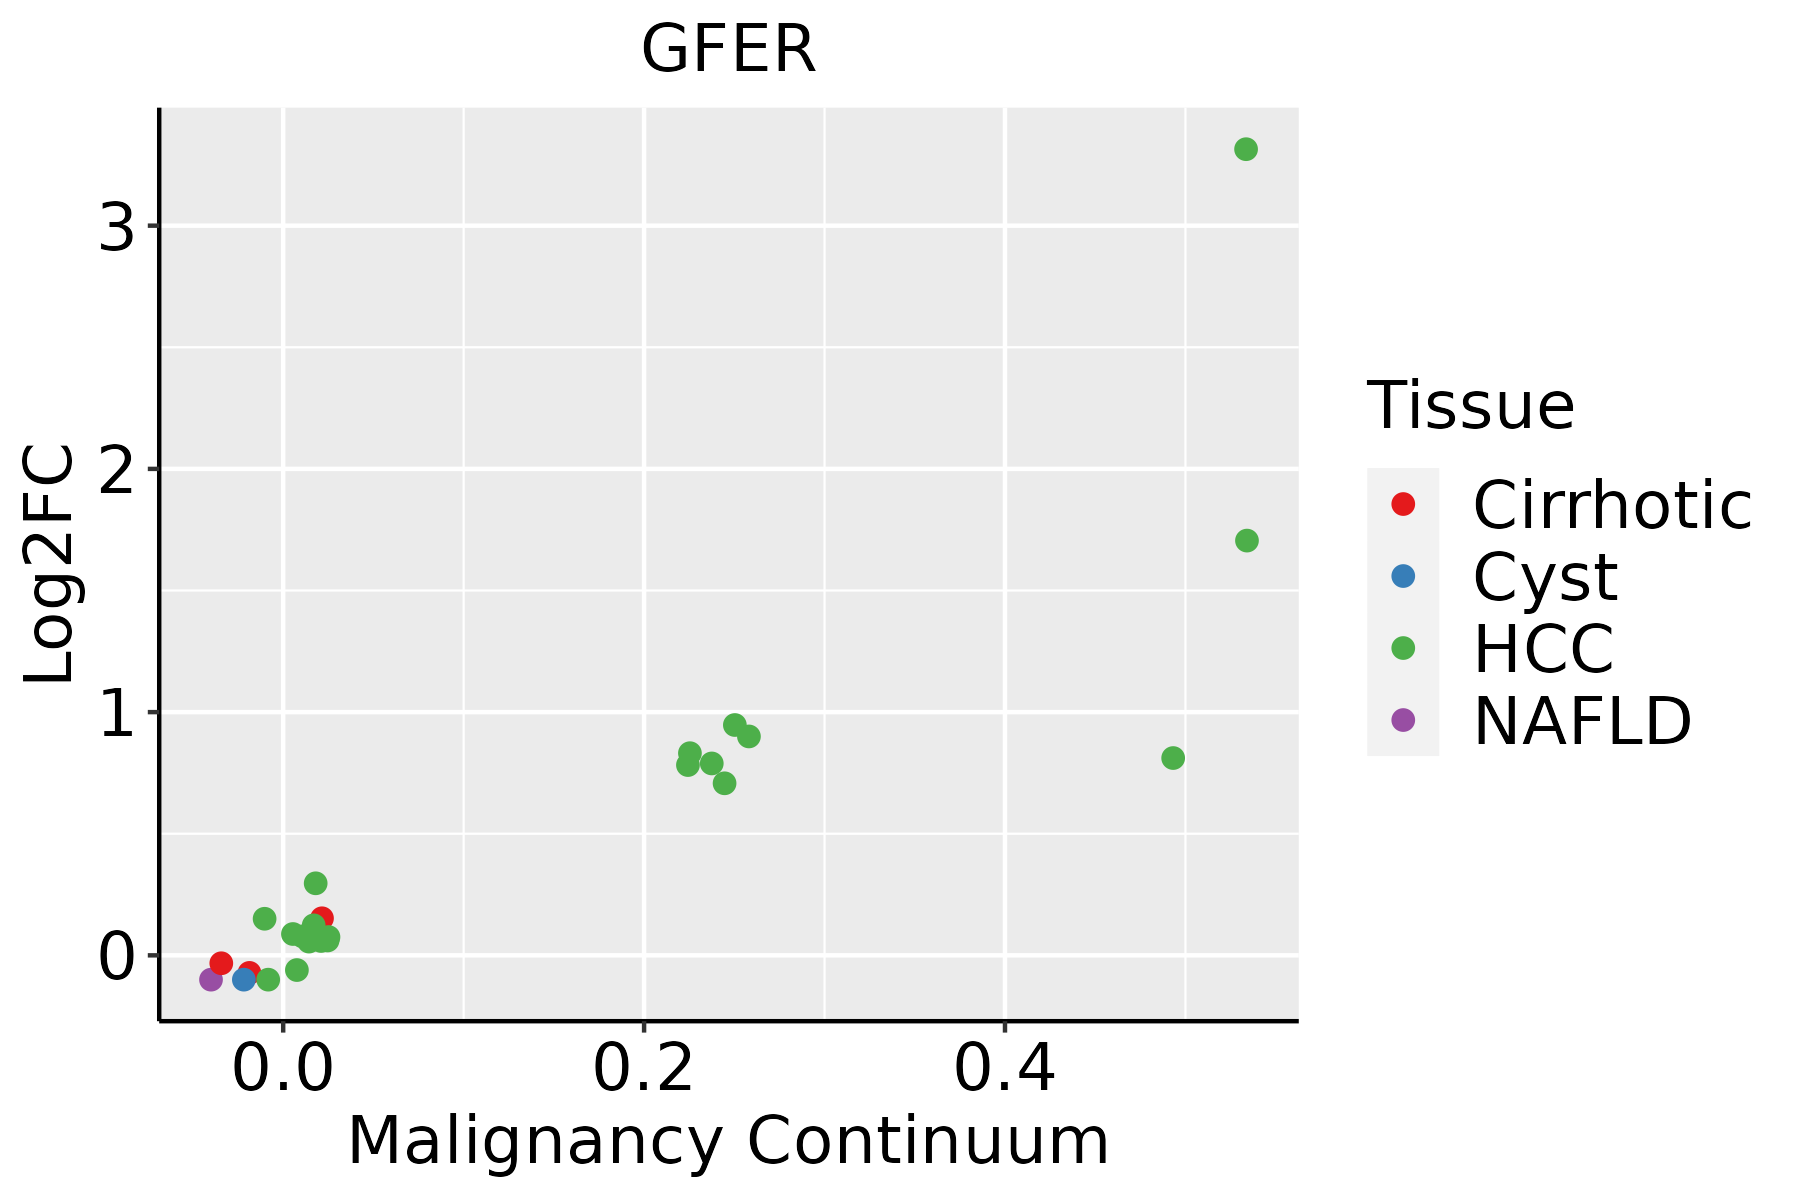 | HCC: Hepatocellular carcinoma |
| NAFLD: Non-alcoholic fatty liver disease | ||
| Oral Cavity | 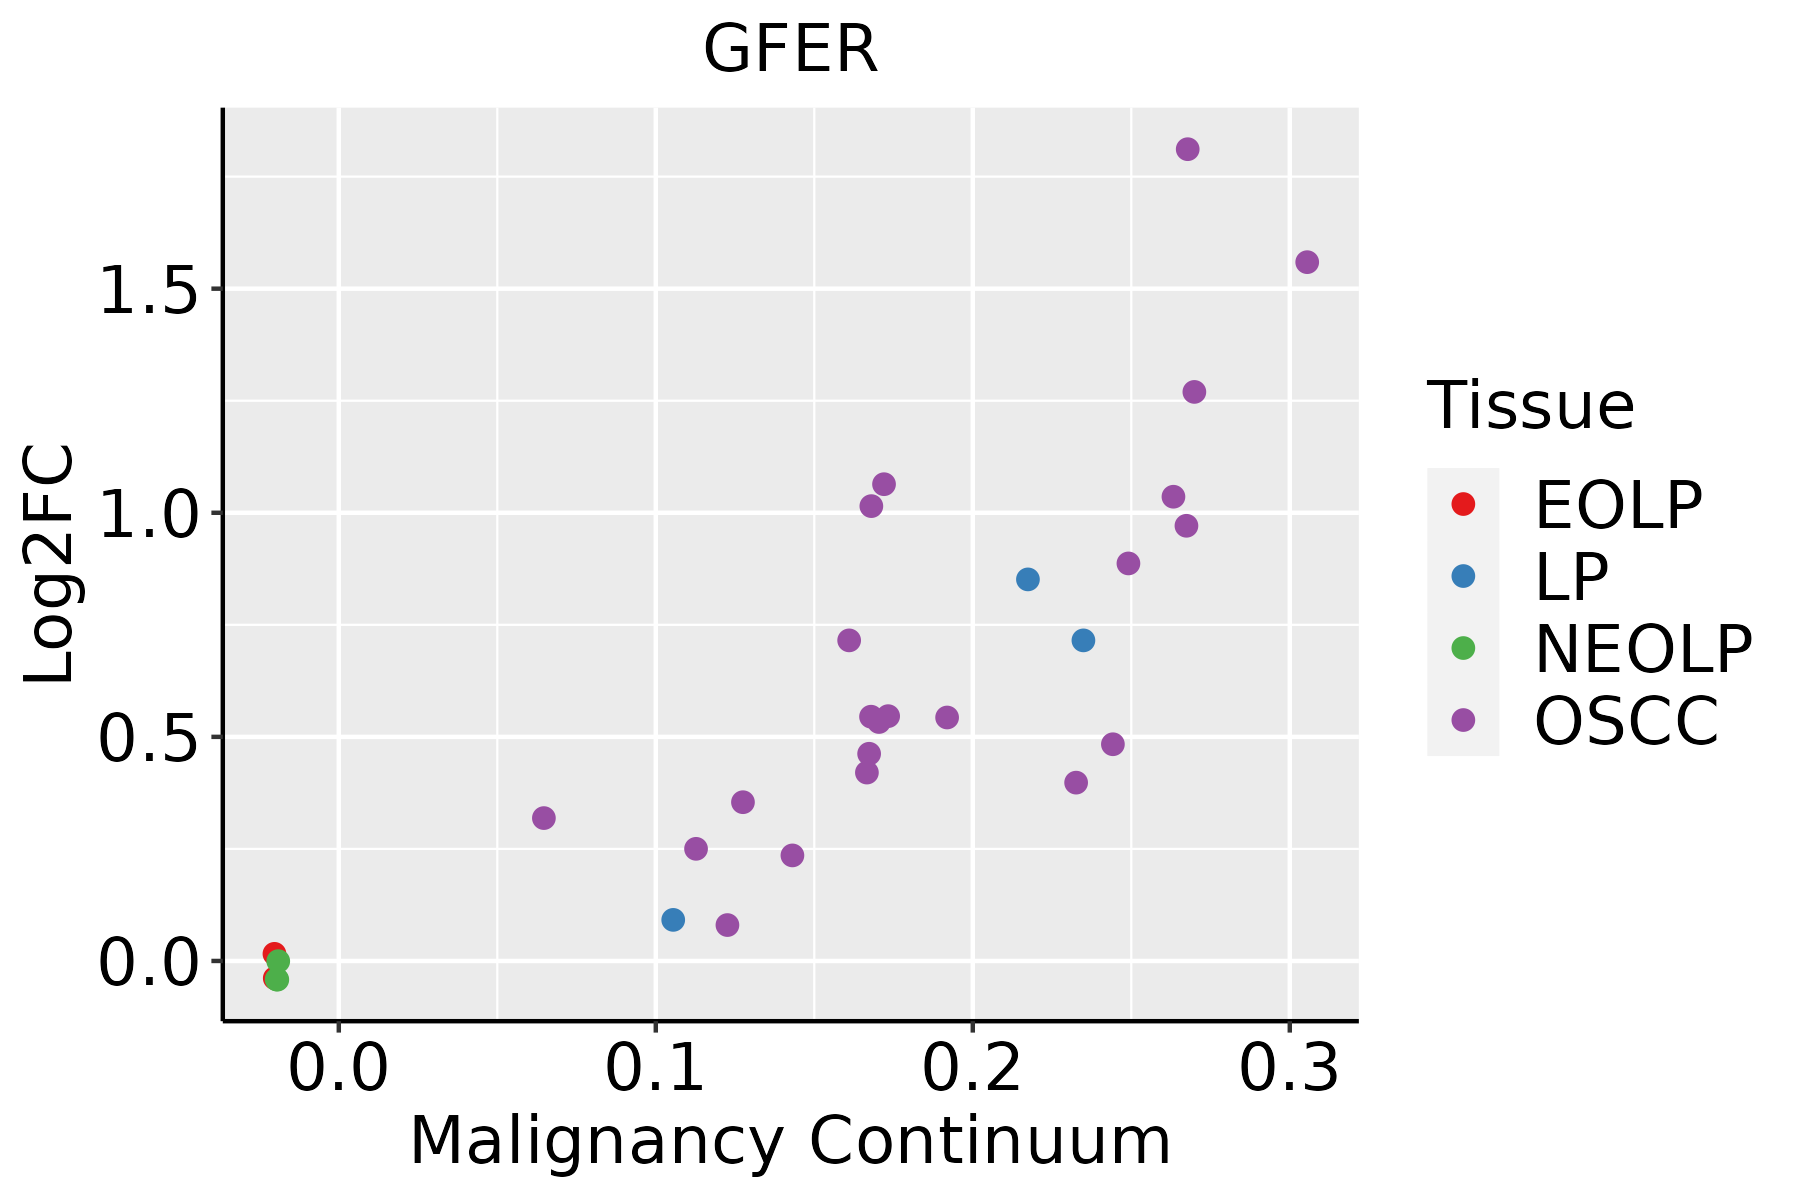 | EOLP: Erosive Oral lichen planus |
| LP: leukoplakia | ||
| NEOLP: Non-erosive oral lichen planus | ||
| OSCC: Oral squamous cell carcinoma | ||
| Thyroid | 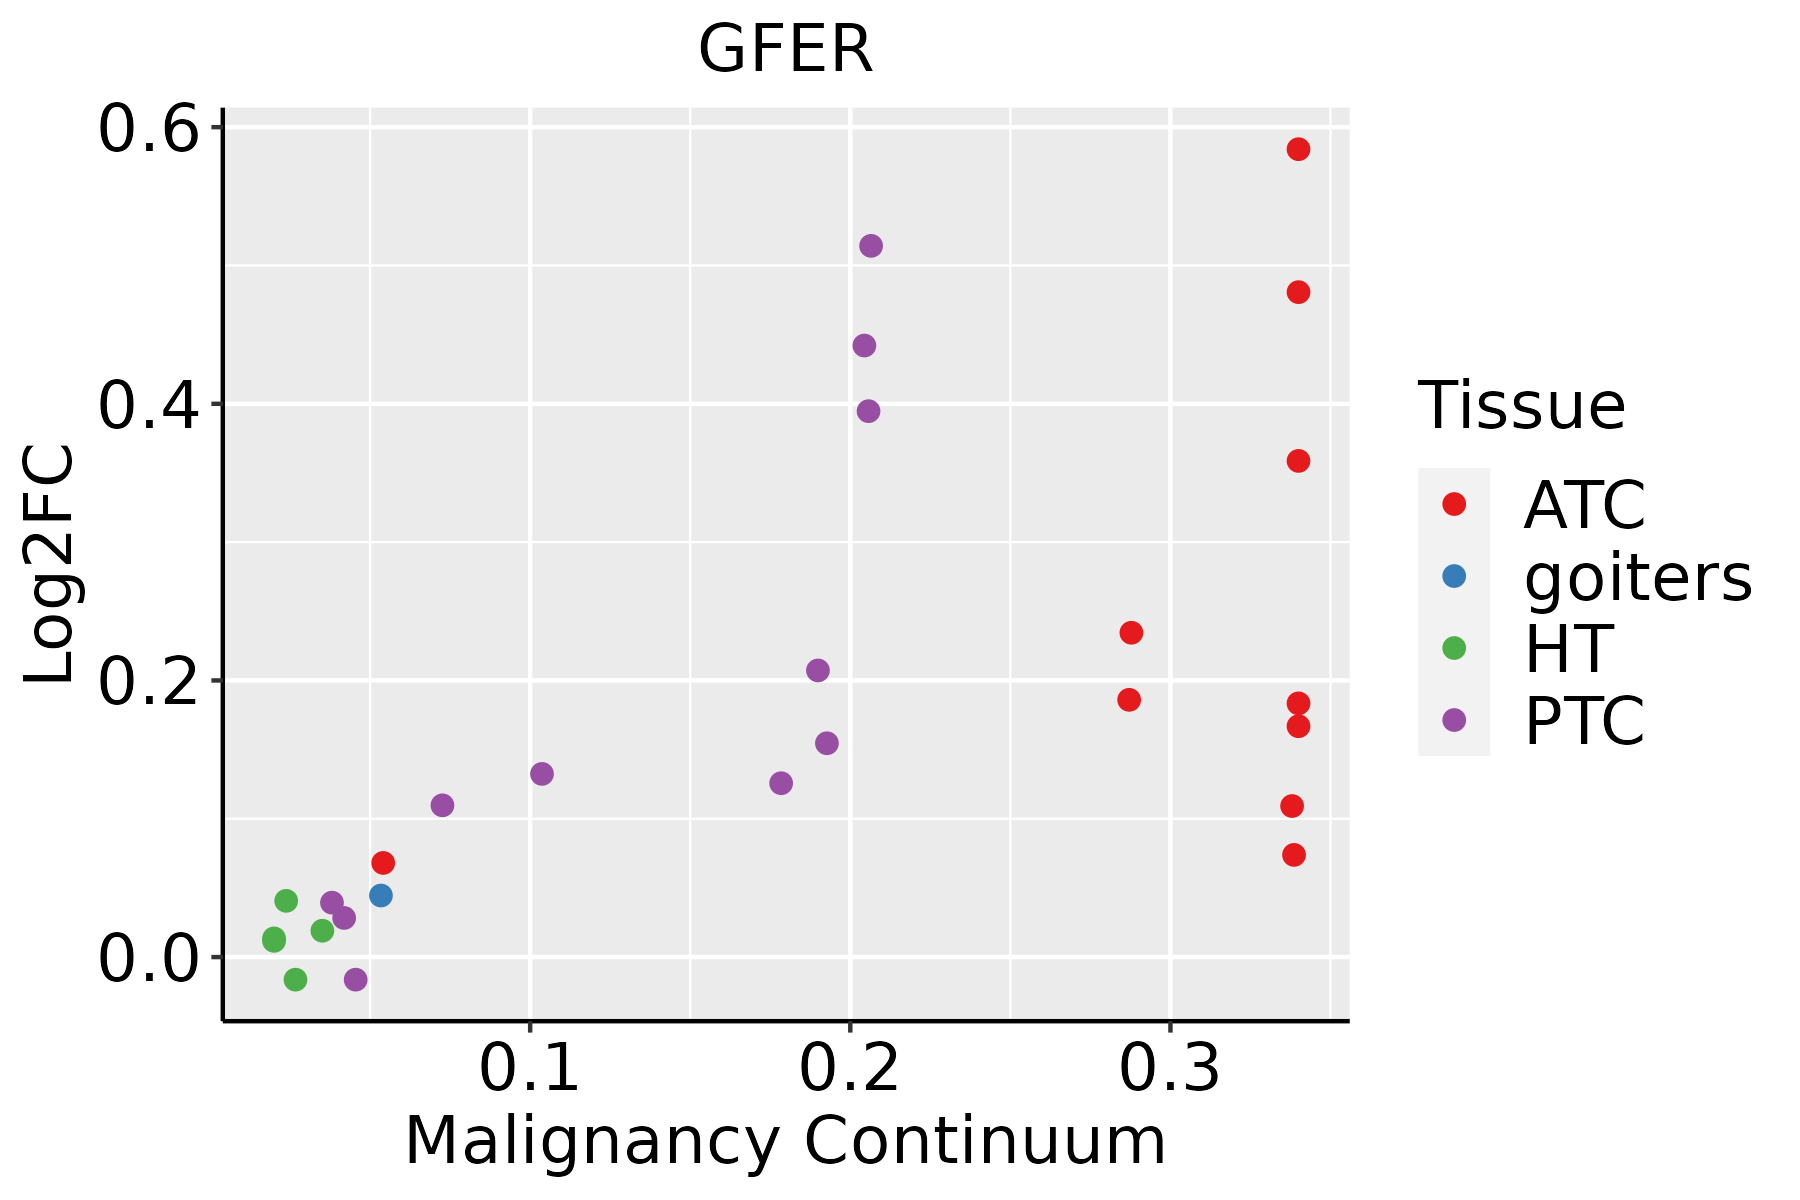 | ATC: Anaplastic thyroid cancer |
| HT: Hashimoto's thyroiditis | ||
| PTC: Papillary thyroid cancer |
| ∗log2FC in expression of this searched gene in stem-like cells from each diseased tissue sample relative to stem-like cells in normal samples in each tissue plotted against the malignancy continuum. Samples are colored based on if they are from different disease stage. |
Top |
Malignant transformation related pathway analysis |
| Find out the enriched GO biological processes and KEGG pathways involved in transition from healthy to precancer to cancer |
| Tissue | Disease Stage | Enriched GO biological Processes |
| Colorectum | AD |  |
| Colorectum | SER |  |
| Colorectum | MSS |  |
| Colorectum | MSI-H |  |
| Colorectum | FAP |  |
| ∗Top 15 enriched GO BP terms are showed in the bar plot of each disease state in each tissue. Each row represents a significant GO biological process which is colored according to the -log10(p.adjust). |
| Page: 1 2 3 4 5 6 7 8 9 |
| GO ID | Tissue | Disease Stage | Description | Gene Ratio | Bg Ratio | pvalue | p.adjust | Count |
| GO:004873225 | Esophagus | HGIN | gland development | 88/2587 | 436/18723 | 1.34e-04 | 2.71e-03 | 88 |
| GO:006100820 | Esophagus | HGIN | hepaticobiliary system development | 37/2587 | 150/18723 | 2.58e-04 | 4.53e-03 | 37 |
| GO:000188920 | Esophagus | HGIN | liver development | 36/2587 | 147/18723 | 3.61e-04 | 5.68e-03 | 36 |
| GO:0048732111 | Esophagus | ESCC | gland development | 269/8552 | 436/18723 | 7.81e-12 | 2.95e-10 | 269 |
| GO:0061008110 | Esophagus | ESCC | hepaticobiliary system development | 98/8552 | 150/18723 | 8.91e-07 | 1.15e-05 | 98 |
| GO:0001889110 | Esophagus | ESCC | liver development | 96/8552 | 147/18723 | 1.18e-06 | 1.47e-05 | 96 |
| GO:000188912 | Liver | Cirrhotic | liver development | 81/4634 | 147/18723 | 2.99e-15 | 3.35e-13 | 81 |
| GO:006100812 | Liver | Cirrhotic | hepaticobiliary system development | 82/4634 | 150/18723 | 3.72e-15 | 4.09e-13 | 82 |
| GO:004873212 | Liver | Cirrhotic | gland development | 154/4634 | 436/18723 | 4.03e-07 | 9.42e-06 | 154 |
| GO:000188922 | Liver | HCC | liver development | 108/7958 | 147/18723 | 2.16e-14 | 1.41e-12 | 108 |
| GO:006100822 | Liver | HCC | hepaticobiliary system development | 109/7958 | 150/18723 | 5.72e-14 | 3.42e-12 | 109 |
| GO:004873222 | Liver | HCC | gland development | 242/7958 | 436/18723 | 2.26e-08 | 5.28e-07 | 242 |
| GO:004873220 | Oral cavity | OSCC | gland development | 226/7305 | 436/18723 | 2.78e-08 | 5.39e-07 | 226 |
| GO:000188918 | Oral cavity | OSCC | liver development | 87/7305 | 147/18723 | 5.54e-07 | 8.08e-06 | 87 |
| GO:006100818 | Oral cavity | OSCC | hepaticobiliary system development | 88/7305 | 150/18723 | 8.13e-07 | 1.12e-05 | 88 |
| GO:000188919 | Oral cavity | LP | liver development | 62/4623 | 147/18723 | 2.32e-06 | 5.14e-05 | 62 |
| GO:0048732110 | Oral cavity | LP | gland development | 149/4623 | 436/18723 | 4.51e-06 | 9.17e-05 | 149 |
| GO:006100819 | Oral cavity | LP | hepaticobiliary system development | 62/4623 | 150/18723 | 5.13e-06 | 1.03e-04 | 62 |
| GO:0048732113 | Thyroid | PTC | gland development | 193/5968 | 436/18723 | 2.88e-08 | 6.42e-07 | 193 |
| GO:0001889112 | Thyroid | PTC | liver development | 79/5968 | 147/18723 | 3.08e-08 | 6.82e-07 | 79 |
| Page: 1 2 |
| Pathway ID | Tissue | Disease Stage | Description | Gene Ratio | Bg Ratio | pvalue | p.adjust | qvalue | Count |
| Page: 1 |
Top |
Cell-cell communication analysis |
| Identification of potential cell-cell interactions between two cell types and their ligand-receptor pairs for different disease states |
| Ligand | Receptor | LRpair | Pathway | Tissue | Disease Stage |
| Page: 1 |
Top |
Single-cell gene regulatory network inference analysis |
| Find out the significant the regulons (TFs) and the target genes of each regulon across cell types for different disease states |
| TF | Cell Type | Tissue | Disease Stage | Target Gene | RSS | Regulon Activity |
| ∗The dot plots of a searched regulon are shown for all cell subpopulations in each disease state of each tissue based on the regulon specific score inferred using pySCENIC and by calculating the average expression. |
| Page: 1 |
Top |
Somatic mutation of malignant transformation related genes |
| Annotation of somatic variants for genes involved in malignant transformation |
| Hugo Symbol | Variant Class | Variant Classification | dbSNP RS | HGVSc | HGVSp | HGVSp Short | SWISSPROT | BIOTYPE | SIFT | PolyPhen | Tumor Sample Barcode | Tissue | Histology | Sex | Age | Stage | Therapy Types | Drugs | Outcome |
| GFER | SNV | Missense_Mutation | novel | c.200N>T | p.Arg67Leu | p.R67L | P55789 | protein_coding | tolerated(0.19) | benign(0) | TCGA-5L-AAT1-01 | Breast | breast invasive carcinoma | Female | <65 | III/IV | Hormone Therapy | letrozol | SD |
| GFER | SNV | Missense_Mutation | c.410N>A | p.Ser137Tyr | p.S137Y | P55789 | protein_coding | deleterious(0) | probably_damaging(0.997) | TCGA-F5-6814-01 | Colorectum | rectum adenocarcinoma | Male | <65 | I/II | Unknown | Unknown | SD | |
| GFER | SNV | Missense_Mutation | novel | c.418T>G | p.Tyr140Asp | p.Y140D | P55789 | protein_coding | deleterious(0) | probably_damaging(0.999) | TCGA-A5-A2K5-01 | Endometrium | uterine corpus endometrioid carcinoma | Female | >=65 | I/II | Unknown | Unknown | SD |
| GFER | SNV | Missense_Mutation | novel | c.485N>T | p.Thr162Ile | p.T162I | P55789 | protein_coding | deleterious(0) | possibly_damaging(0.821) | TCGA-05-4397-01 | Lung | lung adenocarcinoma | Male | >=65 | I/II | Unknown | Unknown | SD |
| GFER | SNV | Missense_Mutation | rs780954807 | c.524N>G | p.Asn175Ser | p.N175S | P55789 | protein_coding | deleterious(0) | probably_damaging(1) | TCGA-66-2793-01 | Lung | lung squamous cell carcinoma | Male | >=65 | III/IV | Unknown | Unknown | SD |
| Page: 1 |
Top |
Related drugs of malignant transformation related genes |
| Identification of chemicals and drugs interact with genes involved in malignant transfromation |
| (DGIdb 4.0) |
| Entrez ID | Symbol | Category | Interaction Types | Drug Claim Name | Drug Name | PMIDs |
| 2671 | GFER | DRUGGABLE GENOME, ENZYME, GROWTH FACTOR | TRIMEPRAZINE TARTRATE | TRIMEPRAZINE TARTRATE | ||
| 2671 | GFER | DRUGGABLE GENOME, ENZYME, GROWTH FACTOR | CHLORAMBUCIL | CHLORAMBUCIL | ||
| 2671 | GFER | DRUGGABLE GENOME, ENZYME, GROWTH FACTOR | DIFFRACTAIC ACID | DIFFRACTAIC ACID | ||
| 2671 | GFER | DRUGGABLE GENOME, ENZYME, GROWTH FACTOR | GNF-PF-4371 | CHEMBL585651 | ||
| 2671 | GFER | DRUGGABLE GENOME, ENZYME, GROWTH FACTOR | N-(3-METHOXYPHENYL)ANTHRANILIC ACID | CHEMBL1328677 | ||
| 2671 | GFER | DRUGGABLE GENOME, ENZYME, GROWTH FACTOR | PHENELZINE SULFATE | PHENELZINE SULFATE | ||
| 2671 | GFER | DRUGGABLE GENOME, ENZYME, GROWTH FACTOR | CHLORPROMAZINE HYDROCHLORIDE | CHLORPROMAZINE HYDROCHLORIDE | ||
| 2671 | GFER | DRUGGABLE GENOME, ENZYME, GROWTH FACTOR | DOPAMINE HYDROCHLORIDE | DOPAMINE HYDROCHLORIDE | ||
| 2671 | GFER | DRUGGABLE GENOME, ENZYME, GROWTH FACTOR | AMSACRINE HYDROCHLORIDE | AMSACRINE HYDROCHLORIDE | ||
| 2671 | GFER | DRUGGABLE GENOME, ENZYME, GROWTH FACTOR | PROMETHAZINE HYDROCHLORIDE | PROMETHAZINE HYDROCHLORIDE |
| Page: 1 2 3 4 5 |

Copyright 2023-Present -The University of Texas Health Science Center at Houston |