
|
|||||
|
 | |
| |
| |
| |
| |
| |
|
Gene: GET1 |
Gene summary for GET1 |
| Gene information | Species | Human | Gene symbol | GET1 | Gene ID | 7485 |
| Gene name | guided entry of tail-anchored proteins factor 1 | |
| Gene Alias | CHD5 | |
| Cytomap | 21q22.2 | |
| Gene Type | protein-coding | GO ID | GO:0006996 | UniProtAcc | O00258 |
Top |
Malignant transformation analysis |
| Identification of the aberrant gene expression in precancerous and cancerous lesions by comparing the gene expression of stem-like cells in diseased tissues with normal stem cells |
| Entrez ID | Symbol | Replicates | Species | Organ | Tissue | Adj P-value | Log2FC | Malignancy |
| 7485 | GET1 | LZE2T | Human | Esophagus | ESCC | 4.73e-03 | 5.15e-01 | 0.082 |
| 7485 | GET1 | LZE3D | Human | Esophagus | HGIN | 3.66e-03 | 4.85e-01 | 0.0668 |
| 7485 | GET1 | LZE4T | Human | Esophagus | ESCC | 9.66e-09 | 2.52e-01 | 0.0811 |
| 7485 | GET1 | LZE5T | Human | Esophagus | ESCC | 1.57e-03 | 2.52e-01 | 0.0514 |
| 7485 | GET1 | LZE7T | Human | Esophagus | ESCC | 6.11e-12 | 5.35e-01 | 0.0667 |
| 7485 | GET1 | LZE8T | Human | Esophagus | ESCC | 1.65e-04 | 1.89e-01 | 0.067 |
| 7485 | GET1 | LZE22T | Human | Esophagus | ESCC | 1.54e-04 | 3.36e-01 | 0.068 |
| 7485 | GET1 | LZE24T | Human | Esophagus | ESCC | 8.40e-17 | 4.27e-01 | 0.0596 |
| 7485 | GET1 | LZE21T | Human | Esophagus | ESCC | 8.02e-04 | 3.00e-01 | 0.0655 |
| 7485 | GET1 | LZE6T | Human | Esophagus | ESCC | 1.55e-08 | 3.11e-01 | 0.0845 |
| Page: 1 |
| Tissue | Expression Dynamics | Abbreviation |
| Esophagus | 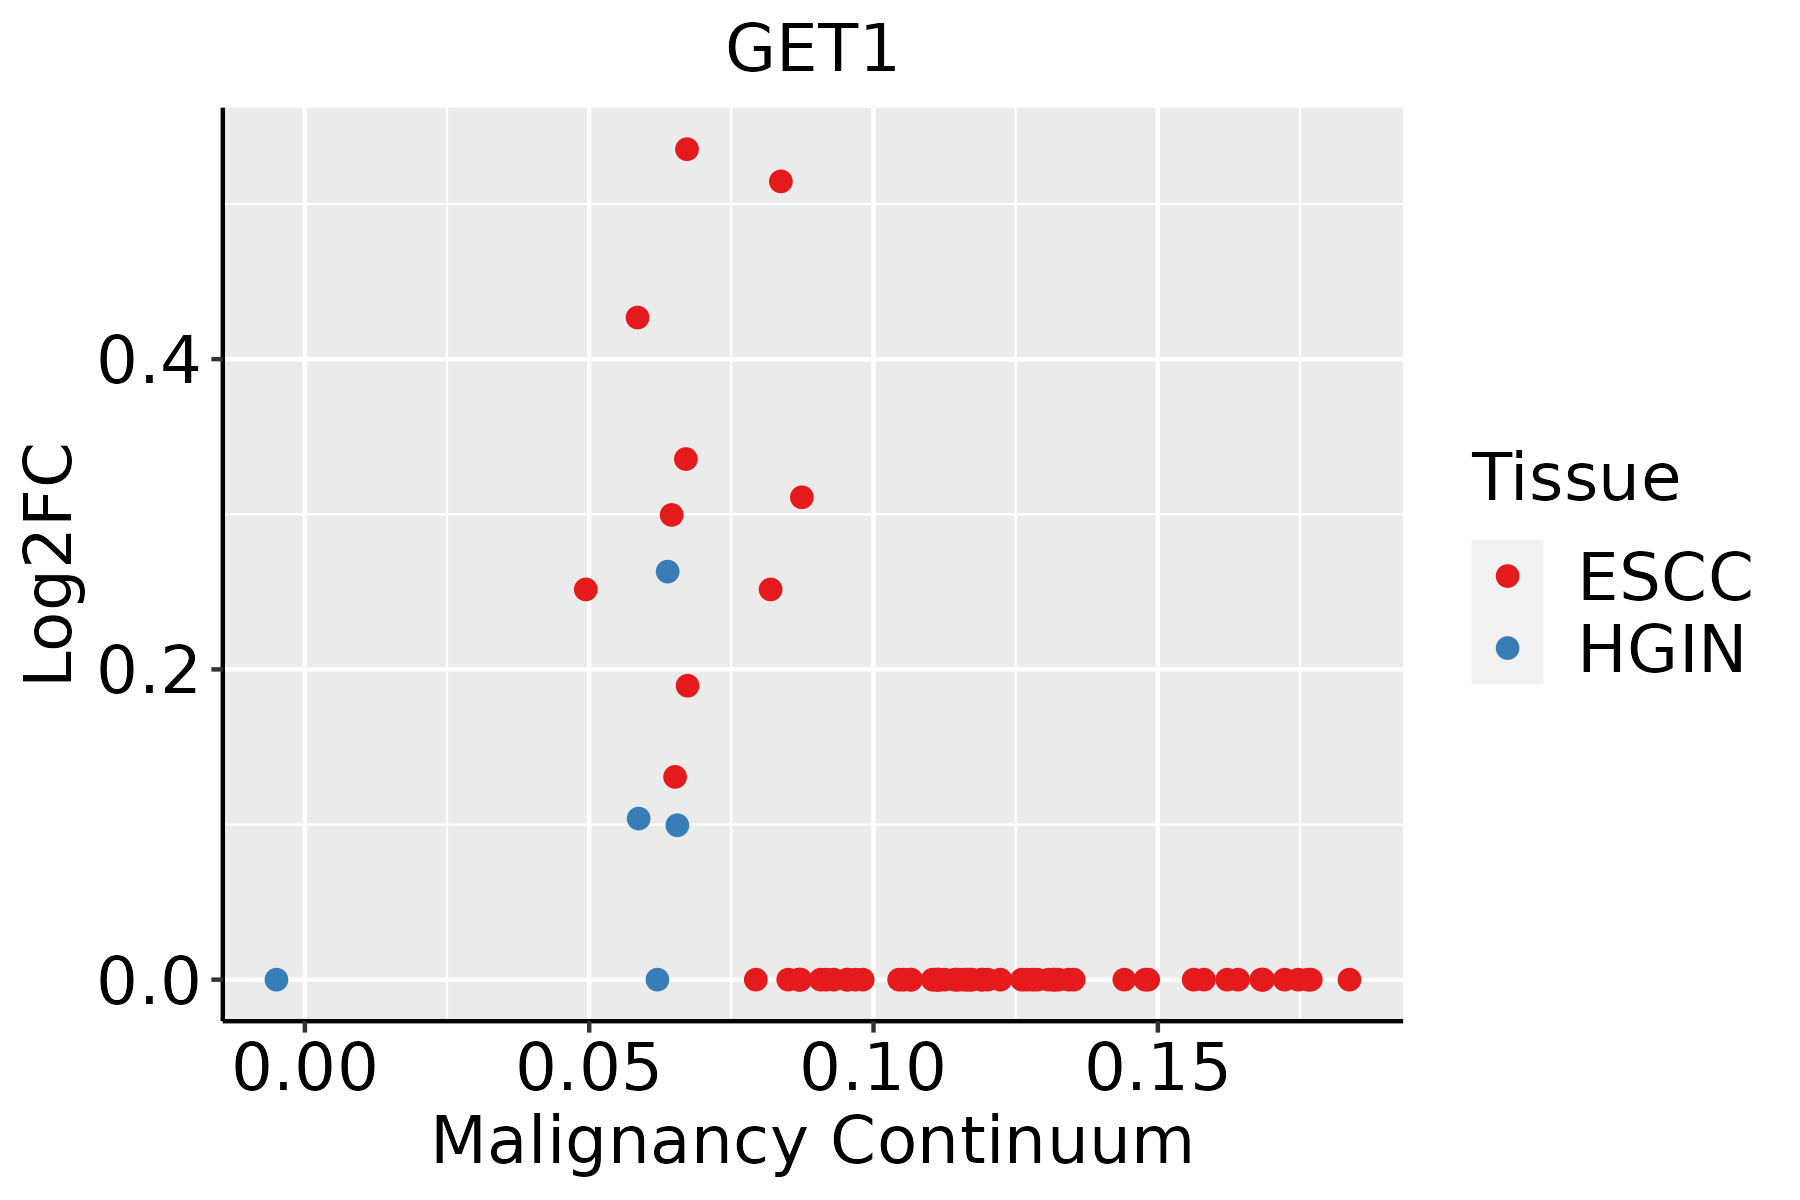 | ESCC: Esophageal squamous cell carcinoma |
| HGIN: High-grade intraepithelial neoplasias | ||
| LGIN: Low-grade intraepithelial neoplasias |
| ∗log2FC in expression of this searched gene in stem-like cells from each diseased tissue sample relative to stem-like cells in normal samples in each tissue plotted against the malignancy continuum. Samples are colored based on if they are from different disease stage. |
Top |
Malignant transformation related pathway analysis |
| Find out the enriched GO biological processes and KEGG pathways involved in transition from healthy to precancer to cancer |
| Tissue | Disease Stage | Enriched GO biological Processes |
| Colorectum | AD |  |
| Colorectum | SER |  |
| Colorectum | MSS |  |
| Colorectum | MSI-H |  |
| Colorectum | FAP |  |
| ∗Top 15 enriched GO BP terms are showed in the bar plot of each disease state in each tissue. Each row represents a significant GO biological process which is colored according to the -log10(p.adjust). |
| Page: 1 2 3 4 5 6 7 8 9 |
| GO ID | Tissue | Disease Stage | Description | Gene Ratio | Bg Ratio | pvalue | p.adjust | Count |
| GO:0031647111 | Esophagus | ESCC | regulation of protein stability | 223/8552 | 298/18723 | 5.76e-25 | 1.52e-22 | 223 |
| GO:0090150110 | Esophagus | ESCC | establishment of protein localization to membrane | 182/8552 | 260/18723 | 1.27e-15 | 8.19e-14 | 182 |
| GO:0050821111 | Esophagus | ESCC | protein stabilization | 140/8552 | 191/18723 | 6.50e-15 | 3.61e-13 | 140 |
| GO:000702914 | Esophagus | ESCC | endoplasmic reticulum organization | 65/8552 | 87/18723 | 3.28e-08 | 6.08e-07 | 65 |
| GO:005120515 | Esophagus | ESCC | protein insertion into membrane | 46/8552 | 57/18723 | 5.90e-08 | 1.04e-06 | 46 |
| GO:004504812 | Esophagus | ESCC | protein insertion into ER membrane | 21/8552 | 22/18723 | 8.75e-07 | 1.13e-05 | 21 |
| GO:007181611 | Esophagus | ESCC | tail-anchored membrane protein insertion into ER membrane | 17/8552 | 17/18723 | 1.63e-06 | 1.95e-05 | 17 |
| Page: 1 |
| Pathway ID | Tissue | Disease Stage | Description | Gene Ratio | Bg Ratio | pvalue | p.adjust | qvalue | Count |
| Page: 1 |
Top |
Cell-cell communication analysis |
| Identification of potential cell-cell interactions between two cell types and their ligand-receptor pairs for different disease states |
| Ligand | Receptor | LRpair | Pathway | Tissue | Disease Stage |
| Page: 1 |
Top |
Single-cell gene regulatory network inference analysis |
| Find out the significant the regulons (TFs) and the target genes of each regulon across cell types for different disease states |
| TF | Cell Type | Tissue | Disease Stage | Target Gene | RSS | Regulon Activity |
| ∗The dot plots of a searched regulon are shown for all cell subpopulations in each disease state of each tissue based on the regulon specific score inferred using pySCENIC and by calculating the average expression. |
| Page: 1 |
Top |
Somatic mutation of malignant transformation related genes |
| Annotation of somatic variants for genes involved in malignant transformation |
| Hugo Symbol | Variant Class | Variant Classification | dbSNP RS | HGVSc | HGVSp | HGVSp Short | SWISSPROT | BIOTYPE | SIFT | PolyPhen | Tumor Sample Barcode | Tissue | Histology | Sex | Age | Stage | Therapy Types | Drugs | Outcome |
| Page: 1 |
Top |
Related drugs of malignant transformation related genes |
| Identification of chemicals and drugs interact with genes involved in malignant transfromation |
| (DGIdb 4.0) |
| Entrez ID | Symbol | Category | Interaction Types | Drug Claim Name | Drug Name | PMIDs |
| 7485 | GET1 | NA | methylphenidate | METHYLPHENIDATE | 29382897 |
| Page: 1 |

Copyright 2023-Present -The University of Texas Health Science Center at Houston |