
|
|||||
|
 | |
| |
| |
| |
| |
| |
|
Gene: GEN1 |
Gene summary for GEN1 |
| Gene information | Species | Human | Gene symbol | GEN1 | Gene ID | 348654 |
| Gene name | GEN1 Holliday junction 5' flap endonuclease | |
| Gene Alias | Gen | |
| Cytomap | 2p24.2 | |
| Gene Type | protein-coding | GO ID | GO:0000070 | UniProtAcc | Q17RS7 |
Top |
Malignant transformation analysis |
| Identification of the aberrant gene expression in precancerous and cancerous lesions by comparing the gene expression of stem-like cells in diseased tissues with normal stem cells |
| Entrez ID | Symbol | Replicates | Species | Organ | Tissue | Adj P-value | Log2FC | Malignancy |
| 348654 | GEN1 | CCI_1 | Human | Cervix | CC | 7.76e-03 | 3.80e-01 | 0.528 |
| 348654 | GEN1 | CCI_2 | Human | Cervix | CC | 1.23e-07 | 7.40e-01 | 0.5249 |
| 348654 | GEN1 | CCI_3 | Human | Cervix | CC | 3.95e-07 | 5.45e-01 | 0.516 |
| 348654 | GEN1 | HTA11_3410_2000001011 | Human | Colorectum | AD | 2.68e-13 | -5.15e-01 | 0.0155 |
| 348654 | GEN1 | HTA11_2487_2000001011 | Human | Colorectum | SER | 2.35e-06 | -5.03e-01 | -0.1808 |
| 348654 | GEN1 | HTA11_1938_2000001011 | Human | Colorectum | AD | 4.56e-03 | -4.78e-01 | -0.0811 |
| 348654 | GEN1 | HTA11_78_2000001011 | Human | Colorectum | AD | 3.42e-05 | -4.61e-01 | -0.1088 |
| 348654 | GEN1 | HTA11_347_2000001011 | Human | Colorectum | AD | 3.53e-09 | -4.68e-01 | -0.1954 |
| 348654 | GEN1 | HTA11_3361_2000001011 | Human | Colorectum | AD | 1.49e-04 | -5.05e-01 | -0.1207 |
| 348654 | GEN1 | HTA11_83_2000001011 | Human | Colorectum | SER | 1.78e-04 | -5.28e-01 | -0.1526 |
| 348654 | GEN1 | HTA11_696_2000001011 | Human | Colorectum | AD | 1.04e-18 | -5.13e-01 | -0.1464 |
| 348654 | GEN1 | HTA11_866_2000001011 | Human | Colorectum | AD | 5.63e-18 | -5.11e-01 | -0.1001 |
| 348654 | GEN1 | HTA11_1391_2000001011 | Human | Colorectum | AD | 2.11e-05 | -4.46e-01 | -0.059 |
| 348654 | GEN1 | HTA11_2992_2000001011 | Human | Colorectum | SER | 1.88e-02 | -5.43e-01 | -0.1706 |
| 348654 | GEN1 | HTA11_5212_2000001011 | Human | Colorectum | AD | 4.23e-03 | -5.43e-01 | -0.2061 |
| 348654 | GEN1 | HTA11_546_2000001011 | Human | Colorectum | AD | 1.80e-03 | -5.25e-01 | -0.0842 |
| 348654 | GEN1 | HTA11_7862_2000001011 | Human | Colorectum | AD | 2.35e-04 | -5.43e-01 | -0.0179 |
| 348654 | GEN1 | HTA11_866_3004761011 | Human | Colorectum | AD | 1.17e-11 | -5.17e-01 | 0.096 |
| 348654 | GEN1 | HTA11_10711_2000001011 | Human | Colorectum | AD | 5.47e-08 | -5.32e-01 | 0.0338 |
| 348654 | GEN1 | HTA11_7696_3000711011 | Human | Colorectum | AD | 2.08e-20 | -5.23e-01 | 0.0674 |
| Page: 1 2 3 4 |
| Tissue | Expression Dynamics | Abbreviation |
| Cervix |  | CC: Cervix cancer |
| HSIL_HPV: HPV-infected high-grade squamous intraepithelial lesions | ||
| N_HPV: HPV-infected normal cervix | ||
| Colorectum (GSE201348) |  | FAP: Familial adenomatous polyposis |
| CRC: Colorectal cancer | ||
| Colorectum (HTA11) |  | AD: Adenomas |
| SER: Sessile serrated lesions | ||
| MSI-H: Microsatellite-high colorectal cancer | ||
| MSS: Microsatellite stable colorectal cancer | ||
| Liver | 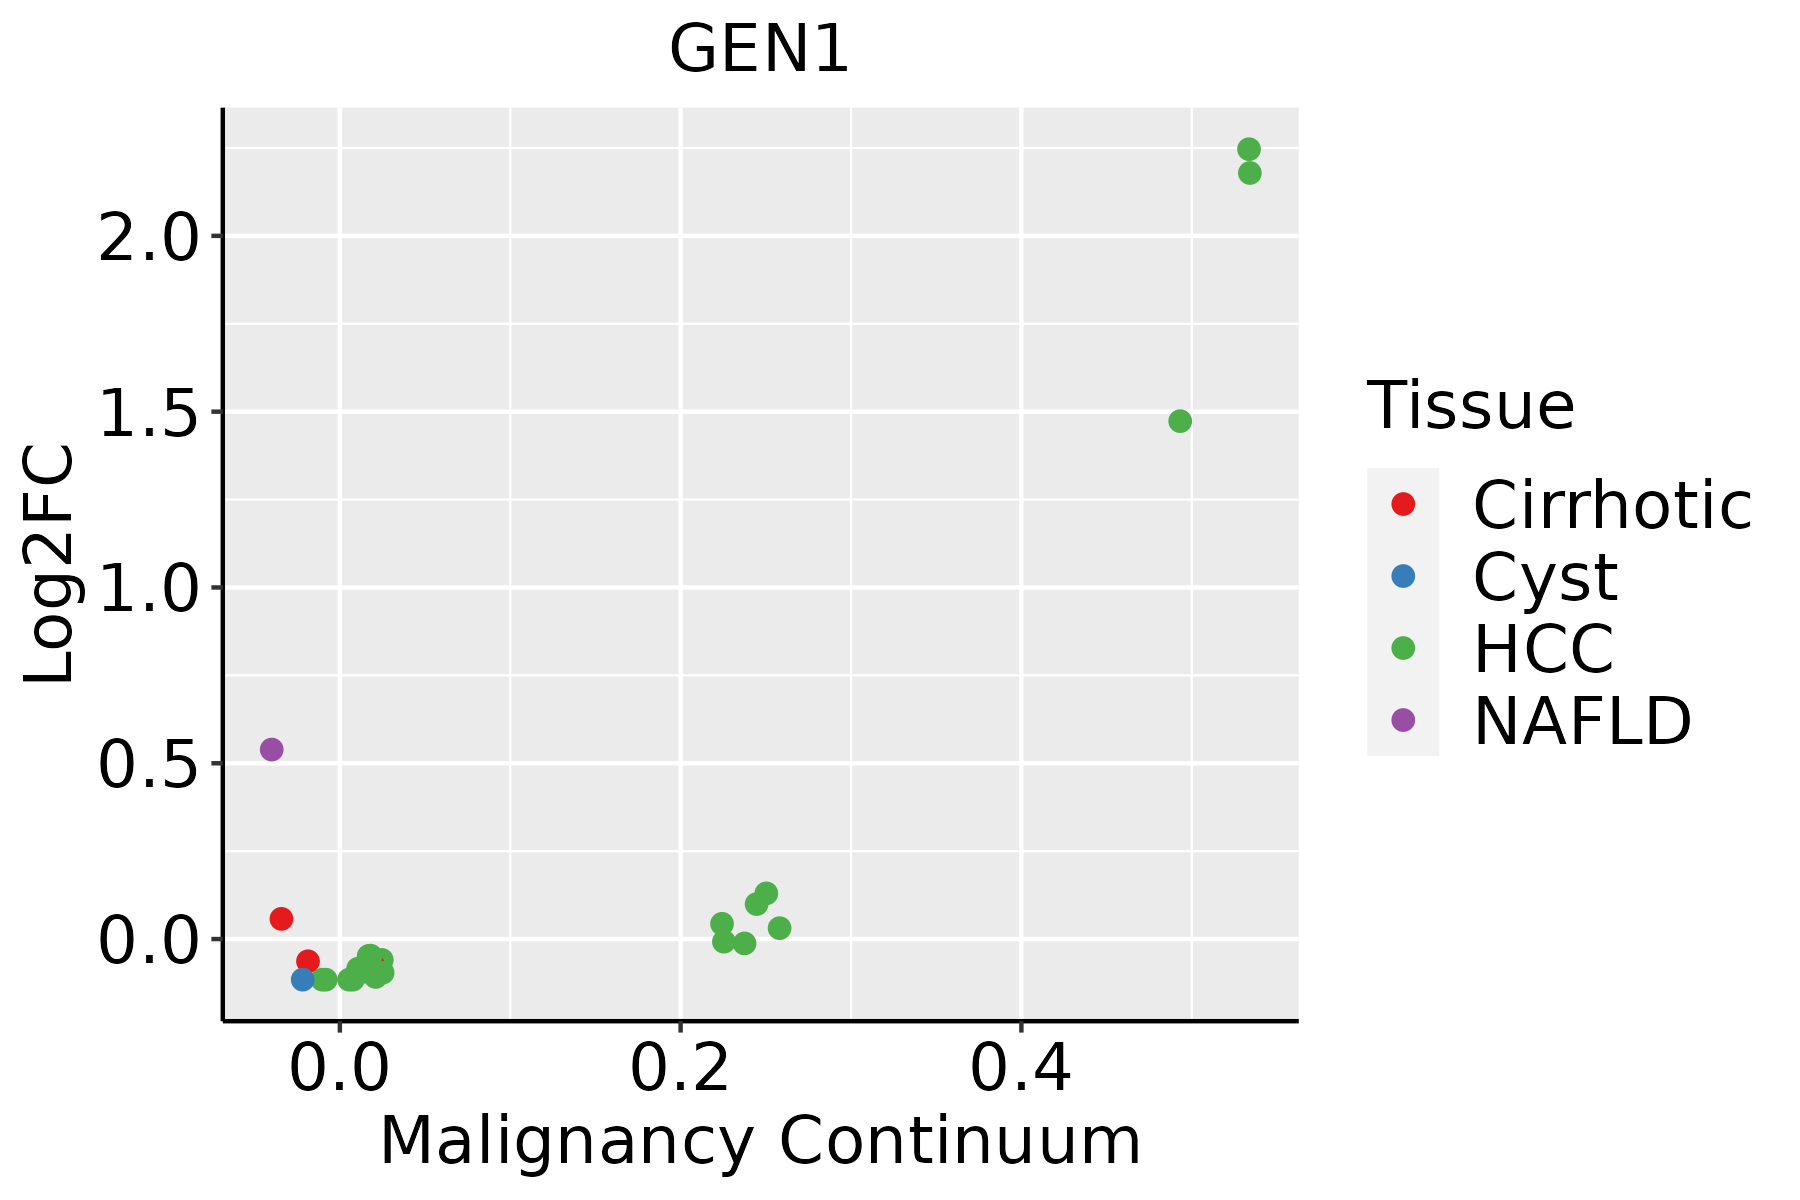 | HCC: Hepatocellular carcinoma |
| NAFLD: Non-alcoholic fatty liver disease | ||
| Thyroid | 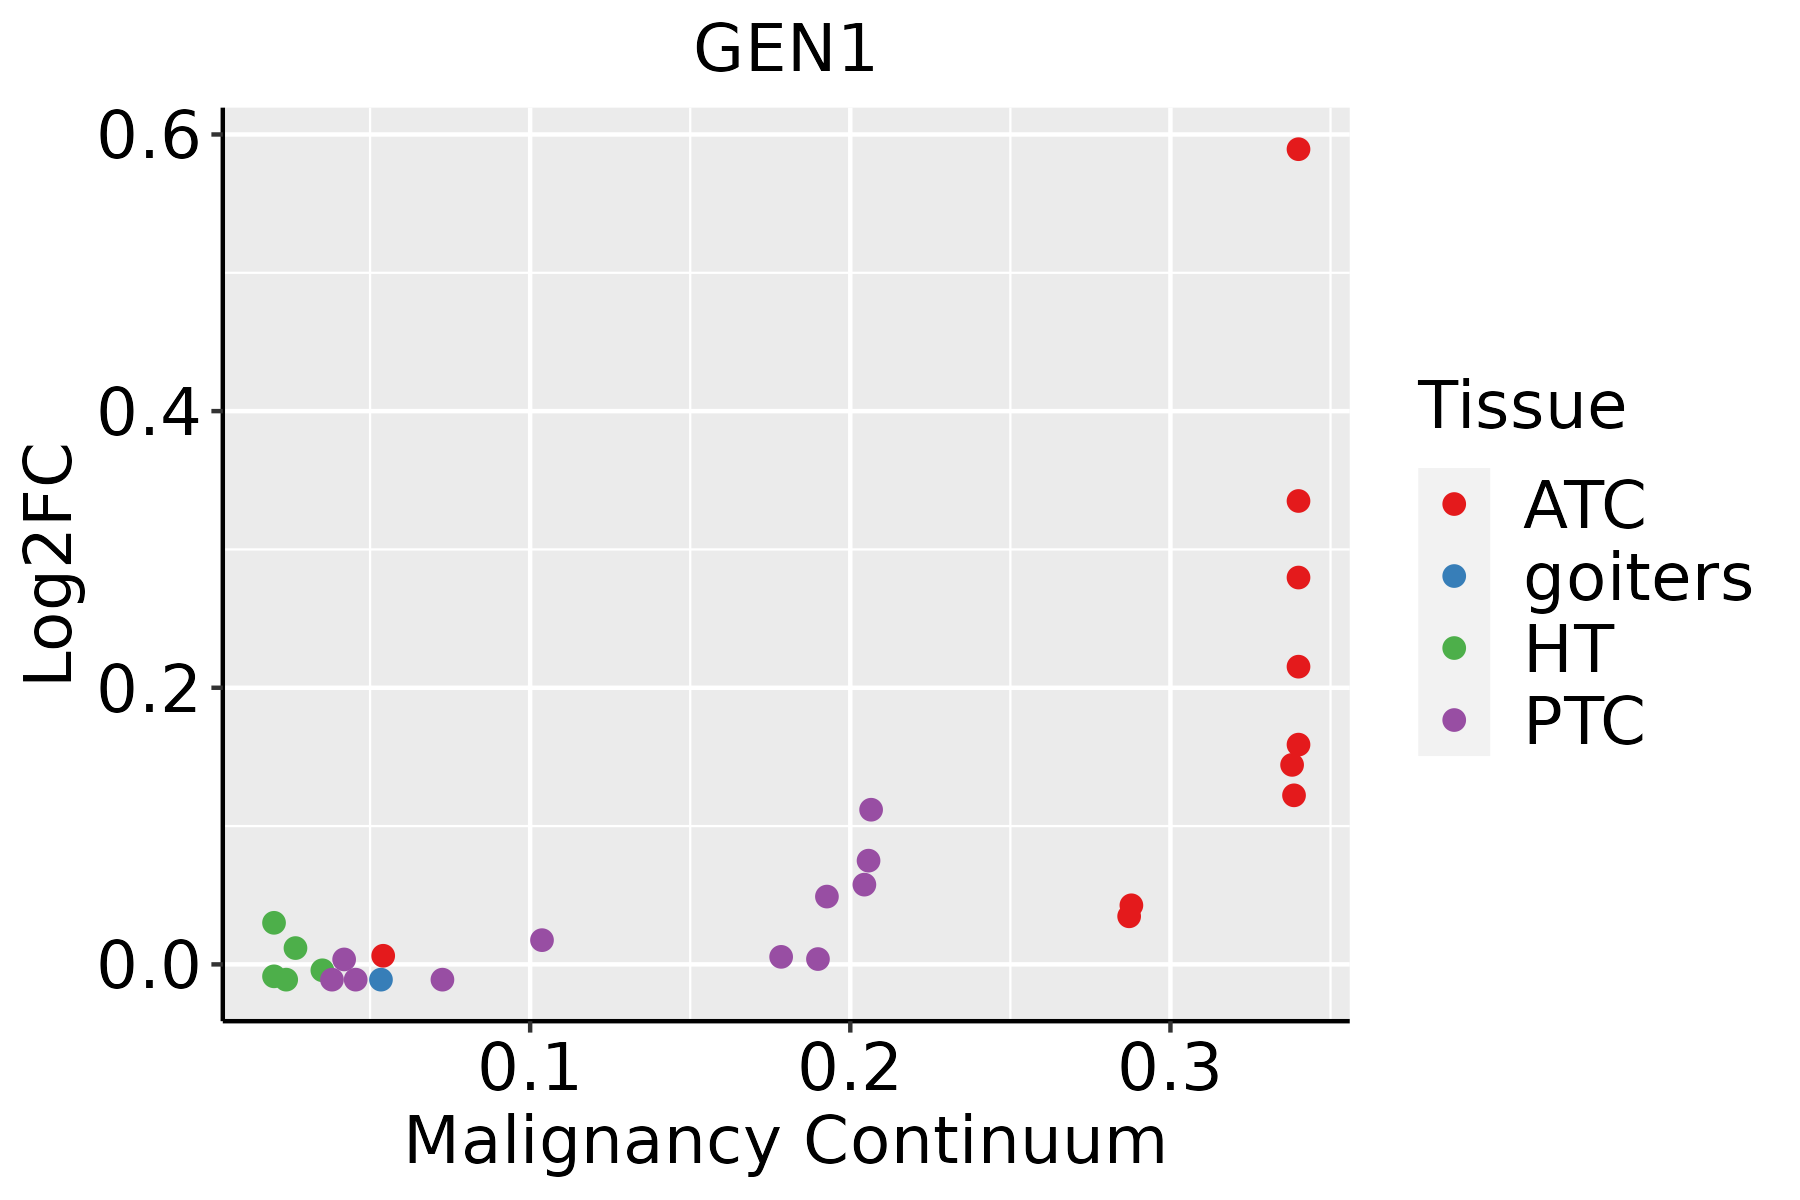 | ATC: Anaplastic thyroid cancer |
| HT: Hashimoto's thyroiditis | ||
| PTC: Papillary thyroid cancer |
| ∗log2FC in expression of this searched gene in stem-like cells from each diseased tissue sample relative to stem-like cells in normal samples in each tissue plotted against the malignancy continuum. Samples are colored based on if they are from different disease stage. |
Top |
Malignant transformation related pathway analysis |
| Find out the enriched GO biological processes and KEGG pathways involved in transition from healthy to precancer to cancer |
| Tissue | Disease Stage | Enriched GO biological Processes |
| Colorectum | AD |  |
| Colorectum | SER |  |
| Colorectum | MSS |  |
| Colorectum | MSI-H |  |
| Colorectum | FAP |  |
| ∗Top 15 enriched GO BP terms are showed in the bar plot of each disease state in each tissue. Each row represents a significant GO biological process which is colored according to the -log10(p.adjust). |
| Page: 1 2 3 4 5 6 7 8 9 |
| GO ID | Tissue | Disease Stage | Description | Gene Ratio | Bg Ratio | pvalue | p.adjust | Count |
| GO:00447725 | Cervix | CC | mitotic cell cycle phase transition | 89/2311 | 424/18723 | 2.70e-07 | 1.12e-05 | 89 |
| GO:00457876 | Cervix | CC | positive regulation of cell cycle | 66/2311 | 313/18723 | 7.78e-06 | 1.81e-04 | 66 |
| GO:00073466 | Cervix | CC | regulation of mitotic cell cycle | 88/2311 | 457/18723 | 1.26e-05 | 2.60e-04 | 88 |
| GO:19019903 | Cervix | CC | regulation of mitotic cell cycle phase transition | 63/2311 | 299/18723 | 1.27e-05 | 2.60e-04 | 63 |
| GO:00106399 | Cervix | CC | negative regulation of organelle organization | 68/2311 | 348/18723 | 7.40e-05 | 1.03e-03 | 68 |
| GO:00900685 | Cervix | CC | positive regulation of cell cycle process | 50/2311 | 236/18723 | 8.25e-05 | 1.11e-03 | 50 |
| GO:19019873 | Cervix | CC | regulation of cell cycle phase transition | 74/2311 | 390/18723 | 9.80e-05 | 1.27e-03 | 74 |
| GO:00457862 | Cervix | CC | negative regulation of cell cycle | 67/2311 | 385/18723 | 2.21e-03 | 1.59e-02 | 67 |
| GO:00062602 | Cervix | CC | DNA replication | 48/2311 | 260/18723 | 2.70e-03 | 1.85e-02 | 48 |
| GO:00459302 | Cervix | CC | negative regulation of mitotic cell cycle | 44/2311 | 235/18723 | 3.02e-03 | 1.99e-02 | 44 |
| GO:19019912 | Cervix | CC | negative regulation of mitotic cell cycle phase transition | 35/2311 | 179/18723 | 3.73e-03 | 2.38e-02 | 35 |
| GO:01400143 | Cervix | CC | mitotic nuclear division | 50/2311 | 287/18723 | 7.27e-03 | 3.91e-02 | 50 |
| GO:00109482 | Cervix | CC | negative regulation of cell cycle process | 51/2311 | 294/18723 | 7.35e-03 | 3.94e-02 | 51 |
| GO:00482851 | Cervix | CC | organelle fission | 78/2311 | 488/18723 | 9.70e-03 | 4.79e-02 | 78 |
| GO:0010639 | Colorectum | AD | negative regulation of organelle organization | 114/3918 | 348/18723 | 1.41e-07 | 6.49e-06 | 114 |
| GO:0033044 | Colorectum | AD | regulation of chromosome organization | 60/3918 | 187/18723 | 2.25e-04 | 2.94e-03 | 60 |
| GO:0007346 | Colorectum | AD | regulation of mitotic cell cycle | 119/3918 | 457/18723 | 4.60e-03 | 3.14e-02 | 119 |
| GO:0045787 | Colorectum | AD | positive regulation of cell cycle | 85/3918 | 313/18723 | 4.76e-03 | 3.22e-02 | 85 |
| GO:0140014 | Colorectum | AD | mitotic nuclear division | 78/3918 | 287/18723 | 6.48e-03 | 4.05e-02 | 78 |
| GO:0046605 | Colorectum | AD | regulation of centrosome cycle | 18/3918 | 49/18723 | 7.93e-03 | 4.73e-02 | 18 |
| Page: 1 2 3 4 5 6 7 8 9 |
| Pathway ID | Tissue | Disease Stage | Description | Gene Ratio | Bg Ratio | pvalue | p.adjust | qvalue | Count |
| Page: 1 |
Top |
Cell-cell communication analysis |
| Identification of potential cell-cell interactions between two cell types and their ligand-receptor pairs for different disease states |
| Ligand | Receptor | LRpair | Pathway | Tissue | Disease Stage |
| Page: 1 |
Top |
Single-cell gene regulatory network inference analysis |
| Find out the significant the regulons (TFs) and the target genes of each regulon across cell types for different disease states |
| TF | Cell Type | Tissue | Disease Stage | Target Gene | RSS | Regulon Activity |
| ∗The dot plots of a searched regulon are shown for all cell subpopulations in each disease state of each tissue based on the regulon specific score inferred using pySCENIC and by calculating the average expression. |
| Page: 1 |
Top |
Somatic mutation of malignant transformation related genes |
| Annotation of somatic variants for genes involved in malignant transformation |
| Hugo Symbol | Variant Class | Variant Classification | dbSNP RS | HGVSc | HGVSp | HGVSp Short | SWISSPROT | BIOTYPE | SIFT | PolyPhen | Tumor Sample Barcode | Tissue | Histology | Sex | Age | Stage | Therapy Types | Drugs | Outcome |
| GEN1 | SNV | Missense_Mutation | novel | c.147N>A | p.Met49Ile | p.M49I | Q17RS7 | protein_coding | tolerated(0.47) | benign(0.02) | TCGA-A2-A3XX-01 | Breast | breast invasive carcinoma | Female | <65 | I/II | Chemotherapy | cyclophosphamide | CR |
| GEN1 | SNV | Missense_Mutation | c.1324N>C | p.Glu442Gln | p.E442Q | Q17RS7 | protein_coding | deleterious(0.03) | benign(0.021) | TCGA-AC-A23H-01 | Breast | breast invasive carcinoma | Female | >=65 | I/II | Unknown | Unknown | PD | |
| GEN1 | SNV | Missense_Mutation | rs748104572 | c.275C>T | p.Ser92Phe | p.S92F | Q17RS7 | protein_coding | deleterious(0.01) | benign(0.021) | TCGA-2W-A8YY-01 | Cervix | cervical & endocervical cancer | Female | <65 | I/II | Chemotherapy | cisplatin | CR |
| GEN1 | SNV | Missense_Mutation | novel | c.629T>G | p.Leu210Arg | p.L210R | Q17RS7 | protein_coding | deleterious(0) | possibly_damaging(0.898) | TCGA-2W-A8YY-01 | Cervix | cervical & endocervical cancer | Female | <65 | I/II | Chemotherapy | cisplatin | CR |
| GEN1 | SNV | Missense_Mutation | c.2405N>G | p.Ser802Cys | p.S802C | Q17RS7 | protein_coding | deleterious(0) | probably_damaging(0.909) | TCGA-EK-A2PL-01 | Cervix | cervical & endocervical cancer | Female | <65 | III/IV | Unknown | Unknown | SD | |
| GEN1 | SNV | Missense_Mutation | c.2486C>T | p.Ser829Leu | p.S829L | Q17RS7 | protein_coding | tolerated(0.6) | benign(0) | TCGA-IR-A3LA-01 | Cervix | cervical & endocervical cancer | Female | <65 | I/II | Chemotherapy | cisplatin | CR | |
| GEN1 | deletion | Frame_Shift_Del | novel | c.2138_2180delNNNNNNNNNNNNNNNNNNNNNNNNNNNNNNNNNNNNNNNNNNN | p.Asp714CysfsTer11 | p.D714Cfs*11 | Q17RS7 | protein_coding | TCGA-C5-A8XH-01 | Cervix | cervical & endocervical cancer | Female | <65 | I/II | Unknown | Unknown | SD | ||
| GEN1 | SNV | Missense_Mutation | c.797N>G | p.His266Arg | p.H266R | Q17RS7 | protein_coding | deleterious(0) | probably_damaging(0.987) | TCGA-A6-6781-01 | Colorectum | colon adenocarcinoma | Male | <65 | III/IV | Chemotherapy | oxaliplatin | SD | |
| GEN1 | SNV | Missense_Mutation | novel | c.170T>A | p.Phe57Tyr | p.F57Y | Q17RS7 | protein_coding | tolerated(0.05) | possibly_damaging(0.899) | TCGA-AA-3984-01 | Colorectum | colon adenocarcinoma | Female | <65 | I/II | Unknown | Unknown | SD |
| GEN1 | SNV | Missense_Mutation | novel | c.1948G>A | p.Asp650Asn | p.D650N | Q17RS7 | protein_coding | tolerated(0.24) | benign(0.011) | TCGA-AA-3984-01 | Colorectum | colon adenocarcinoma | Female | <65 | I/II | Unknown | Unknown | SD |
| Page: 1 2 3 4 5 6 7 8 9 |
Top |
Related drugs of malignant transformation related genes |
| Identification of chemicals and drugs interact with genes involved in malignant transfromation |
| (DGIdb 4.0) |
| Entrez ID | Symbol | Category | Interaction Types | Drug Claim Name | Drug Name | PMIDs |
| Page: 1 |

Copyright 2023-Present -The University of Texas Health Science Center at Houston |