
|
|||||
|
 | |
| |
| |
| |
| |
| |
|
Gene: GEMIN6 |
Gene summary for GEMIN6 |
| Gene information | Species | Human | Gene symbol | GEMIN6 | Gene ID | 79833 |
| Gene name | gem nuclear organelle associated protein 6 | |
| Gene Alias | GEMIN6 | |
| Cytomap | 2p22.1 | |
| Gene Type | protein-coding | GO ID | GO:0000245 | UniProtAcc | Q8WXD5 |
Top |
Malignant transformation analysis |
| Identification of the aberrant gene expression in precancerous and cancerous lesions by comparing the gene expression of stem-like cells in diseased tissues with normal stem cells |
| Entrez ID | Symbol | Replicates | Species | Organ | Tissue | Adj P-value | Log2FC | Malignancy |
| 79833 | GEMIN6 | LZE4T | Human | Esophagus | ESCC | 7.14e-04 | 2.56e-01 | 0.0811 |
| 79833 | GEMIN6 | LZE7T | Human | Esophagus | ESCC | 9.99e-04 | 2.50e-01 | 0.0667 |
| 79833 | GEMIN6 | LZE24T | Human | Esophagus | ESCC | 2.40e-07 | 3.21e-01 | 0.0596 |
| 79833 | GEMIN6 | LZE6T | Human | Esophagus | ESCC | 1.65e-03 | 3.49e-01 | 0.0845 |
| 79833 | GEMIN6 | P2T-E | Human | Esophagus | ESCC | 1.17e-24 | 4.95e-01 | 0.1177 |
| 79833 | GEMIN6 | P4T-E | Human | Esophagus | ESCC | 1.91e-23 | 6.76e-01 | 0.1323 |
| 79833 | GEMIN6 | P5T-E | Human | Esophagus | ESCC | 7.19e-21 | 3.64e-01 | 0.1327 |
| 79833 | GEMIN6 | P8T-E | Human | Esophagus | ESCC | 5.79e-11 | 2.29e-01 | 0.0889 |
| 79833 | GEMIN6 | P9T-E | Human | Esophagus | ESCC | 3.14e-11 | 3.22e-01 | 0.1131 |
| 79833 | GEMIN6 | P10T-E | Human | Esophagus | ESCC | 9.15e-16 | 2.26e-01 | 0.116 |
| 79833 | GEMIN6 | P11T-E | Human | Esophagus | ESCC | 2.85e-09 | 3.81e-01 | 0.1426 |
| 79833 | GEMIN6 | P12T-E | Human | Esophagus | ESCC | 2.11e-28 | 4.91e-01 | 0.1122 |
| 79833 | GEMIN6 | P15T-E | Human | Esophagus | ESCC | 4.23e-14 | 3.96e-01 | 0.1149 |
| 79833 | GEMIN6 | P16T-E | Human | Esophagus | ESCC | 1.90e-25 | 4.15e-01 | 0.1153 |
| 79833 | GEMIN6 | P17T-E | Human | Esophagus | ESCC | 1.28e-05 | 3.39e-01 | 0.1278 |
| 79833 | GEMIN6 | P19T-E | Human | Esophagus | ESCC | 1.04e-02 | 4.85e-01 | 0.1662 |
| 79833 | GEMIN6 | P20T-E | Human | Esophagus | ESCC | 6.85e-10 | 2.80e-01 | 0.1124 |
| 79833 | GEMIN6 | P21T-E | Human | Esophagus | ESCC | 6.92e-23 | 4.34e-01 | 0.1617 |
| 79833 | GEMIN6 | P22T-E | Human | Esophagus | ESCC | 7.20e-32 | 5.62e-01 | 0.1236 |
| 79833 | GEMIN6 | P23T-E | Human | Esophagus | ESCC | 1.03e-18 | 5.48e-01 | 0.108 |
| Page: 1 2 3 4 5 |
| Tissue | Expression Dynamics | Abbreviation |
| Esophagus | 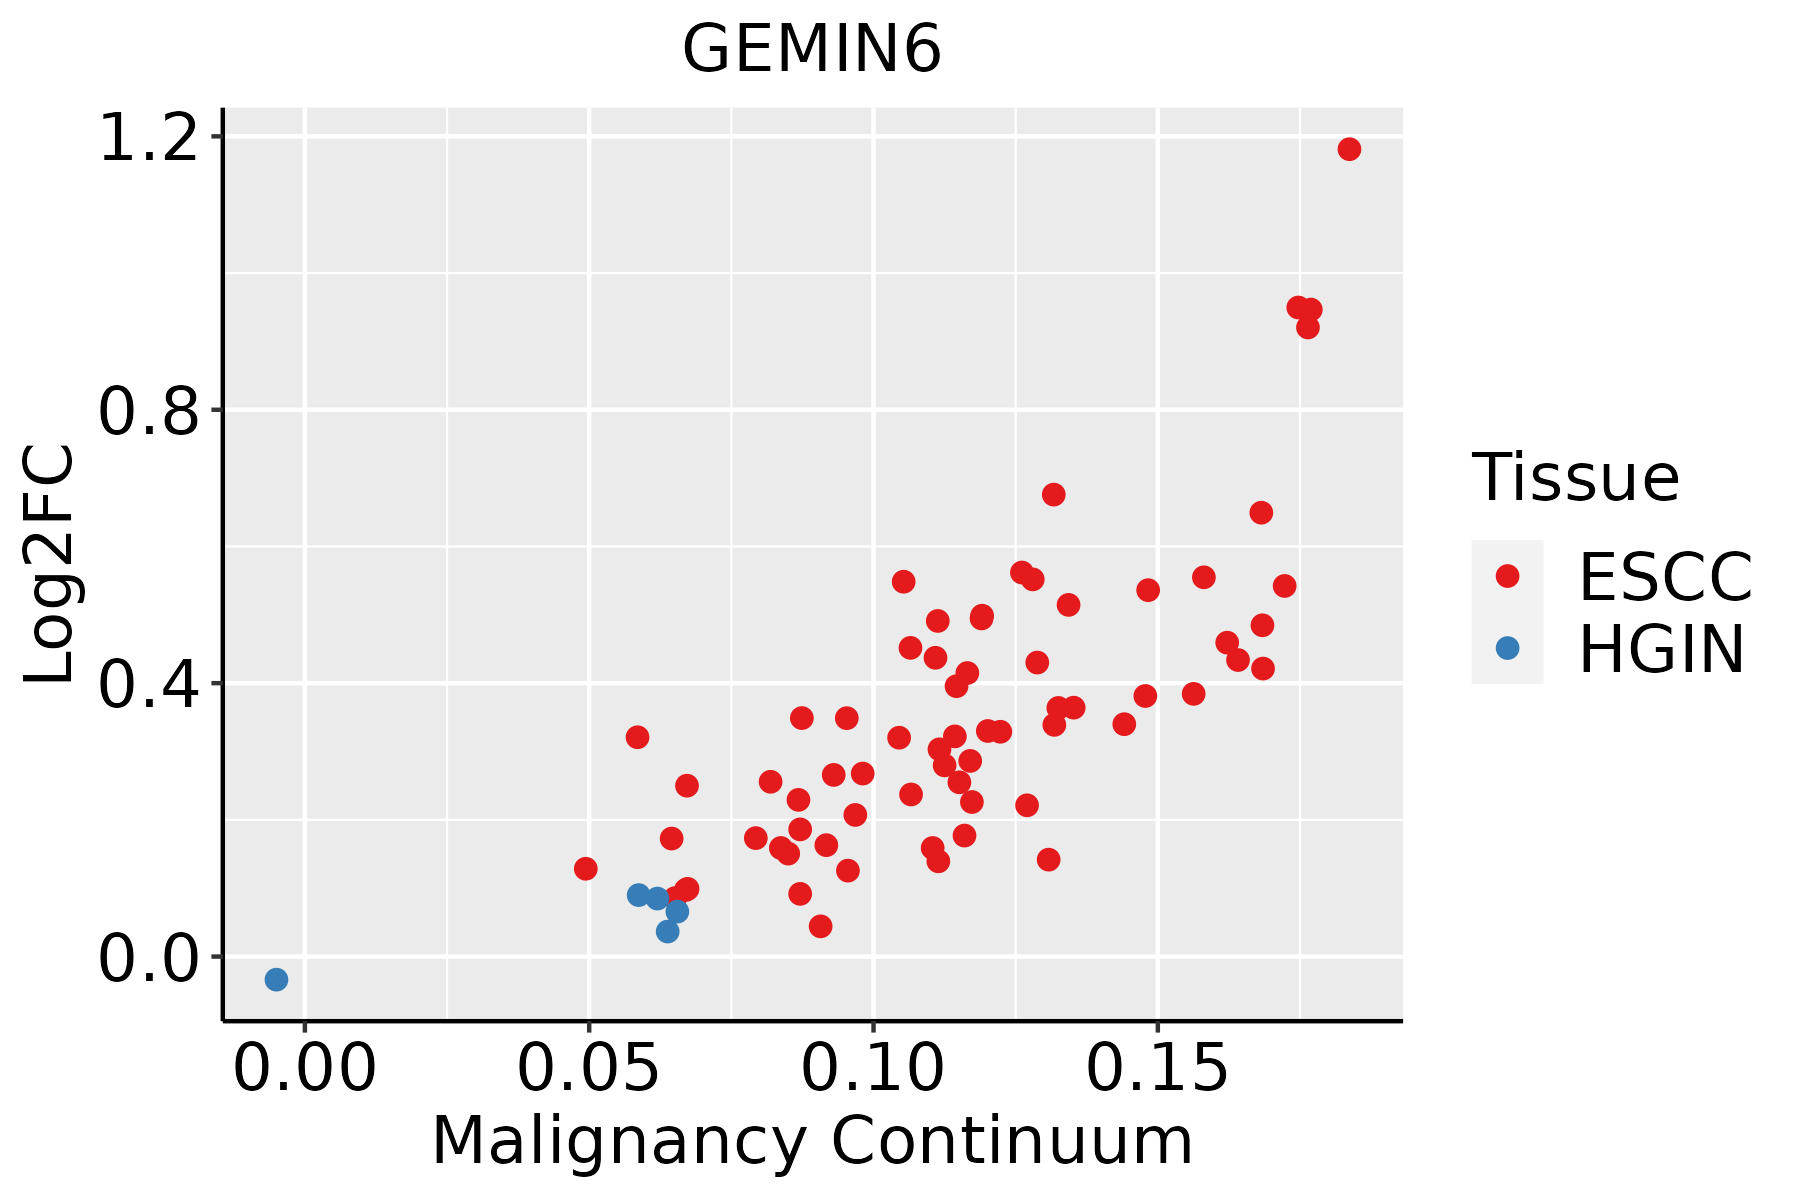 | ESCC: Esophageal squamous cell carcinoma |
| HGIN: High-grade intraepithelial neoplasias | ||
| LGIN: Low-grade intraepithelial neoplasias | ||
| Liver | 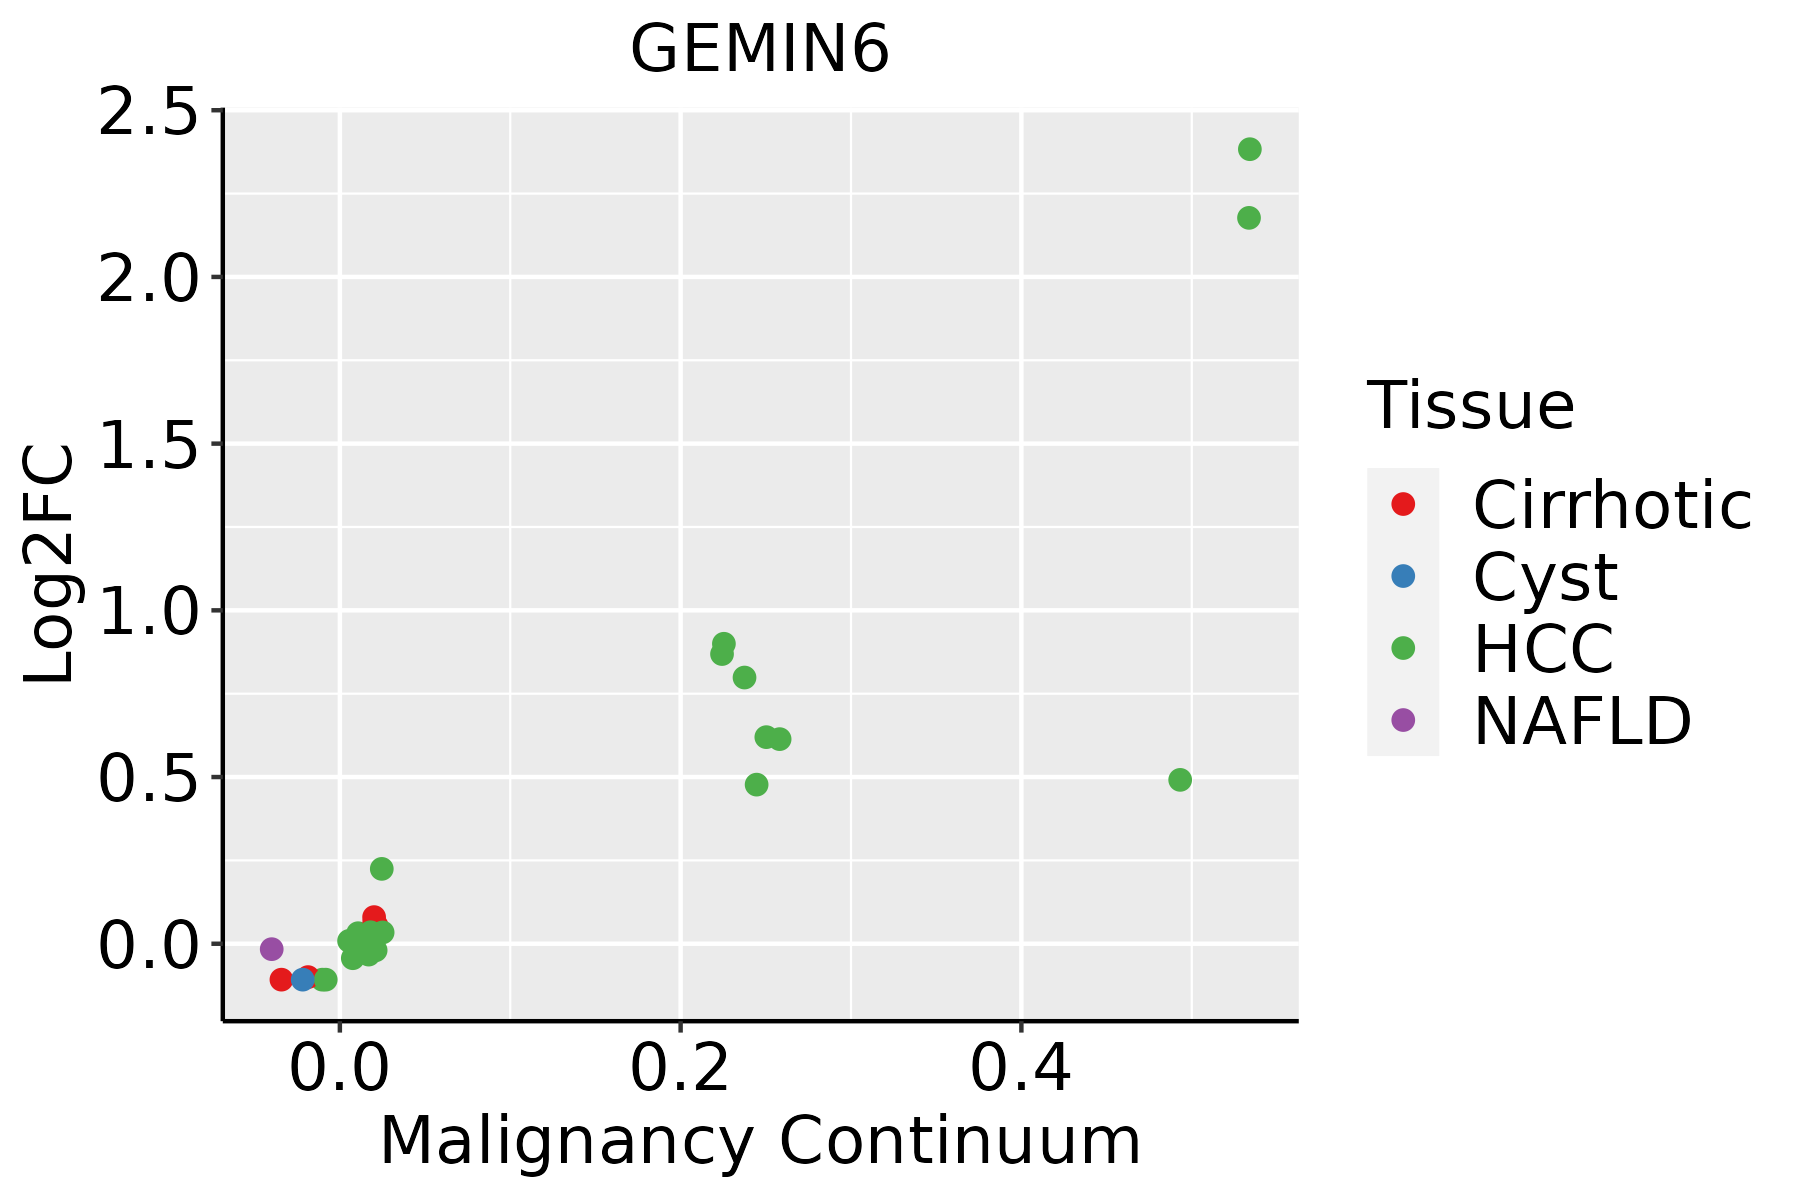 | HCC: Hepatocellular carcinoma |
| NAFLD: Non-alcoholic fatty liver disease | ||
| Oral Cavity | 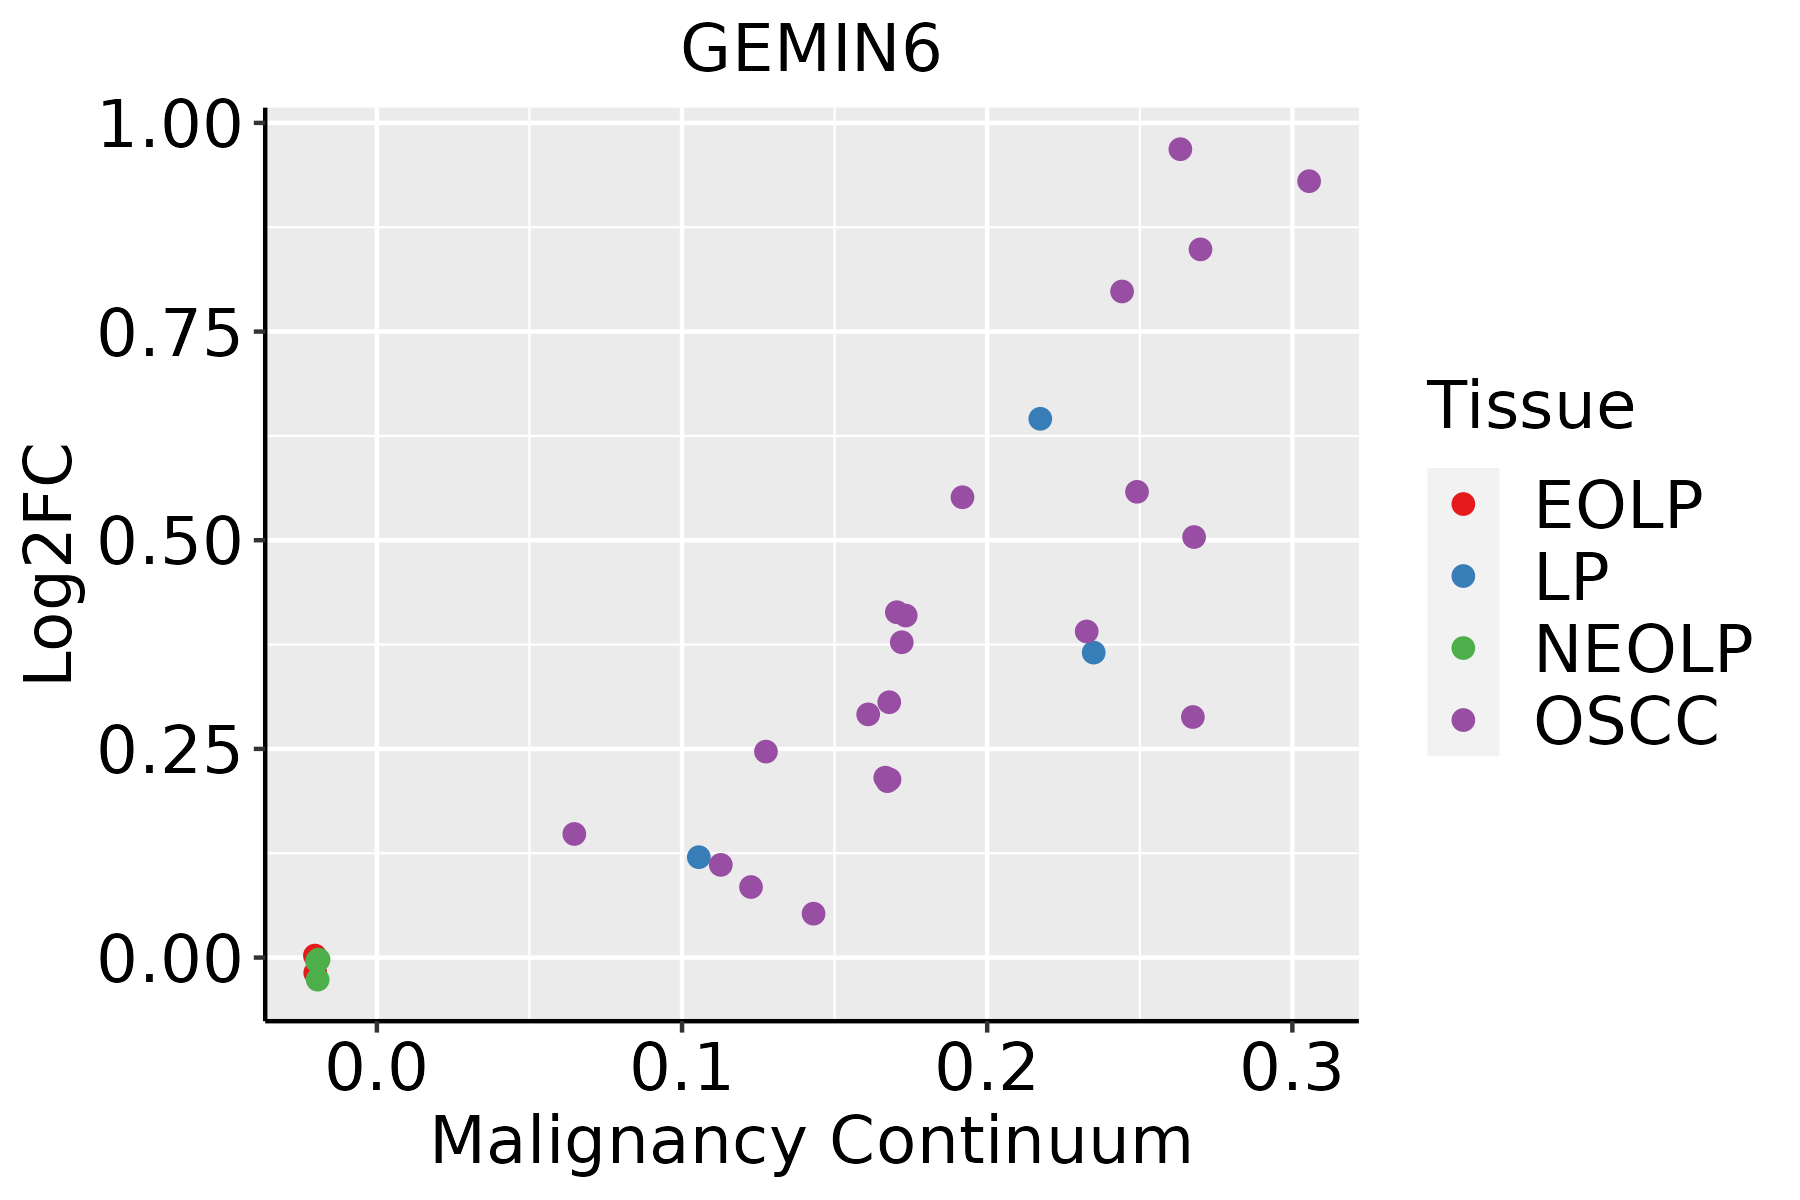 | EOLP: Erosive Oral lichen planus |
| LP: leukoplakia | ||
| NEOLP: Non-erosive oral lichen planus | ||
| OSCC: Oral squamous cell carcinoma | ||
| Skin | 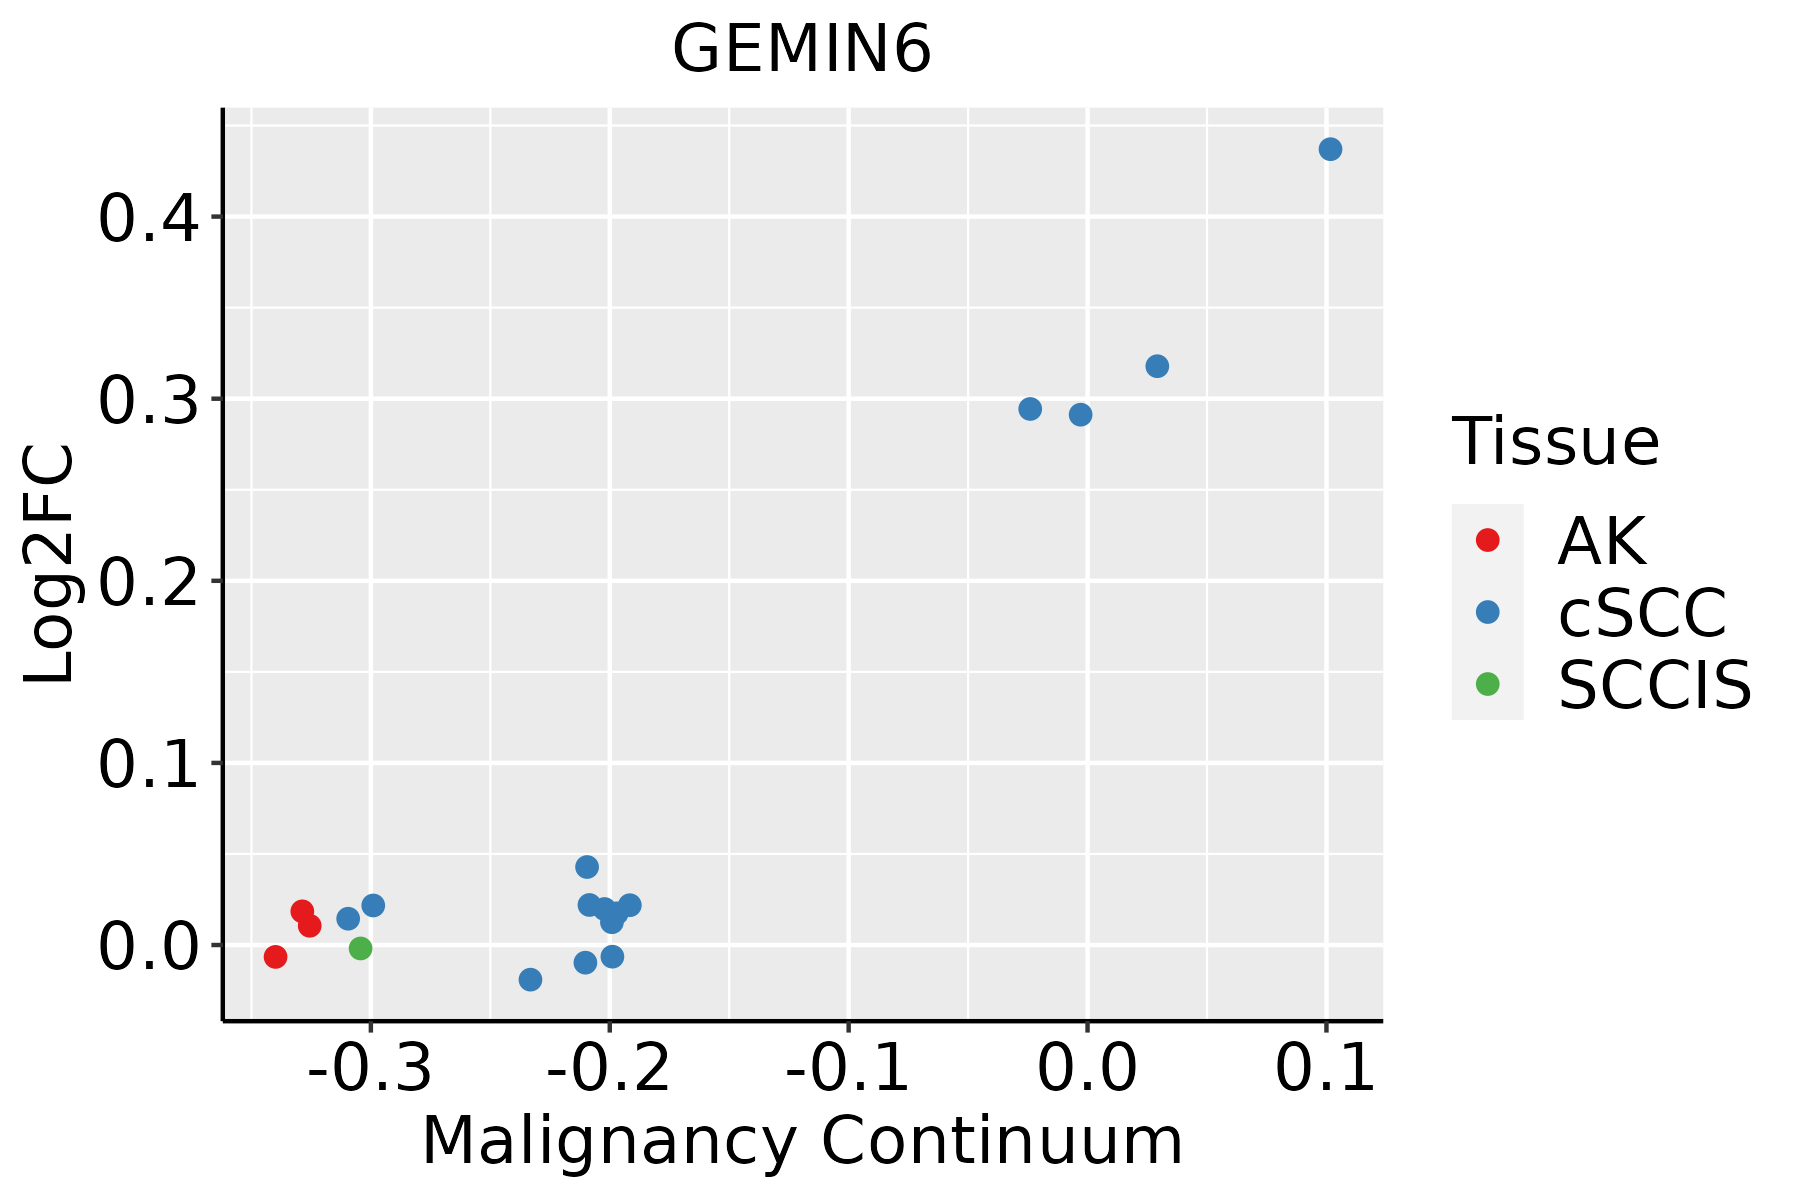 | AK: Actinic keratosis |
| cSCC: Cutaneous squamous cell carcinoma | ||
| SCCIS:squamous cell carcinoma in situ |
| ∗log2FC in expression of this searched gene in stem-like cells from each diseased tissue sample relative to stem-like cells in normal samples in each tissue plotted against the malignancy continuum. Samples are colored based on if they are from different disease stage. |
Top |
Malignant transformation related pathway analysis |
| Find out the enriched GO biological processes and KEGG pathways involved in transition from healthy to precancer to cancer |
| Tissue | Disease Stage | Enriched GO biological Processes |
| Colorectum | AD |  |
| Colorectum | SER |  |
| Colorectum | MSS |  |
| Colorectum | MSI-H |  |
| Colorectum | FAP |  |
| ∗Top 15 enriched GO BP terms are showed in the bar plot of each disease state in each tissue. Each row represents a significant GO biological process which is colored according to the -log10(p.adjust). |
| Page: 1 2 3 4 5 6 7 8 9 |
| GO ID | Tissue | Disease Stage | Description | Gene Ratio | Bg Ratio | pvalue | p.adjust | Count |
| GO:0022613111 | Esophagus | ESCC | ribonucleoprotein complex biogenesis | 365/8552 | 463/18723 | 1.74e-49 | 1.11e-45 | 365 |
| GO:0008380111 | Esophagus | ESCC | RNA splicing | 336/8552 | 434/18723 | 1.74e-42 | 3.67e-39 | 336 |
| GO:0000375111 | Esophagus | ESCC | RNA splicing, via transesterification reactions | 248/8552 | 324/18723 | 3.05e-30 | 1.49e-27 | 248 |
| GO:0000377111 | Esophagus | ESCC | RNA splicing, via transesterification reactions with bulged adenosine as nucleophile | 244/8552 | 320/18723 | 2.52e-29 | 1.07e-26 | 244 |
| GO:0000398111 | Esophagus | ESCC | mRNA splicing, via spliceosome | 244/8552 | 320/18723 | 2.52e-29 | 1.07e-26 | 244 |
| GO:0071826111 | Esophagus | ESCC | ribonucleoprotein complex subunit organization | 166/8552 | 227/18723 | 2.94e-17 | 2.42e-15 | 166 |
| GO:0022618111 | Esophagus | ESCC | ribonucleoprotein complex assembly | 159/8552 | 220/18723 | 8.19e-16 | 5.71e-14 | 159 |
| GO:000024514 | Esophagus | ESCC | spliceosomal complex assembly | 48/8552 | 79/18723 | 4.93e-03 | 1.89e-02 | 48 |
| GO:00003875 | Esophagus | ESCC | spliceosomal snRNP assembly | 32/8552 | 50/18723 | 6.90e-03 | 2.52e-02 | 32 |
| GO:002261322 | Liver | HCC | ribonucleoprotein complex biogenesis | 355/7958 | 463/18723 | 7.76e-52 | 4.92e-48 | 355 |
| GO:000838022 | Liver | HCC | RNA splicing | 313/7958 | 434/18723 | 1.36e-36 | 1.73e-33 | 313 |
| GO:000037522 | Liver | HCC | RNA splicing, via transesterification reactions | 228/7958 | 324/18723 | 1.47e-24 | 4.06e-22 | 228 |
| GO:000037722 | Liver | HCC | RNA splicing, via transesterification reactions with bulged adenosine as nucleophile | 224/7958 | 320/18723 | 1.16e-23 | 2.62e-21 | 224 |
| GO:000039822 | Liver | HCC | mRNA splicing, via spliceosome | 224/7958 | 320/18723 | 1.16e-23 | 2.62e-21 | 224 |
| GO:007182622 | Liver | HCC | ribonucleoprotein complex subunit organization | 159/7958 | 227/18723 | 3.14e-17 | 3.06e-15 | 159 |
| GO:002261822 | Liver | HCC | ribonucleoprotein complex assembly | 153/7958 | 220/18723 | 3.44e-16 | 2.91e-14 | 153 |
| GO:000024511 | Liver | HCC | spliceosomal complex assembly | 46/7958 | 79/18723 | 3.45e-03 | 1.56e-02 | 46 |
| GO:00003872 | Liver | HCC | spliceosomal snRNP assembly | 31/7958 | 50/18723 | 4.23e-03 | 1.84e-02 | 31 |
| GO:002261320 | Oral cavity | OSCC | ribonucleoprotein complex biogenesis | 333/7305 | 463/18723 | 8.28e-48 | 5.24e-44 | 333 |
| GO:000838020 | Oral cavity | OSCC | RNA splicing | 308/7305 | 434/18723 | 2.43e-42 | 7.70e-39 | 308 |
| Page: 1 2 3 |
| Pathway ID | Tissue | Disease Stage | Description | Gene Ratio | Bg Ratio | pvalue | p.adjust | qvalue | Count |
| Page: 1 |
Top |
Cell-cell communication analysis |
| Identification of potential cell-cell interactions between two cell types and their ligand-receptor pairs for different disease states |
| Ligand | Receptor | LRpair | Pathway | Tissue | Disease Stage |
| Page: 1 |
Top |
Single-cell gene regulatory network inference analysis |
| Find out the significant the regulons (TFs) and the target genes of each regulon across cell types for different disease states |
| TF | Cell Type | Tissue | Disease Stage | Target Gene | RSS | Regulon Activity |
| ∗The dot plots of a searched regulon are shown for all cell subpopulations in each disease state of each tissue based on the regulon specific score inferred using pySCENIC and by calculating the average expression. |
| Page: 1 |
Top |
Somatic mutation of malignant transformation related genes |
| Annotation of somatic variants for genes involved in malignant transformation |
| Hugo Symbol | Variant Class | Variant Classification | dbSNP RS | HGVSc | HGVSp | HGVSp Short | SWISSPROT | BIOTYPE | SIFT | PolyPhen | Tumor Sample Barcode | Tissue | Histology | Sex | Age | Stage | Therapy Types | Drugs | Outcome |
| GEMIN6 | SNV | Missense_Mutation | novel | c.95N>T | p.Gly32Val | p.G32V | Q8WXD5 | protein_coding | deleterious(0) | probably_damaging(1) | TCGA-LL-A7SZ-01 | Breast | breast invasive carcinoma | Female | <65 | I/II | Chemotherapy | adriamycin | CR |
| GEMIN6 | deletion | Frame_Shift_Del | novel | c.189delN | p.His63GlnfsTer9 | p.H63Qfs*9 | Q8WXD5 | protein_coding | TCGA-EW-A2FV-01 | Breast | breast invasive carcinoma | Female | <65 | III/IV | Chemotherapy | docetaxel | SD | ||
| GEMIN6 | SNV | Missense_Mutation | novel | c.449T>G | p.Ile150Ser | p.I150S | Q8WXD5 | protein_coding | deleterious(0) | probably_damaging(0.999) | TCGA-AA-3984-01 | Colorectum | colon adenocarcinoma | Female | <65 | I/II | Unknown | Unknown | SD |
| GEMIN6 | SNV | Missense_Mutation | rs770742111 | c.40N>T | p.Asp14Tyr | p.D14Y | Q8WXD5 | protein_coding | deleterious(0.04) | possibly_damaging(0.701) | TCGA-AZ-4315-01 | Colorectum | colon adenocarcinoma | Male | <65 | I/II | Unknown | Unknown | SD |
| GEMIN6 | SNV | Missense_Mutation | rs760437710 | c.175N>A | p.Gly59Arg | p.G59R | Q8WXD5 | protein_coding | deleterious(0.05) | probably_damaging(0.944) | TCGA-CA-6717-01 | Colorectum | colon adenocarcinoma | Male | <65 | I/II | Chemotherapy | oxaliplatin | CR |
| GEMIN6 | SNV | Missense_Mutation | novel | c.493N>T | p.Ala165Ser | p.A165S | Q8WXD5 | protein_coding | tolerated_low_confidence(0.27) | possibly_damaging(0.767) | TCGA-A5-A0G2-01 | Endometrium | uterine corpus endometrioid carcinoma | Female | <65 | III/IV | Unknown | Unknown | SD |
| GEMIN6 | SNV | Missense_Mutation | novel | c.336N>T | p.Lys112Asn | p.K112N | Q8WXD5 | protein_coding | deleterious(0.01) | probably_damaging(0.918) | TCGA-A5-A2K5-01 | Endometrium | uterine corpus endometrioid carcinoma | Female | >=65 | I/II | Unknown | Unknown | SD |
| GEMIN6 | SNV | Missense_Mutation | novel | c.367N>A | p.Ala123Thr | p.A123T | Q8WXD5 | protein_coding | tolerated(0.3) | benign(0) | TCGA-AP-A051-01 | Endometrium | uterine corpus endometrioid carcinoma | Female | >=65 | I/II | Unknown | Unknown | SD |
| GEMIN6 | SNV | Missense_Mutation | novel | c.300N>C | p.Glu100Asp | p.E100D | Q8WXD5 | protein_coding | tolerated(0.19) | benign(0.011) | TCGA-AP-A1DV-01 | Endometrium | uterine corpus endometrioid carcinoma | Female | <65 | I/II | Unknown | Unknown | SD |
| GEMIN6 | SNV | Missense_Mutation | novel | c.367N>A | p.Ala123Thr | p.A123T | Q8WXD5 | protein_coding | tolerated(0.3) | benign(0) | TCGA-AX-A1CE-01 | Endometrium | uterine corpus endometrioid carcinoma | Female | <65 | I/II | Unspecific | Paclitaxel | SD |
| Page: 1 2 |
Top |
Related drugs of malignant transformation related genes |
| Identification of chemicals and drugs interact with genes involved in malignant transfromation |
| (DGIdb 4.0) |
| Entrez ID | Symbol | Category | Interaction Types | Drug Claim Name | Drug Name | PMIDs |
| Page: 1 |

Copyright 2023-Present -The University of Texas Health Science Center at Houston |