
|
|||||
|
 | |
| |
| |
| |
| |
| |
|
Gene: GEMIN2 |
Gene summary for GEMIN2 |
| Gene information | Species | Human | Gene symbol | GEMIN2 | Gene ID | 8487 |
| Gene name | gem nuclear organelle associated protein 2 | |
| Gene Alias | SIP1 | |
| Cytomap | 14q21.1 | |
| Gene Type | protein-coding | GO ID | GO:0000245 | UniProtAcc | O14893 |
Top |
Malignant transformation analysis |
| Identification of the aberrant gene expression in precancerous and cancerous lesions by comparing the gene expression of stem-like cells in diseased tissues with normal stem cells |
| Entrez ID | Symbol | Replicates | Species | Organ | Tissue | Adj P-value | Log2FC | Malignancy |
| 8487 | GEMIN2 | LZE2T | Human | Esophagus | ESCC | 4.73e-03 | 2.81e-01 | 0.082 |
| 8487 | GEMIN2 | LZE4T | Human | Esophagus | ESCC | 2.45e-09 | 2.24e-01 | 0.0811 |
| 8487 | GEMIN2 | LZE7T | Human | Esophagus | ESCC | 6.33e-03 | 1.50e-01 | 0.0667 |
| 8487 | GEMIN2 | LZE8T | Human | Esophagus | ESCC | 4.41e-02 | 8.25e-02 | 0.067 |
| 8487 | GEMIN2 | LZE20T | Human | Esophagus | ESCC | 4.98e-02 | 8.07e-02 | 0.0662 |
| 8487 | GEMIN2 | LZE22T | Human | Esophagus | ESCC | 1.54e-04 | 2.24e-01 | 0.068 |
| 8487 | GEMIN2 | LZE24T | Human | Esophagus | ESCC | 5.64e-10 | 2.05e-01 | 0.0596 |
| 8487 | GEMIN2 | LZE6T | Human | Esophagus | ESCC | 1.62e-02 | 1.29e-01 | 0.0845 |
| 8487 | GEMIN2 | P1T-E | Human | Esophagus | ESCC | 1.09e-04 | 2.32e-01 | 0.0875 |
| 8487 | GEMIN2 | P2T-E | Human | Esophagus | ESCC | 1.55e-12 | 1.84e-01 | 0.1177 |
| 8487 | GEMIN2 | P4T-E | Human | Esophagus | ESCC | 1.23e-24 | 4.96e-01 | 0.1323 |
| 8487 | GEMIN2 | P5T-E | Human | Esophagus | ESCC | 3.14e-18 | 4.00e-01 | 0.1327 |
| 8487 | GEMIN2 | P8T-E | Human | Esophagus | ESCC | 1.32e-26 | 5.38e-01 | 0.0889 |
| 8487 | GEMIN2 | P9T-E | Human | Esophagus | ESCC | 4.01e-04 | 1.22e-01 | 0.1131 |
| 8487 | GEMIN2 | P10T-E | Human | Esophagus | ESCC | 2.70e-20 | 3.73e-01 | 0.116 |
| 8487 | GEMIN2 | P11T-E | Human | Esophagus | ESCC | 6.08e-06 | 1.80e-01 | 0.1426 |
| 8487 | GEMIN2 | P12T-E | Human | Esophagus | ESCC | 8.81e-75 | 1.59e+00 | 0.1122 |
| 8487 | GEMIN2 | P15T-E | Human | Esophagus | ESCC | 2.27e-23 | 4.72e-01 | 0.1149 |
| 8487 | GEMIN2 | P16T-E | Human | Esophagus | ESCC | 3.03e-17 | 2.78e-01 | 0.1153 |
| 8487 | GEMIN2 | P17T-E | Human | Esophagus | ESCC | 4.48e-07 | 2.57e-01 | 0.1278 |
| Page: 1 2 3 4 |
| Tissue | Expression Dynamics | Abbreviation |
| Esophagus | 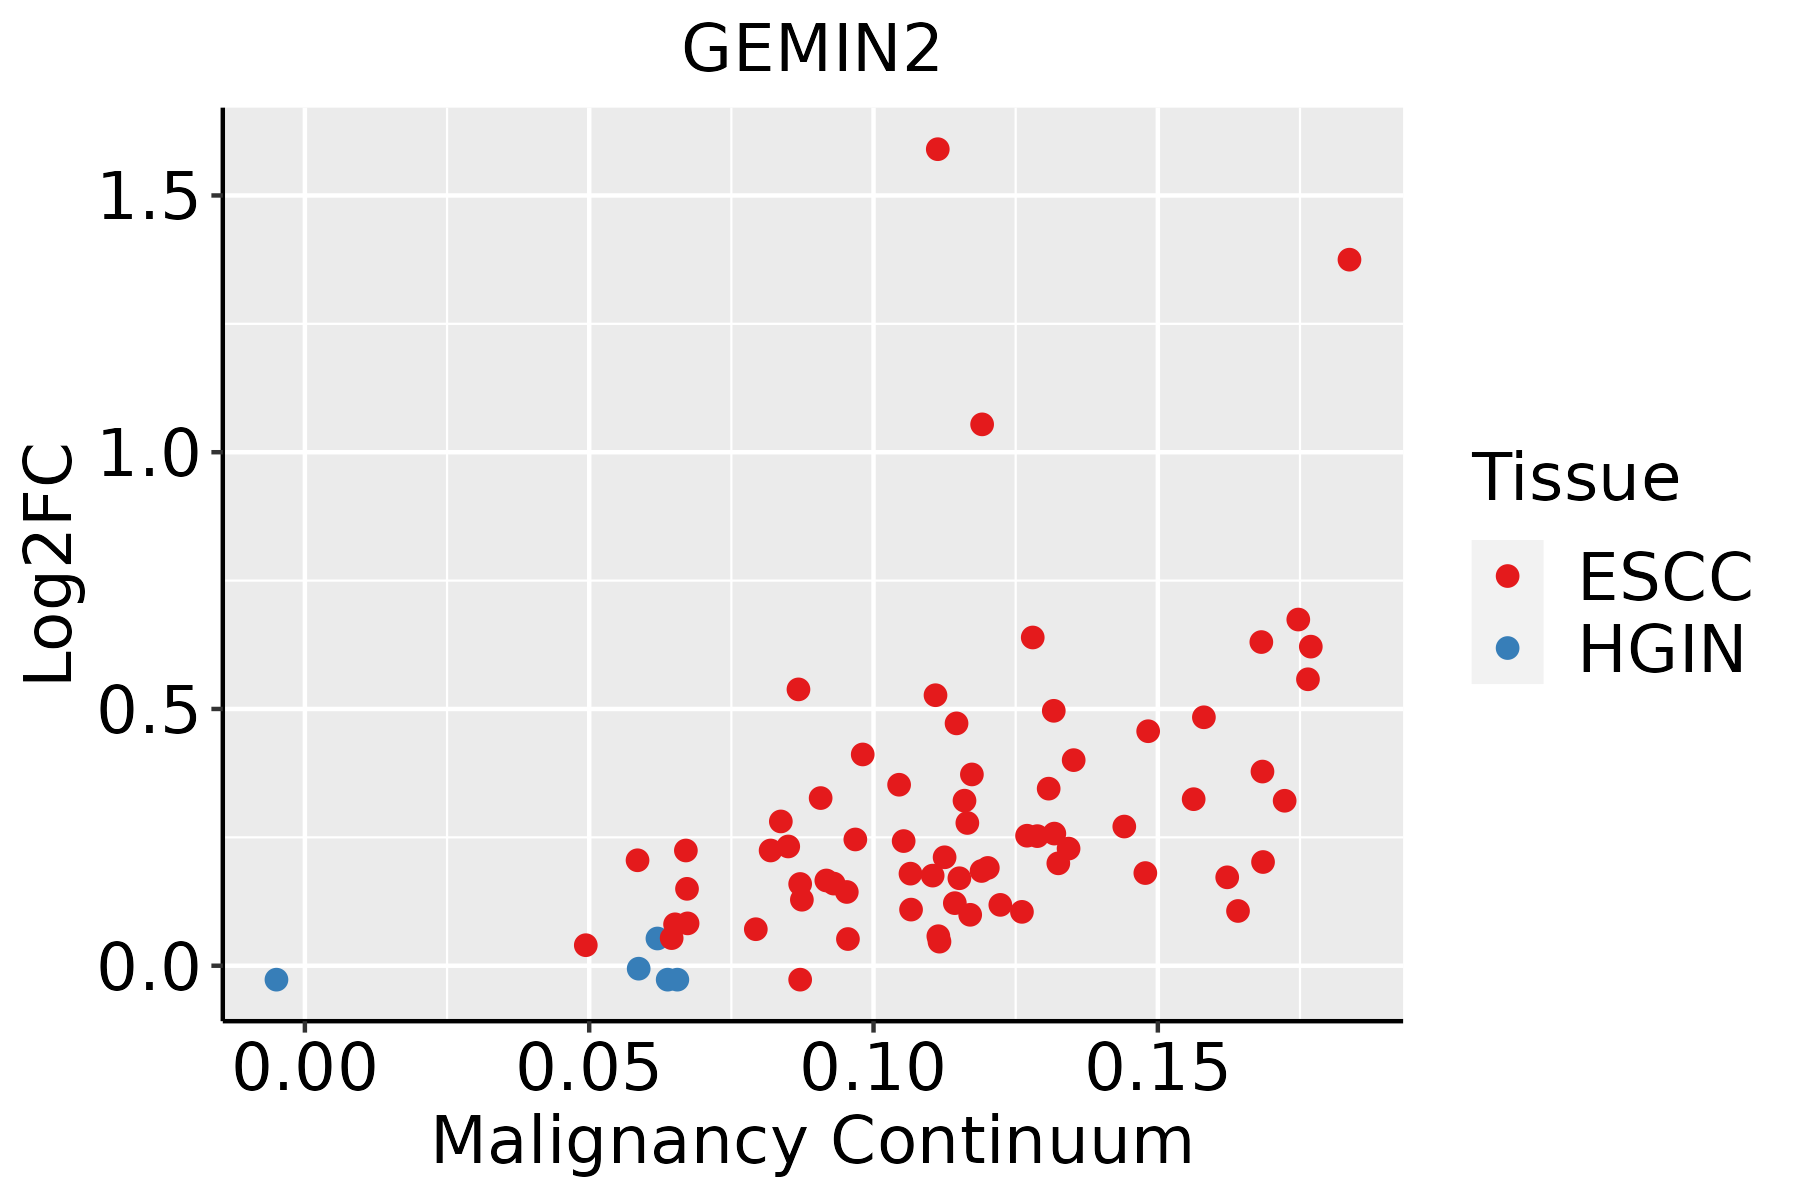 | ESCC: Esophageal squamous cell carcinoma |
| HGIN: High-grade intraepithelial neoplasias | ||
| LGIN: Low-grade intraepithelial neoplasias | ||
| Oral Cavity |  | EOLP: Erosive Oral lichen planus |
| LP: leukoplakia | ||
| NEOLP: Non-erosive oral lichen planus | ||
| OSCC: Oral squamous cell carcinoma | ||
| Skin |  | AK: Actinic keratosis |
| cSCC: Cutaneous squamous cell carcinoma | ||
| SCCIS:squamous cell carcinoma in situ |
| ∗log2FC in expression of this searched gene in stem-like cells from each diseased tissue sample relative to stem-like cells in normal samples in each tissue plotted against the malignancy continuum. Samples are colored based on if they are from different disease stage. |
Top |
Malignant transformation related pathway analysis |
| Find out the enriched GO biological processes and KEGG pathways involved in transition from healthy to precancer to cancer |
| Tissue | Disease Stage | Enriched GO biological Processes |
| Colorectum | AD |  |
| Colorectum | SER |  |
| Colorectum | MSS |  |
| Colorectum | MSI-H |  |
| Colorectum | FAP |  |
| ∗Top 15 enriched GO BP terms are showed in the bar plot of each disease state in each tissue. Each row represents a significant GO biological process which is colored according to the -log10(p.adjust). |
| Page: 1 2 3 4 5 6 7 8 9 |
| GO ID | Tissue | Disease Stage | Description | Gene Ratio | Bg Ratio | pvalue | p.adjust | Count |
| GO:0022613111 | Esophagus | ESCC | ribonucleoprotein complex biogenesis | 365/8552 | 463/18723 | 1.74e-49 | 1.11e-45 | 365 |
| GO:0008380111 | Esophagus | ESCC | RNA splicing | 336/8552 | 434/18723 | 1.74e-42 | 3.67e-39 | 336 |
| GO:0000375111 | Esophagus | ESCC | RNA splicing, via transesterification reactions | 248/8552 | 324/18723 | 3.05e-30 | 1.49e-27 | 248 |
| GO:0000377111 | Esophagus | ESCC | RNA splicing, via transesterification reactions with bulged adenosine as nucleophile | 244/8552 | 320/18723 | 2.52e-29 | 1.07e-26 | 244 |
| GO:0000398111 | Esophagus | ESCC | mRNA splicing, via spliceosome | 244/8552 | 320/18723 | 2.52e-29 | 1.07e-26 | 244 |
| GO:0051098111 | Esophagus | ESCC | regulation of binding | 251/8552 | 363/18723 | 6.73e-20 | 8.46e-18 | 251 |
| GO:0071826111 | Esophagus | ESCC | ribonucleoprotein complex subunit organization | 166/8552 | 227/18723 | 2.94e-17 | 2.42e-15 | 166 |
| GO:0022618111 | Esophagus | ESCC | ribonucleoprotein complex assembly | 159/8552 | 220/18723 | 8.19e-16 | 5.71e-14 | 159 |
| GO:0051100111 | Esophagus | ESCC | negative regulation of binding | 109/8552 | 162/18723 | 2.10e-08 | 4.03e-07 | 109 |
| GO:19052142 | Esophagus | ESCC | regulation of RNA binding | 12/8552 | 12/18723 | 8.21e-05 | 6.01e-04 | 12 |
| GO:000024514 | Esophagus | ESCC | spliceosomal complex assembly | 48/8552 | 79/18723 | 4.93e-03 | 1.89e-02 | 48 |
| GO:00003875 | Esophagus | ESCC | spliceosomal snRNP assembly | 32/8552 | 50/18723 | 6.90e-03 | 2.52e-02 | 32 |
| GO:002261320 | Oral cavity | OSCC | ribonucleoprotein complex biogenesis | 333/7305 | 463/18723 | 8.28e-48 | 5.24e-44 | 333 |
| GO:000838020 | Oral cavity | OSCC | RNA splicing | 308/7305 | 434/18723 | 2.43e-42 | 7.70e-39 | 308 |
| GO:000037519 | Oral cavity | OSCC | RNA splicing, via transesterification reactions | 225/7305 | 324/18723 | 5.20e-29 | 2.99e-26 | 225 |
| GO:000037719 | Oral cavity | OSCC | RNA splicing, via transesterification reactions with bulged adenosine as nucleophile | 221/7305 | 320/18723 | 5.50e-28 | 2.18e-25 | 221 |
| GO:000039819 | Oral cavity | OSCC | mRNA splicing, via spliceosome | 221/7305 | 320/18723 | 5.50e-28 | 2.18e-25 | 221 |
| GO:007182620 | Oral cavity | OSCC | ribonucleoprotein complex subunit organization | 152/7305 | 227/18723 | 1.05e-17 | 1.01e-15 | 152 |
| GO:002261820 | Oral cavity | OSCC | ribonucleoprotein complex assembly | 146/7305 | 220/18723 | 1.53e-16 | 1.23e-14 | 146 |
| GO:005109820 | Oral cavity | OSCC | regulation of binding | 212/7305 | 363/18723 | 3.88e-14 | 2.15e-12 | 212 |
| Page: 1 2 |
| Pathway ID | Tissue | Disease Stage | Description | Gene Ratio | Bg Ratio | pvalue | p.adjust | qvalue | Count |
| Page: 1 |
Top |
Cell-cell communication analysis |
| Identification of potential cell-cell interactions between two cell types and their ligand-receptor pairs for different disease states |
| Ligand | Receptor | LRpair | Pathway | Tissue | Disease Stage |
| Page: 1 |
Top |
Single-cell gene regulatory network inference analysis |
| Find out the significant the regulons (TFs) and the target genes of each regulon across cell types for different disease states |
| TF | Cell Type | Tissue | Disease Stage | Target Gene | RSS | Regulon Activity |
| ∗The dot plots of a searched regulon are shown for all cell subpopulations in each disease state of each tissue based on the regulon specific score inferred using pySCENIC and by calculating the average expression. |
| Page: 1 |
Top |
Somatic mutation of malignant transformation related genes |
| Annotation of somatic variants for genes involved in malignant transformation |
| Hugo Symbol | Variant Class | Variant Classification | dbSNP RS | HGVSc | HGVSp | HGVSp Short | SWISSPROT | BIOTYPE | SIFT | PolyPhen | Tumor Sample Barcode | Tissue | Histology | Sex | Age | Stage | Therapy Types | Drugs | Outcome |
| GEMIN2 | SNV | Missense_Mutation | rs771609900 | c.635N>A | p.Gly212Glu | p.G212E | O14893 | protein_coding | deleterious(0.04) | probably_damaging(0.94) | TCGA-A8-A09C-01 | Breast | breast invasive carcinoma | Female | >=65 | I/II | Unknown | Unknown | SD |
| GEMIN2 | SNV | Missense_Mutation | novel | c.175N>C | p.Glu59Gln | p.E59Q | O14893 | protein_coding | deleterious(0) | possibly_damaging(0.874) | TCGA-AQ-A7U7-01 | Breast | breast invasive carcinoma | Female | <65 | III/IV | Targeted Molecular therapy | rituximab | CR |
| GEMIN2 | SNV | Missense_Mutation | c.191C>T | p.Pro64Leu | p.P64L | O14893 | protein_coding | deleterious(0) | probably_damaging(0.999) | TCGA-E9-A229-01 | Breast | breast invasive carcinoma | Female | <65 | I/II | Chemotherapy | 5-fluorouracil | SD | |
| GEMIN2 | SNV | Missense_Mutation | rs752769842 | c.674N>T | p.Pro225Leu | p.P225L | O14893 | protein_coding | deleterious(0) | probably_damaging(0.998) | TCGA-2W-A8YY-01 | Cervix | cervical & endocervical cancer | Female | <65 | I/II | Chemotherapy | cisplatin | CR |
| GEMIN2 | SNV | Missense_Mutation | novel | c.653N>C | p.Leu218Ser | p.L218S | O14893 | protein_coding | deleterious(0) | probably_damaging(1) | TCGA-CM-6674-01 | Colorectum | colon adenocarcinoma | Male | <65 | I/II | Unknown | Unknown | SD |
| GEMIN2 | SNV | Missense_Mutation | novel | c.341G>A | p.Arg114Gln | p.R114Q | O14893 | protein_coding | deleterious(0.02) | probably_damaging(0.997) | TCGA-A5-A0G2-01 | Endometrium | uterine corpus endometrioid carcinoma | Female | <65 | III/IV | Unknown | Unknown | SD |
| GEMIN2 | SNV | Missense_Mutation | rs775884653 | c.479N>A | p.Gly160Glu | p.G160E | O14893 | protein_coding | tolerated(0.77) | benign(0.003) | TCGA-AJ-A3EK-01 | Endometrium | uterine corpus endometrioid carcinoma | Female | <65 | I/II | Chemotherapy | carboplatin | CR |
| GEMIN2 | SNV | Missense_Mutation | novel | c.803N>T | p.Arg268Met | p.R268M | O14893 | protein_coding | deleterious(0) | probably_damaging(0.997) | TCGA-AJ-A3EK-01 | Endometrium | uterine corpus endometrioid carcinoma | Female | <65 | I/II | Chemotherapy | carboplatin | CR |
| GEMIN2 | SNV | Missense_Mutation | c.689C>T | p.Ala230Val | p.A230V | O14893 | protein_coding | tolerated(0.3) | benign(0.309) | TCGA-AP-A051-01 | Endometrium | uterine corpus endometrioid carcinoma | Female | >=65 | I/II | Unknown | Unknown | SD | |
| GEMIN2 | SNV | Missense_Mutation | c.233G>T | p.Arg78Met | p.R78M | O14893 | protein_coding | deleterious(0.01) | possibly_damaging(0.814) | TCGA-AX-A0J1-01 | Endometrium | uterine corpus endometrioid carcinoma | Female | >=65 | I/II | Unknown | Unknown | SD |
| Page: 1 2 |
Top |
Related drugs of malignant transformation related genes |
| Identification of chemicals and drugs interact with genes involved in malignant transfromation |
| (DGIdb 4.0) |
| Entrez ID | Symbol | Category | Interaction Types | Drug Claim Name | Drug Name | PMIDs |
| Page: 1 |

Copyright 2023-Present -The University of Texas Health Science Center at Houston |