
|
|||||
|
 | |
| |
| |
| |
| |
| |
|
Gene: GEM |
Gene summary for GEM |
| Gene information | Species | Human | Gene symbol | GEM | Gene ID | 2669 |
| Gene name | GTP binding protein overexpressed in skeletal muscle | |
| Gene Alias | KIR | |
| Cytomap | 8q22.1 | |
| Gene Type | protein-coding | GO ID | GO:0000278 | UniProtAcc | A0A024R9F5 |
Top |
Malignant transformation analysis |
| Identification of the aberrant gene expression in precancerous and cancerous lesions by comparing the gene expression of stem-like cells in diseased tissues with normal stem cells |
| Entrez ID | Symbol | Replicates | Species | Organ | Tissue | Adj P-value | Log2FC | Malignancy |
| 2669 | GEM | AEH-subject1 | Human | Endometrium | AEH | 1.00e-09 | 4.13e-01 | -0.3059 |
| 2669 | GEM | GSM5276934 | Human | Endometrium | EEC | 6.16e-20 | 6.16e-01 | -0.0913 |
| 2669 | GEM | GSM5276937 | Human | Endometrium | EEC | 7.05e-37 | 9.26e-01 | -0.0897 |
| 2669 | GEM | GSM6177622_NYU_UCEC3_lib1_lib1 | Human | Endometrium | EEC | 3.51e-03 | -9.46e-02 | -0.1917 |
| 2669 | GEM | GSM6177622_NYU_UCEC3_lib2_lib2 | Human | Endometrium | EEC | 2.02e-02 | -7.77e-02 | -0.1916 |
| 2669 | GEM | LZE2T | Human | Esophagus | ESCC | 1.37e-07 | 1.24e-01 | 0.082 |
| 2669 | GEM | LZE3D | Human | Esophagus | HGIN | 5.26e-03 | 7.66e-01 | 0.0668 |
| 2669 | GEM | LZE7T | Human | Esophagus | ESCC | 2.66e-03 | -5.52e-01 | 0.0667 |
| 2669 | GEM | LZE8T | Human | Esophagus | ESCC | 3.35e-04 | 5.37e-01 | 0.067 |
| 2669 | GEM | LZE22D1 | Human | Esophagus | HGIN | 4.92e-03 | -5.50e-01 | 0.0595 |
| 2669 | GEM | LZE22D3 | Human | Esophagus | HGIN | 1.01e-02 | 7.89e-01 | 0.0653 |
| 2669 | GEM | P2T-E | Human | Esophagus | ESCC | 3.27e-58 | 2.35e+00 | 0.1177 |
| 2669 | GEM | P5T-E | Human | Esophagus | ESCC | 2.86e-05 | 7.81e-01 | 0.1327 |
| 2669 | GEM | P11T-E | Human | Esophagus | ESCC | 2.34e-17 | 2.04e+00 | 0.1426 |
| 2669 | GEM | P12T-E | Human | Esophagus | ESCC | 7.02e-05 | 4.47e-01 | 0.1122 |
| 2669 | GEM | P16T-E | Human | Esophagus | ESCC | 3.00e-68 | 2.26e+00 | 0.1153 |
| 2669 | GEM | P21T-E | Human | Esophagus | ESCC | 1.34e-26 | 1.78e+00 | 0.1617 |
| 2669 | GEM | P22T-E | Human | Esophagus | ESCC | 5.56e-18 | 1.18e+00 | 0.1236 |
| 2669 | GEM | P23T-E | Human | Esophagus | ESCC | 7.29e-06 | 1.74e+00 | 0.108 |
| 2669 | GEM | P26T-E | Human | Esophagus | ESCC | 2.24e-07 | 5.71e-01 | 0.1276 |
| Page: 1 2 3 4 5 |
| Tissue | Expression Dynamics | Abbreviation |
| Endometrium |  | AEH: Atypical endometrial hyperplasia |
| EEC: Endometrioid Cancer | ||
| Esophagus |  | ESCC: Esophageal squamous cell carcinoma |
| HGIN: High-grade intraepithelial neoplasias | ||
| LGIN: Low-grade intraepithelial neoplasias | ||
| Lung | 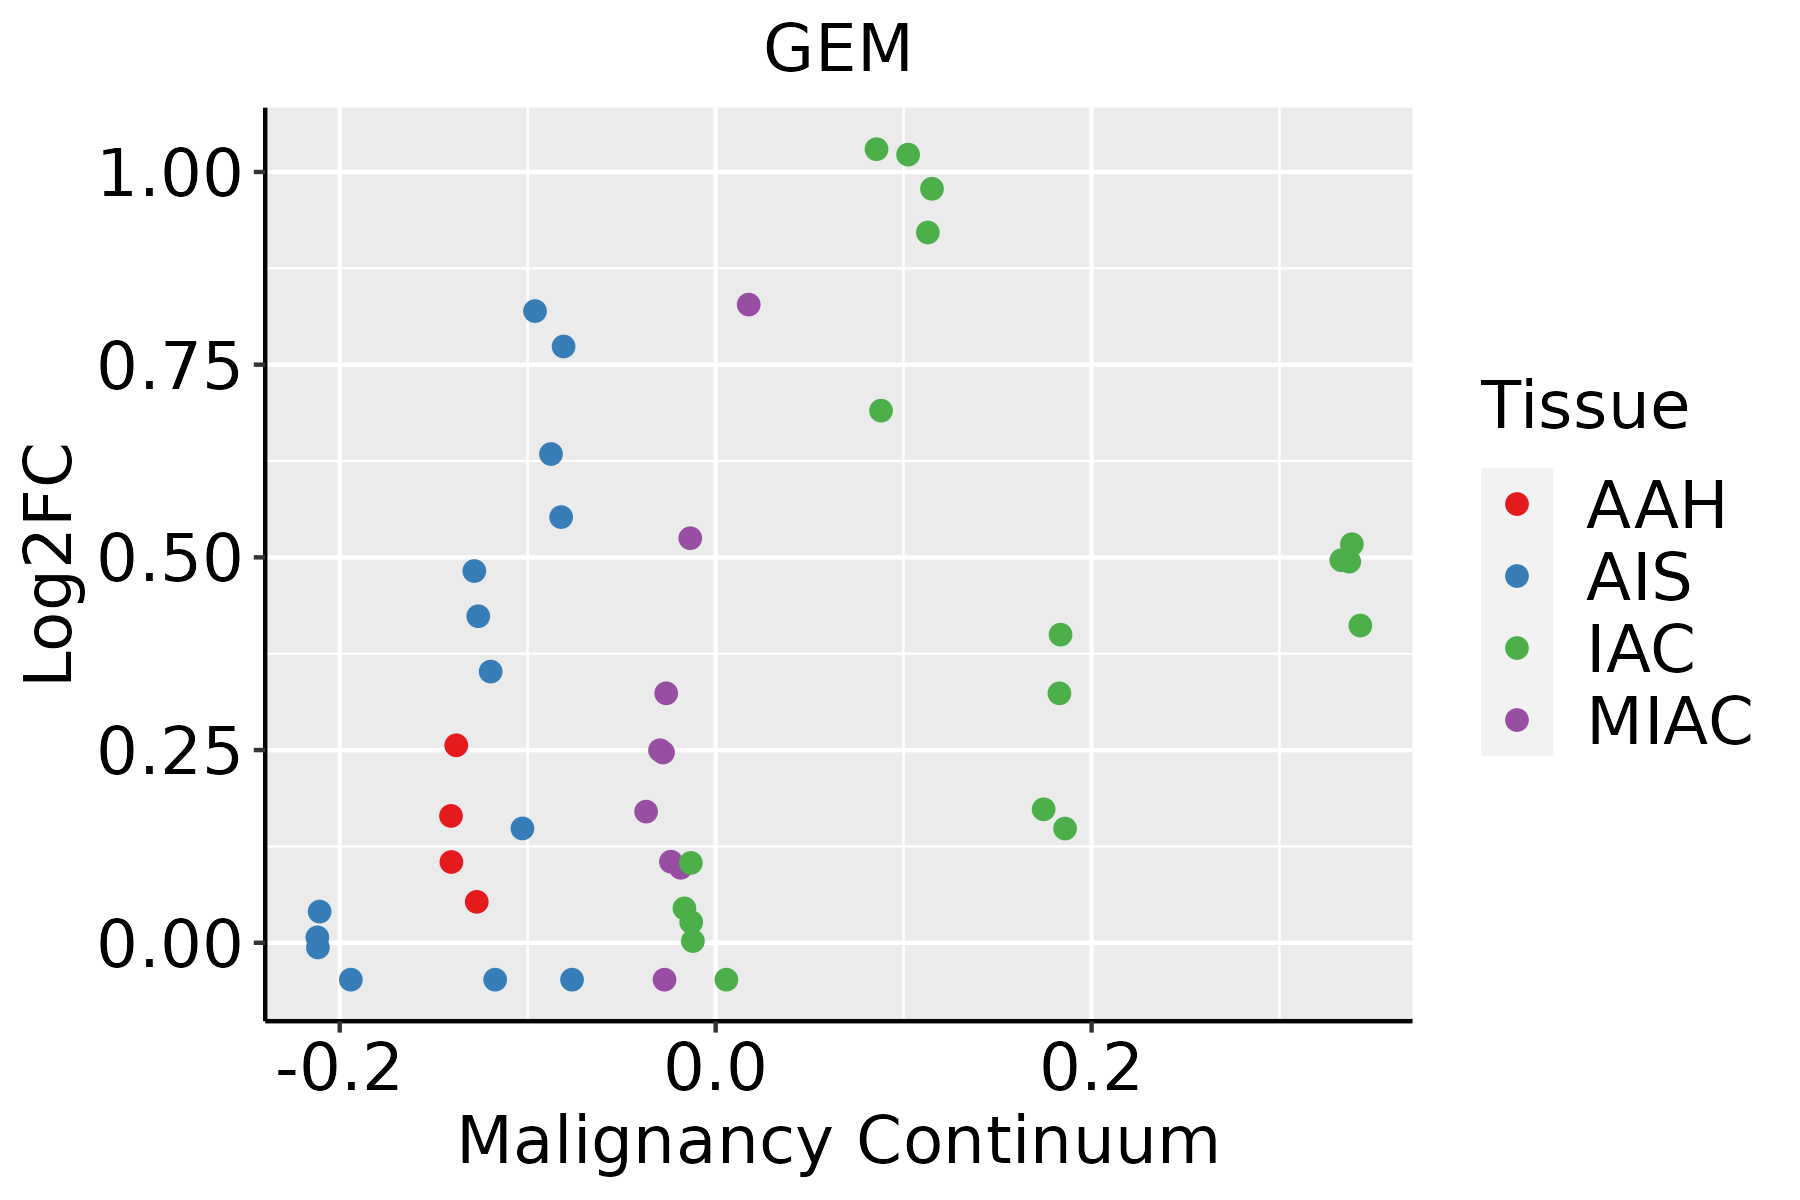 | AAH: Atypical adenomatous hyperplasia |
| AIS: Adenocarcinoma in situ | ||
| IAC: Invasive lung adenocarcinoma | ||
| MIA: Minimally invasive adenocarcinoma | ||
| Oral Cavity |  | EOLP: Erosive Oral lichen planus |
| LP: leukoplakia | ||
| NEOLP: Non-erosive oral lichen planus | ||
| OSCC: Oral squamous cell carcinoma | ||
| Prostate | 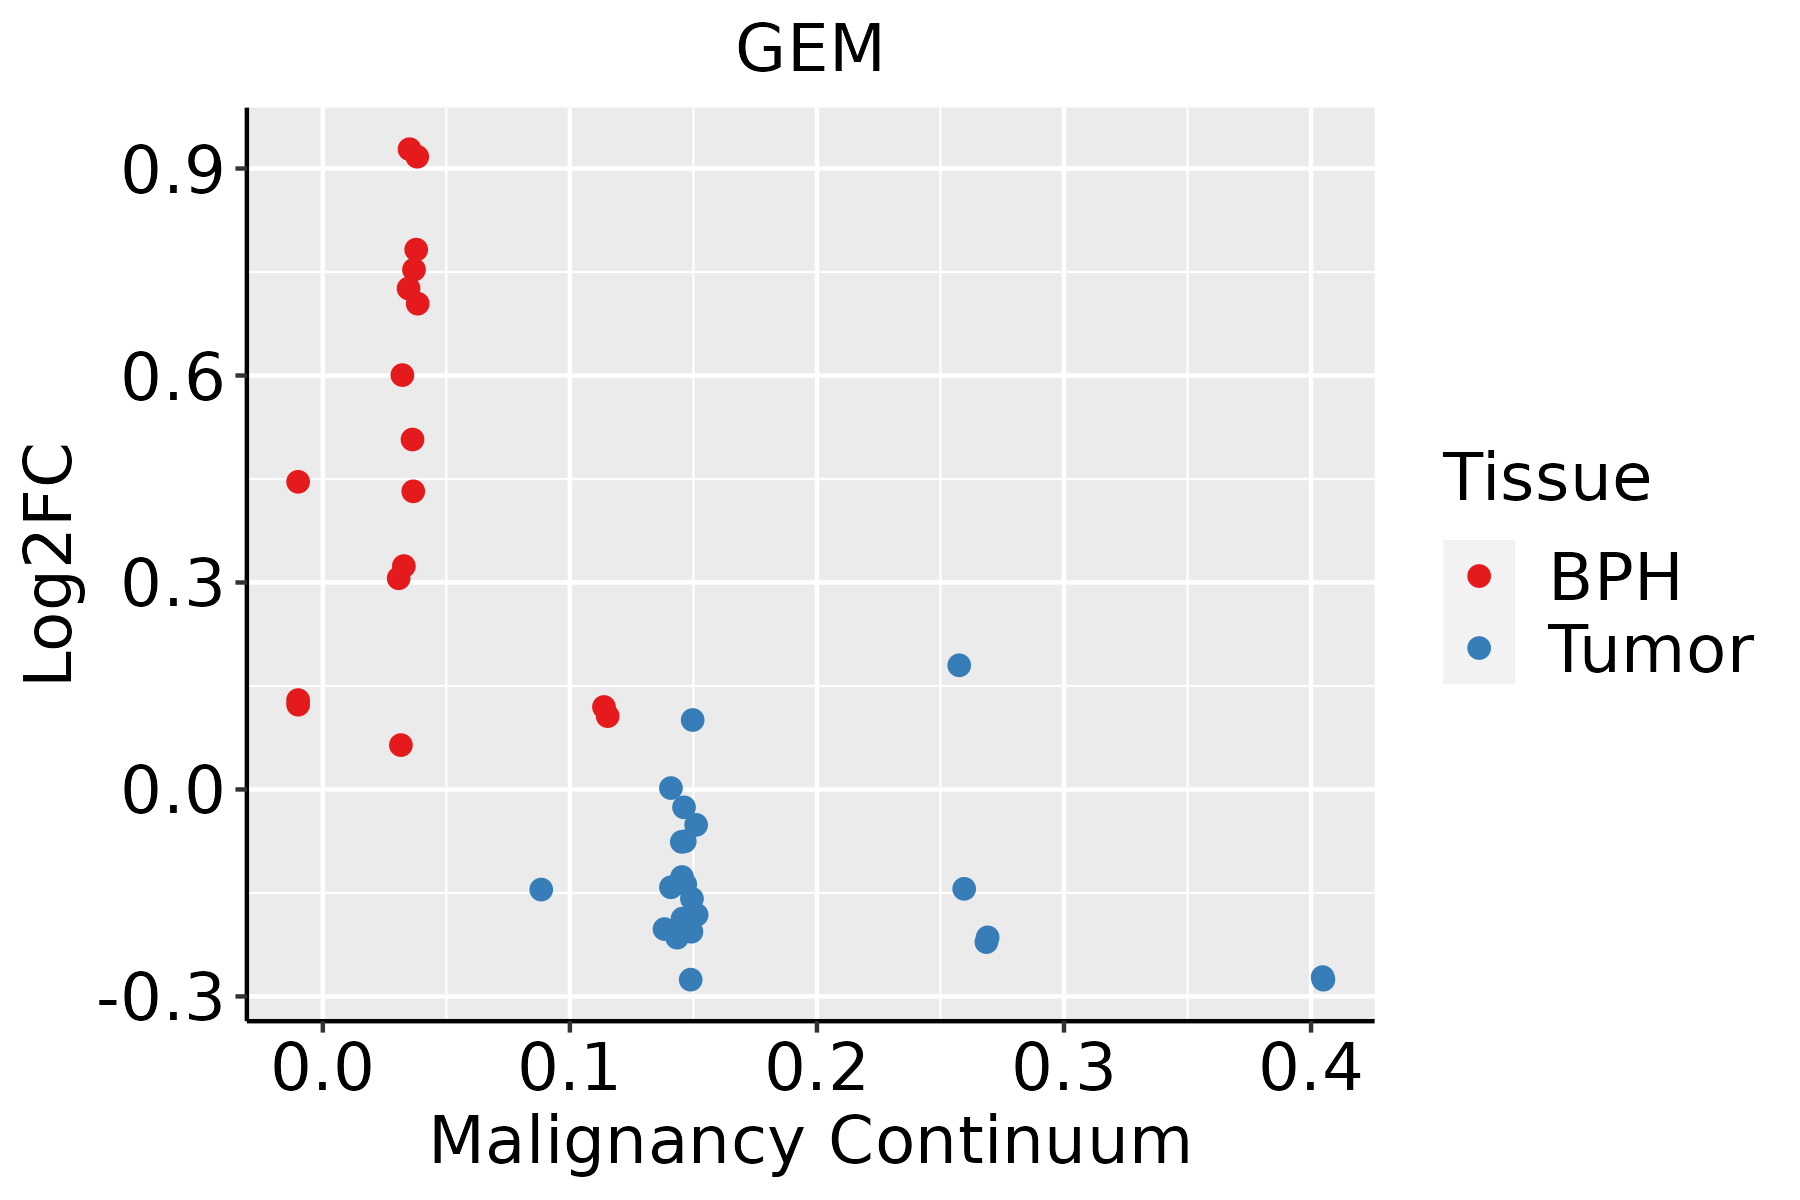 | BPH: Benign Prostatic Hyperplasia |
| Skin | 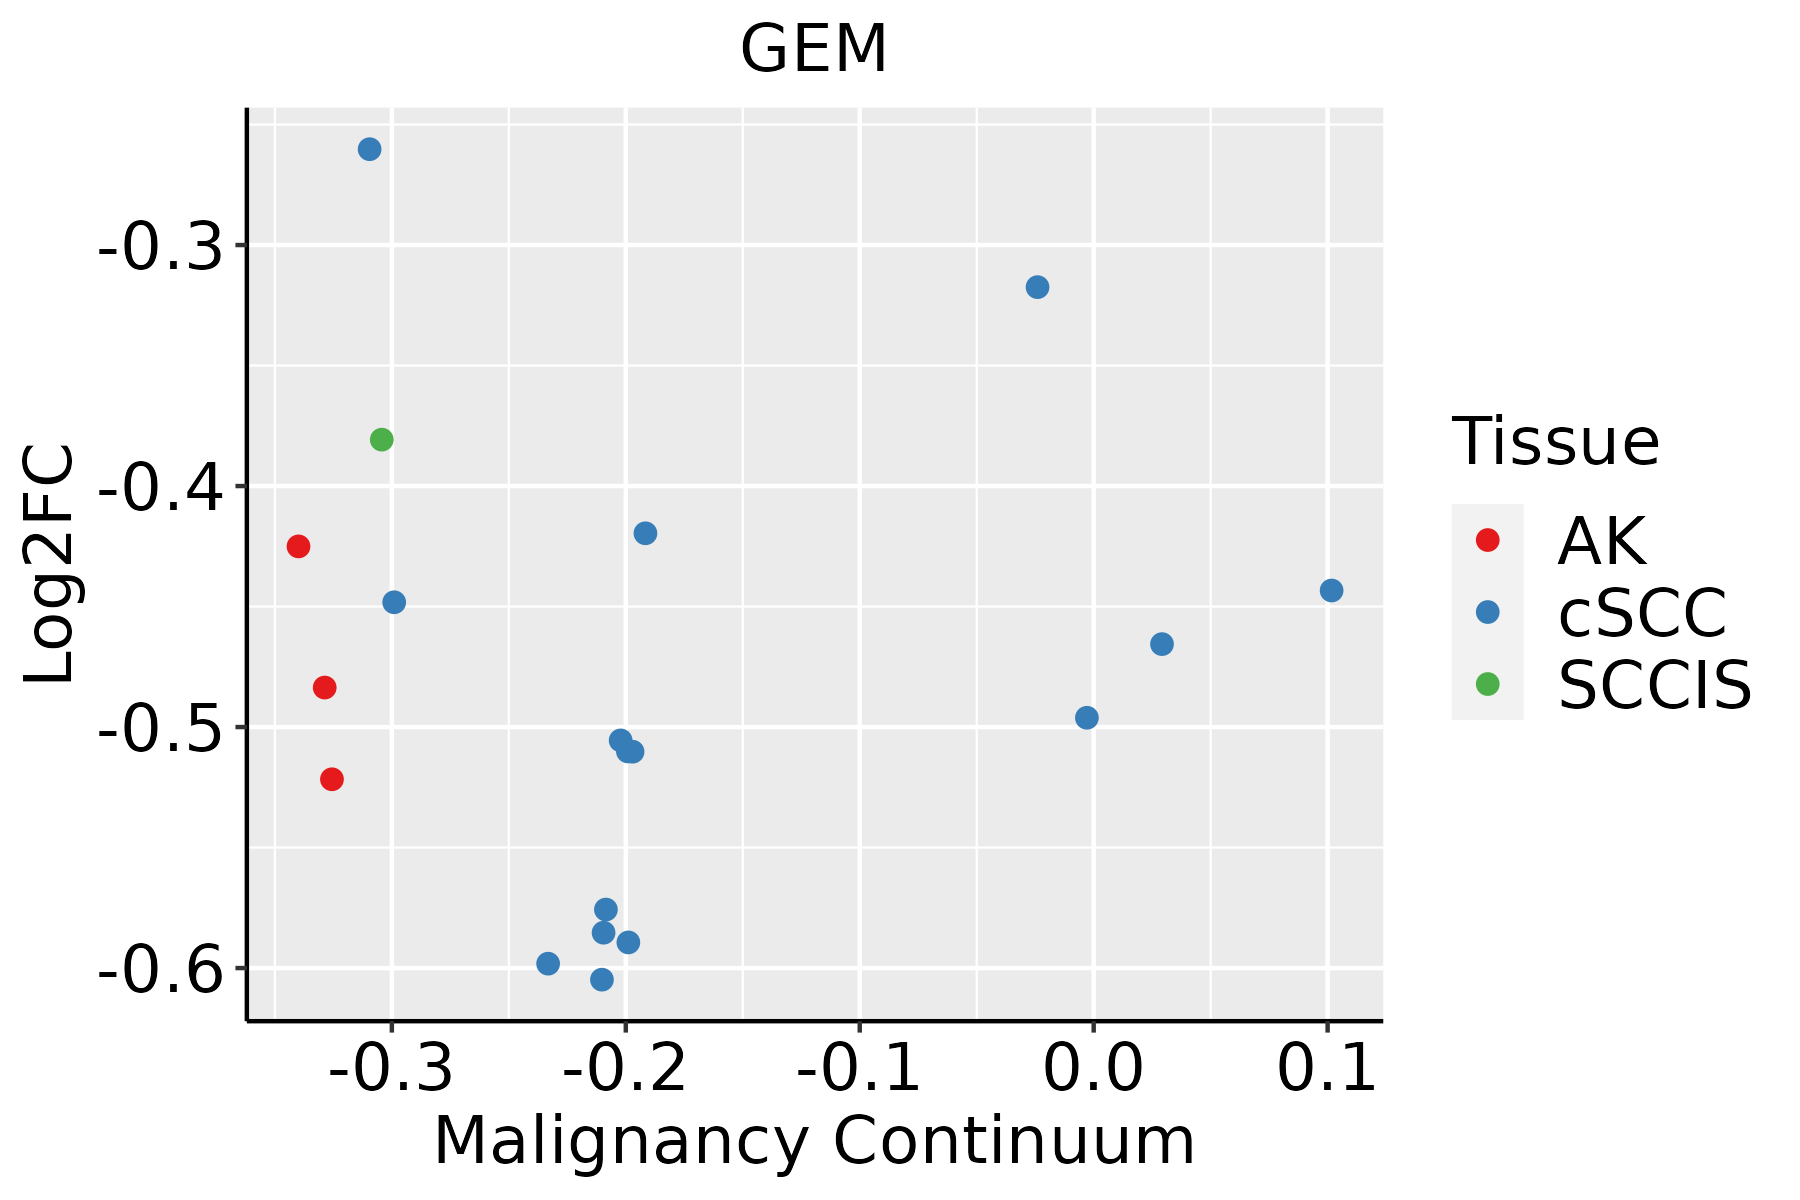 | AK: Actinic keratosis |
| cSCC: Cutaneous squamous cell carcinoma | ||
| SCCIS:squamous cell carcinoma in situ | ||
| Thyroid | 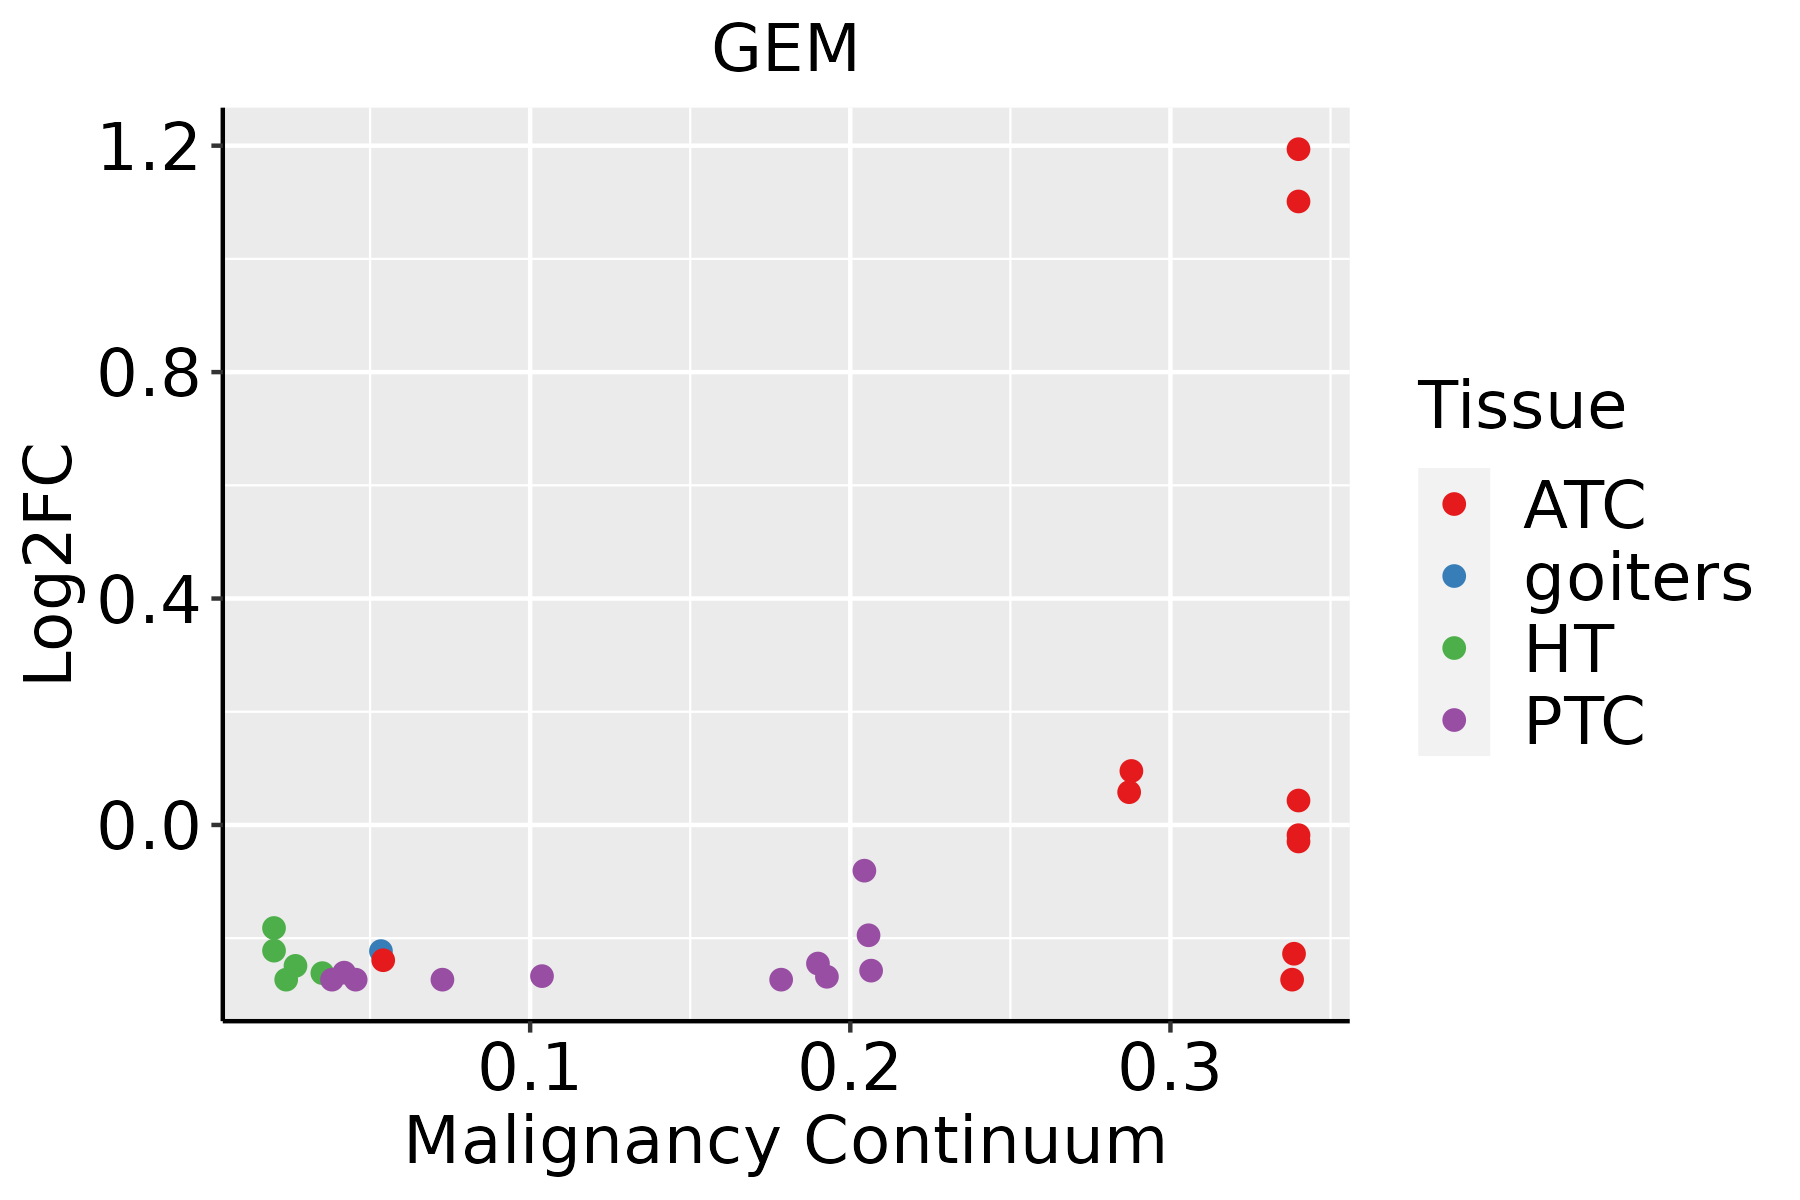 | ATC: Anaplastic thyroid cancer |
| HT: Hashimoto's thyroiditis | ||
| PTC: Papillary thyroid cancer |
| ∗log2FC in expression of this searched gene in stem-like cells from each diseased tissue sample relative to stem-like cells in normal samples in each tissue plotted against the malignancy continuum. Samples are colored based on if they are from different disease stage. |
Top |
Malignant transformation related pathway analysis |
| Find out the enriched GO biological processes and KEGG pathways involved in transition from healthy to precancer to cancer |
| Tissue | Disease Stage | Enriched GO biological Processes |
| Colorectum | AD |  |
| Colorectum | SER |  |
| Colorectum | MSS |  |
| Colorectum | MSI-H |  |
| Colorectum | FAP |  |
| ∗Top 15 enriched GO BP terms are showed in the bar plot of each disease state in each tissue. Each row represents a significant GO biological process which is colored according to the -log10(p.adjust). |
| Page: 1 2 3 4 5 6 7 8 9 |
| GO ID | Tissue | Disease Stage | Description | Gene Ratio | Bg Ratio | pvalue | p.adjust | Count |
| GO:00516568 | Endometrium | AEH | establishment of organelle localization | 77/2100 | 390/18723 | 4.89e-07 | 1.94e-05 | 77 |
| GO:00510515 | Endometrium | AEH | negative regulation of transport | 79/2100 | 470/18723 | 1.51e-04 | 1.99e-03 | 79 |
| GO:00109597 | Endometrium | AEH | regulation of metal ion transport | 66/2100 | 406/18723 | 1.24e-03 | 1.07e-02 | 66 |
| GO:0034766 | Endometrium | AEH | negative regulation of ion transmembrane transport | 22/2100 | 109/18723 | 4.39e-03 | 2.89e-02 | 22 |
| GO:0043271 | Endometrium | AEH | negative regulation of ion transport | 29/2100 | 160/18723 | 6.16e-03 | 3.70e-02 | 29 |
| GO:00228986 | Endometrium | AEH | regulation of transmembrane transporter activity | 45/2100 | 278/18723 | 7.34e-03 | 4.18e-02 | 45 |
| GO:0034763 | Endometrium | AEH | negative regulation of transmembrane transport | 26/2100 | 143/18723 | 8.78e-03 | 4.78e-02 | 26 |
| GO:1904063 | Endometrium | AEH | negative regulation of cation transmembrane transport | 20/2100 | 102/18723 | 8.88e-03 | 4.82e-02 | 20 |
| GO:19040623 | Endometrium | AEH | regulation of cation transmembrane transport | 55/2100 | 357/18723 | 9.18e-03 | 4.96e-02 | 55 |
| GO:005165613 | Endometrium | EEC | establishment of organelle localization | 75/2168 | 390/18723 | 6.23e-06 | 1.49e-04 | 75 |
| GO:005105111 | Endometrium | EEC | negative regulation of transport | 80/2168 | 470/18723 | 2.53e-04 | 2.93e-03 | 80 |
| GO:001095914 | Endometrium | EEC | regulation of metal ion transport | 70/2168 | 406/18723 | 4.12e-04 | 4.35e-03 | 70 |
| GO:00347661 | Endometrium | EEC | negative regulation of ion transmembrane transport | 22/2168 | 109/18723 | 6.39e-03 | 3.76e-02 | 22 |
| GO:005165616 | Esophagus | HGIN | establishment of organelle localization | 90/2587 | 390/18723 | 4.27e-07 | 1.94e-05 | 90 |
| GO:00500003 | Esophagus | HGIN | chromosome localization | 24/2587 | 82/18723 | 2.07e-04 | 3.82e-03 | 24 |
| GO:00070593 | Esophagus | HGIN | chromosome segregation | 71/2587 | 346/18723 | 3.47e-04 | 5.62e-03 | 71 |
| GO:00513033 | Esophagus | HGIN | establishment of chromosome localization | 23/2587 | 80/18723 | 3.71e-04 | 5.77e-03 | 23 |
| GO:00513103 | Esophagus | HGIN | metaphase plate congression | 18/2587 | 65/18723 | 2.46e-03 | 2.45e-02 | 18 |
| GO:0022613111 | Esophagus | ESCC | ribonucleoprotein complex biogenesis | 365/8552 | 463/18723 | 1.74e-49 | 1.11e-45 | 365 |
| GO:0042254111 | Esophagus | ESCC | ribosome biogenesis | 252/8552 | 299/18723 | 3.27e-44 | 1.04e-40 | 252 |
| Page: 1 2 3 4 5 6 7 |
| Pathway ID | Tissue | Disease Stage | Description | Gene Ratio | Bg Ratio | pvalue | p.adjust | qvalue | Count |
| Page: 1 |
Top |
Cell-cell communication analysis |
| Identification of potential cell-cell interactions between two cell types and their ligand-receptor pairs for different disease states |
| Ligand | Receptor | LRpair | Pathway | Tissue | Disease Stage |
| Page: 1 |
Top |
Single-cell gene regulatory network inference analysis |
| Find out the significant the regulons (TFs) and the target genes of each regulon across cell types for different disease states |
| TF | Cell Type | Tissue | Disease Stage | Target Gene | RSS | Regulon Activity |
| ∗The dot plots of a searched regulon are shown for all cell subpopulations in each disease state of each tissue based on the regulon specific score inferred using pySCENIC and by calculating the average expression. |
| Page: 1 |
Top |
Somatic mutation of malignant transformation related genes |
| Annotation of somatic variants for genes involved in malignant transformation |
| Hugo Symbol | Variant Class | Variant Classification | dbSNP RS | HGVSc | HGVSp | HGVSp Short | SWISSPROT | BIOTYPE | SIFT | PolyPhen | Tumor Sample Barcode | Tissue | Histology | Sex | Age | Stage | Therapy Types | Drugs | Outcome |
| GEM | SNV | Missense_Mutation | rs774736541 | c.373N>A | p.Ala125Thr | p.A125T | P55040 | protein_coding | tolerated(0.8) | benign(0.179) | TCGA-BH-A0HF-01 | Breast | breast invasive carcinoma | Female | >=65 | I/II | Hormone Therapy | arimidex | SD |
| GEM | insertion | In_Frame_Ins | novel | c.332-37_342dupTCGCCTGACTCCAATATCTTTGTTCTTTCTTCTCTAGAAGATACATAT | p.Tyr114_Glu115insSerProAspSerAsnIlePheValLeuSerSerLeuGluAspThrTyr | p.Y114_E115insSPDSNIFVLSSLEDTY | P55040 | protein_coding | TCGA-AR-A24H-01 | Breast | breast invasive carcinoma | Female | >=65 | I/II | Hormone Therapy | tamoxiphen | SD | ||
| GEM | SNV | Missense_Mutation | c.271N>G | p.Leu91Val | p.L91V | P55040 | protein_coding | deleterious(0.01) | benign(0.297) | TCGA-IR-A3LK-01 | Cervix | cervical & endocervical cancer | Female | >=65 | I/II | Chemotherapy | cisplatin | PD | |
| GEM | SNV | Missense_Mutation | rs749374110 | c.724N>T | p.Arg242Trp | p.R242W | P55040 | protein_coding | deleterious(0) | probably_damaging(1) | TCGA-ZJ-AAXU-01 | Cervix | cervical & endocervical cancer | Female | <65 | I/II | Unknown | Unknown | SD |
| GEM | SNV | Missense_Mutation | rs780498125 | c.167N>A | p.Arg56Gln | p.R56Q | P55040 | protein_coding | tolerated(0.61) | benign(0.007) | TCGA-AA-3930-01 | Colorectum | colon adenocarcinoma | Male | >=65 | III/IV | Chemotherapy | capecitabine | PD |
| GEM | SNV | Missense_Mutation | rs187593880 | c.589N>T | p.Arg197Trp | p.R197W | P55040 | protein_coding | deleterious(0) | probably_damaging(1) | TCGA-AA-3949-01 | Colorectum | colon adenocarcinoma | Female | >=65 | III/IV | Unknown | Unknown | SD |
| GEM | SNV | Missense_Mutation | rs140549853 | c.61N>T | p.Arg21Cys | p.R21C | P55040 | protein_coding | deleterious(0) | possibly_damaging(0.759) | TCGA-AA-3977-01 | Colorectum | colon adenocarcinoma | Male | >=65 | I/II | Unknown | Unknown | SD |
| GEM | SNV | Missense_Mutation | novel | c.109C>A | p.Pro37Thr | p.P37T | P55040 | protein_coding | tolerated(0.13) | benign(0.039) | TCGA-AA-A010-01 | Colorectum | colon adenocarcinoma | Female | <65 | I/II | Chemotherapy | folinic | CR |
| GEM | SNV | Missense_Mutation | c.536G>A | p.Arg179Gln | p.R179Q | P55040 | protein_coding | deleterious(0) | probably_damaging(0.983) | TCGA-AD-6895-01 | Colorectum | colon adenocarcinoma | Male | >=65 | III/IV | Unknown | Unknown | SD | |
| GEM | SNV | Missense_Mutation | c.335N>T | p.Asp112Val | p.D112V | P55040 | protein_coding | tolerated(0.06) | benign(0.289) | TCGA-G4-6627-01 | Colorectum | colon adenocarcinoma | Male | >=65 | I/II | Unknown | Unknown | PD |
| Page: 1 2 3 4 5 |
Top |
Related drugs of malignant transformation related genes |
| Identification of chemicals and drugs interact with genes involved in malignant transfromation |
| (DGIdb 4.0) |
| Entrez ID | Symbol | Category | Interaction Types | Drug Claim Name | Drug Name | PMIDs |
| 2669 | GEM | NA | Lirilumab | LIRILUMAB |
| Page: 1 |

Copyright 2023-Present -The University of Texas Health Science Center at Houston |