
|
|||||
|
 | |
| |
| |
| |
| |
| |
|
Gene: GDPD3 |
Gene summary for GDPD3 |
| Gene information | Species | Human | Gene symbol | GDPD3 | Gene ID | 79153 |
| Gene name | glycerophosphodiester phosphodiesterase domain containing 3 | |
| Gene Alias | GDE7 | |
| Cytomap | 16p11.2 | |
| Gene Type | protein-coding | GO ID | GO:0006066 | UniProtAcc | Q7L5L3 |
Top |
Malignant transformation analysis |
| Identification of the aberrant gene expression in precancerous and cancerous lesions by comparing the gene expression of stem-like cells in diseased tissues with normal stem cells |
| Entrez ID | Symbol | Replicates | Species | Organ | Tissue | Adj P-value | Log2FC | Malignancy |
| 79153 | GDPD3 | HTA11_2487_2000001011 | Human | Colorectum | SER | 5.12e-09 | 5.17e-01 | -0.1808 |
| 79153 | GDPD3 | HTA11_411_2000001011 | Human | Colorectum | SER | 1.98e-03 | 8.71e-01 | -0.2602 |
| 79153 | GDPD3 | HTA11_83_2000001011 | Human | Colorectum | SER | 3.27e-03 | 4.08e-01 | -0.1526 |
| 79153 | GDPD3 | HTA11_696_2000001011 | Human | Colorectum | AD | 2.78e-03 | 2.37e-01 | -0.1464 |
| 79153 | GDPD3 | LZE22T | Human | Esophagus | ESCC | 1.57e-02 | 2.50e-01 | 0.068 |
| 79153 | GDPD3 | P39T-E | Human | Esophagus | ESCC | 3.03e-02 | 1.58e-01 | 0.0894 |
| 79153 | GDPD3 | P75T-E | Human | Esophagus | ESCC | 3.23e-13 | 4.08e-01 | 0.1125 |
| 79153 | GDPD3 | P82T-E | Human | Esophagus | ESCC | 5.97e-09 | 6.48e-01 | 0.1072 |
| 79153 | GDPD3 | P84T-E | Human | Esophagus | ESCC | 1.34e-04 | 1.10e+00 | 0.0933 |
| 79153 | GDPD3 | P94T-E | Human | Esophagus | ESCC | 2.53e-08 | 7.09e-01 | 0.0879 |
| 79153 | GDPD3 | P104T-E | Human | Esophagus | ESCC | 4.14e-03 | 2.24e-01 | 0.0931 |
| 79153 | GDPD3 | P130T-E | Human | Esophagus | ESCC | 2.76e-08 | 2.60e-01 | 0.1676 |
| Page: 1 |
| Tissue | Expression Dynamics | Abbreviation |
| Colorectum (GSE201348) |  | FAP: Familial adenomatous polyposis |
| CRC: Colorectal cancer | ||
| Colorectum (HTA11) |  | AD: Adenomas |
| SER: Sessile serrated lesions | ||
| MSI-H: Microsatellite-high colorectal cancer | ||
| MSS: Microsatellite stable colorectal cancer | ||
| Esophagus | 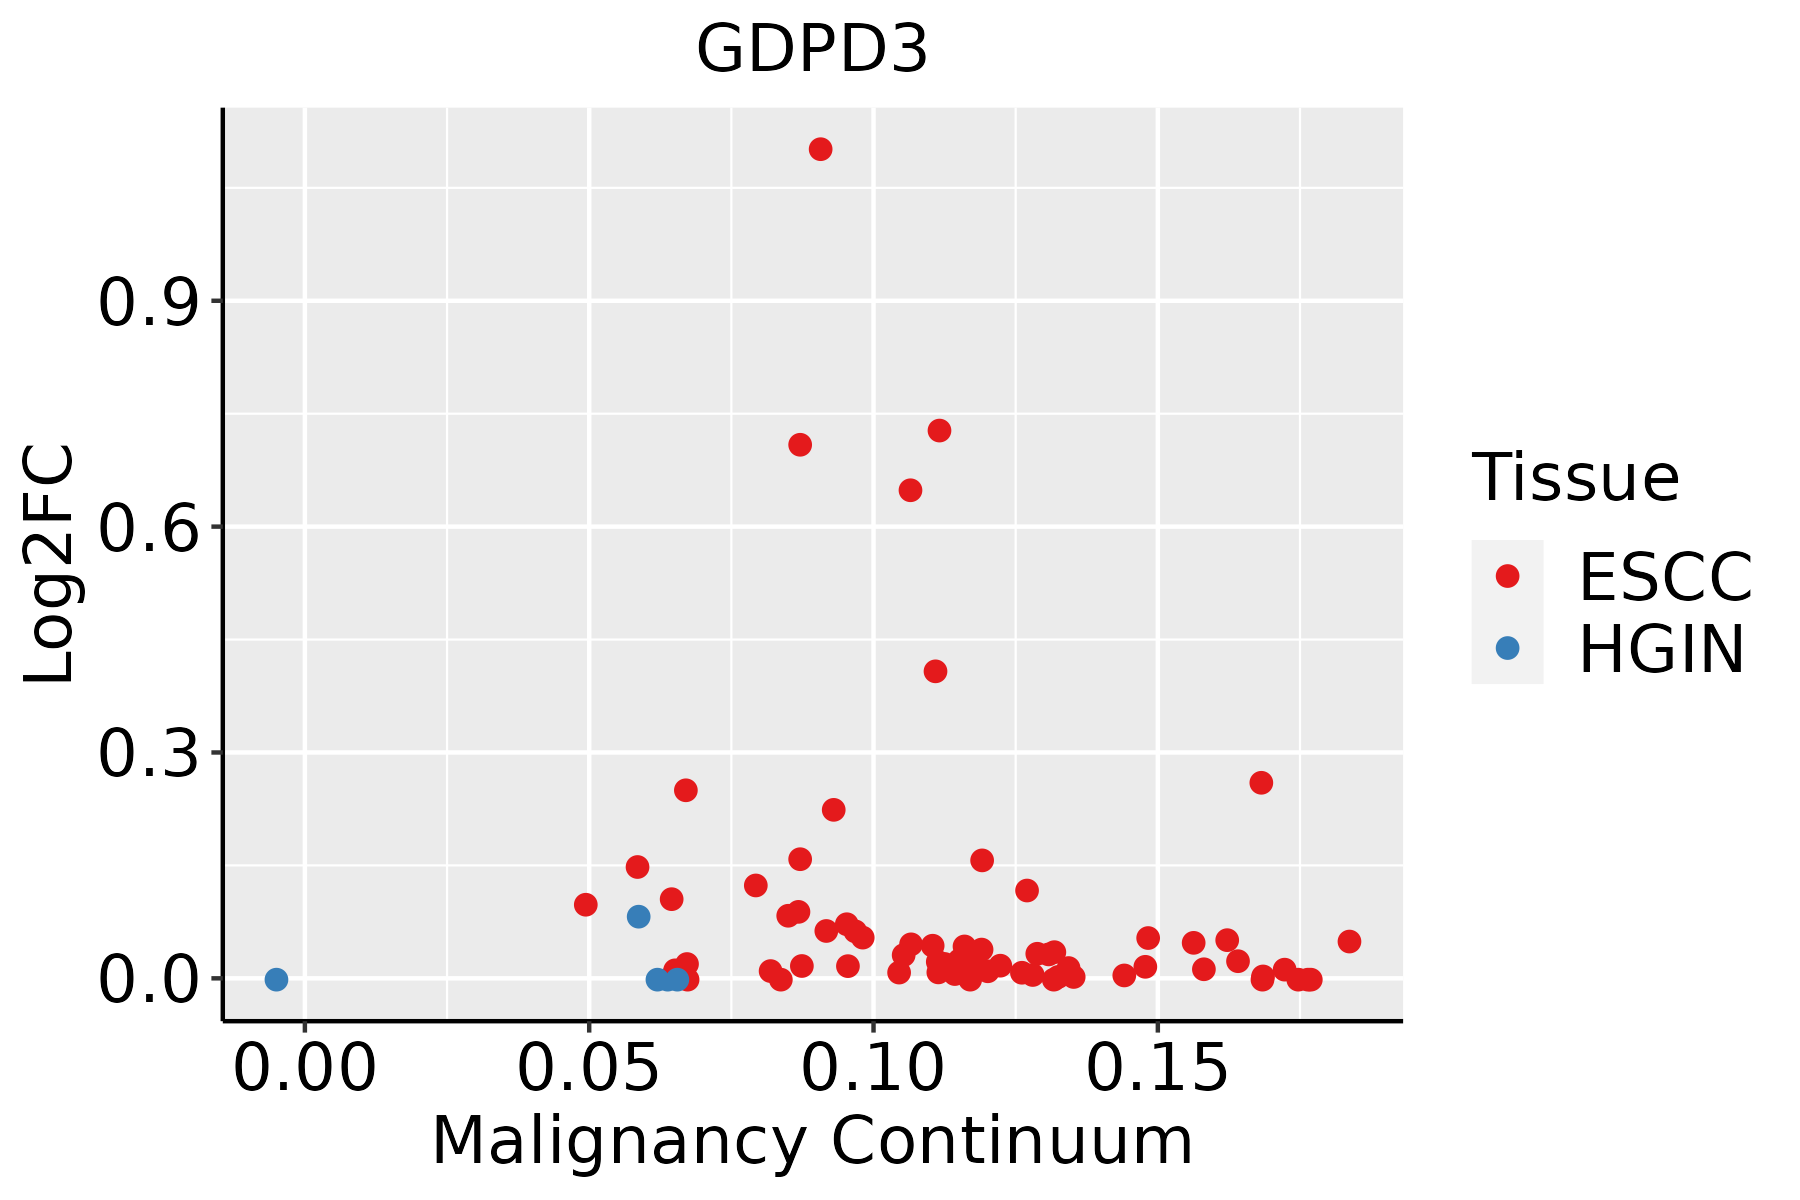 | ESCC: Esophageal squamous cell carcinoma |
| HGIN: High-grade intraepithelial neoplasias | ||
| LGIN: Low-grade intraepithelial neoplasias |
| ∗log2FC in expression of this searched gene in stem-like cells from each diseased tissue sample relative to stem-like cells in normal samples in each tissue plotted against the malignancy continuum. Samples are colored based on if they are from different disease stage. |
Top |
Malignant transformation related pathway analysis |
| Find out the enriched GO biological processes and KEGG pathways involved in transition from healthy to precancer to cancer |
| Tissue | Disease Stage | Enriched GO biological Processes |
| Colorectum | AD |  |
| Colorectum | SER |  |
| Colorectum | MSS |  |
| Colorectum | MSI-H |  |
| Colorectum | FAP |  |
| ∗Top 15 enriched GO BP terms are showed in the bar plot of each disease state in each tissue. Each row represents a significant GO biological process which is colored according to the -log10(p.adjust). |
| Page: 1 2 3 4 5 6 7 8 9 |
| GO ID | Tissue | Disease Stage | Description | Gene Ratio | Bg Ratio | pvalue | p.adjust | Count |
| GO:0006066 | Colorectum | AD | alcohol metabolic process | 106/3918 | 353/18723 | 3.02e-05 | 5.57e-04 | 106 |
| GO:0016042 | Colorectum | AD | lipid catabolic process | 97/3918 | 320/18723 | 4.31e-05 | 7.56e-04 | 97 |
| GO:0044242 | Colorectum | AD | cellular lipid catabolic process | 66/3918 | 214/18723 | 3.96e-04 | 4.50e-03 | 66 |
| GO:0034308 | Colorectum | AD | primary alcohol metabolic process | 35/3918 | 102/18723 | 1.16e-03 | 1.05e-02 | 35 |
| GO:0006650 | Colorectum | AD | glycerophospholipid metabolic process | 83/3918 | 306/18723 | 5.40e-03 | 3.55e-02 | 83 |
| GO:0006644 | Colorectum | AD | phospholipid metabolic process | 101/3918 | 383/18723 | 5.80e-03 | 3.67e-02 | 101 |
| GO:00160421 | Colorectum | SER | lipid catabolic process | 77/2897 | 320/18723 | 3.52e-05 | 9.18e-04 | 77 |
| GO:00060661 | Colorectum | SER | alcohol metabolic process | 79/2897 | 353/18723 | 3.50e-04 | 5.50e-03 | 79 |
| GO:00442421 | Colorectum | SER | cellular lipid catabolic process | 51/2897 | 214/18723 | 8.60e-04 | 1.05e-02 | 51 |
| GO:0046486 | Colorectum | SER | glycerolipid metabolic process | 82/2897 | 392/18723 | 2.26e-03 | 2.17e-02 | 82 |
| GO:00066441 | Colorectum | SER | phospholipid metabolic process | 79/2897 | 383/18723 | 3.94e-03 | 3.24e-02 | 79 |
| GO:00343081 | Colorectum | SER | primary alcohol metabolic process | 26/2897 | 102/18723 | 5.87e-03 | 4.29e-02 | 26 |
| GO:00066501 | Colorectum | SER | glycerophospholipid metabolic process | 64/2897 | 306/18723 | 6.41e-03 | 4.60e-02 | 64 |
| GO:00066446 | Esophagus | ESCC | phospholipid metabolic process | 218/8552 | 383/18723 | 5.37e-06 | 5.59e-05 | 218 |
| GO:00060668 | Esophagus | ESCC | alcohol metabolic process | 202/8552 | 353/18723 | 7.32e-06 | 7.26e-05 | 202 |
| GO:00066505 | Esophagus | ESCC | glycerophospholipid metabolic process | 174/8552 | 306/18723 | 4.92e-05 | 3.85e-04 | 174 |
| GO:00464864 | Esophagus | ESCC | glycerolipid metabolic process | 211/8552 | 392/18723 | 6.51e-04 | 3.46e-03 | 211 |
| GO:00442427 | Esophagus | ESCC | cellular lipid catabolic process | 121/8552 | 214/18723 | 8.63e-04 | 4.43e-03 | 121 |
| GO:00160427 | Esophagus | ESCC | lipid catabolic process | 168/8552 | 320/18723 | 7.97e-03 | 2.84e-02 | 168 |
| Page: 1 |
| Pathway ID | Tissue | Disease Stage | Description | Gene Ratio | Bg Ratio | pvalue | p.adjust | qvalue | Count |
| Page: 1 |
Top |
Cell-cell communication analysis |
| Identification of potential cell-cell interactions between two cell types and their ligand-receptor pairs for different disease states |
| Ligand | Receptor | LRpair | Pathway | Tissue | Disease Stage |
| Page: 1 |
Top |
Single-cell gene regulatory network inference analysis |
| Find out the significant the regulons (TFs) and the target genes of each regulon across cell types for different disease states |
| TF | Cell Type | Tissue | Disease Stage | Target Gene | RSS | Regulon Activity |
| ∗The dot plots of a searched regulon are shown for all cell subpopulations in each disease state of each tissue based on the regulon specific score inferred using pySCENIC and by calculating the average expression. |
| Page: 1 |
Top |
Somatic mutation of malignant transformation related genes |
| Annotation of somatic variants for genes involved in malignant transformation |
| Hugo Symbol | Variant Class | Variant Classification | dbSNP RS | HGVSc | HGVSp | HGVSp Short | SWISSPROT | BIOTYPE | SIFT | PolyPhen | Tumor Sample Barcode | Tissue | Histology | Sex | Age | Stage | Therapy Types | Drugs | Outcome |
| GDPD3 | insertion | Frame_Shift_Ins | novel | c.67_68insAGACGAACCA | p.Leu23GlnfsTer68 | p.L23Qfs*68 | Q7L5L3 | protein_coding | TCGA-DS-A1OC-01 | Cervix | cervical & endocervical cancer | Female | <65 | I/II | Chemotherapy | gemcitabine | SD | ||
| GDPD3 | SNV | Missense_Mutation | novel | c.437C>A | p.Pro146His | p.P146H | Q7L5L3 | protein_coding | deleterious(0) | probably_damaging(0.997) | TCGA-AA-3845-01 | Colorectum | colon adenocarcinoma | Female | >=65 | I/II | Unknown | Unknown | PD |
| GDPD3 | SNV | Missense_Mutation | novel | c.610N>A | p.Gly204Arg | p.G204R | Q7L5L3 | protein_coding | tolerated(0.08) | probably_damaging(0.912) | TCGA-AM-5820-01 | Colorectum | colon adenocarcinoma | Female | <65 | I/II | Unknown | Unknown | SD |
| GDPD3 | SNV | Missense_Mutation | c.422G>T | p.Arg141Met | p.R141M | Q7L5L3 | protein_coding | deleterious(0.03) | probably_damaging(0.911) | TCGA-G4-6628-01 | Colorectum | colon adenocarcinoma | Male | >=65 | I/II | Unknown | Unknown | SD | |
| GDPD3 | insertion | Frame_Shift_Ins | novel | c.747_748insGTTA | p.Leu250ValfsTer32 | p.L250Vfs*32 | Q7L5L3 | protein_coding | TCGA-AA-3952-01 | Colorectum | colon adenocarcinoma | Male | >=65 | III/IV | Unknown | Unknown | PD | ||
| GDPD3 | SNV | Missense_Mutation | rs370961944 | c.74N>A | p.Arg25Gln | p.R25Q | Q7L5L3 | protein_coding | tolerated(0.29) | possibly_damaging(0.543) | TCGA-A5-A0G1-01 | Endometrium | uterine corpus endometrioid carcinoma | Female | >=65 | I/II | Unknown | Unknown | SD |
| GDPD3 | SNV | Missense_Mutation | novel | c.895N>T | p.Asp299Tyr | p.D299Y | Q7L5L3 | protein_coding | deleterious(0) | probably_damaging(1) | TCGA-A5-A0G2-01 | Endometrium | uterine corpus endometrioid carcinoma | Female | <65 | III/IV | Unknown | Unknown | SD |
| GDPD3 | SNV | Missense_Mutation | c.675N>A | p.Phe225Leu | p.F225L | Q7L5L3 | protein_coding | tolerated(0.21) | benign(0.085) | TCGA-AX-A05Z-01 | Endometrium | uterine corpus endometrioid carcinoma | Female | <65 | III/IV | Chemotherapy | adriamycin | SD | |
| GDPD3 | SNV | Missense_Mutation | rs529020605 | c.73N>T | p.Arg25Trp | p.R25W | Q7L5L3 | protein_coding | tolerated(0.18) | possibly_damaging(0.854) | TCGA-AX-A06J-01 | Endometrium | uterine corpus endometrioid carcinoma | Female | >=65 | I/II | Chemotherapy | carboplatin | SD |
| GDPD3 | SNV | Missense_Mutation | novel | c.361N>A | p.Pro121Thr | p.P121T | Q7L5L3 | protein_coding | tolerated(0.1) | benign(0.332) | TCGA-AX-A1C4-01 | Endometrium | uterine corpus endometrioid carcinoma | Female | <65 | I/II | Unknown | Unknown | SD |
| Page: 1 2 3 4 |
Top |
Related drugs of malignant transformation related genes |
| Identification of chemicals and drugs interact with genes involved in malignant transfromation |
| (DGIdb 4.0) |
| Entrez ID | Symbol | Category | Interaction Types | Drug Claim Name | Drug Name | PMIDs |
| Page: 1 |

Copyright 2023-Present -The University of Texas Health Science Center at Houston |