
|
|||||
|
 | |
| |
| |
| |
| |
| |
|
Gene: GDPD1 |
Gene summary for GDPD1 |
| Gene information | Species | Human | Gene symbol | GDPD1 | Gene ID | 284161 |
| Gene name | glycerophosphodiester phosphodiesterase domain containing 1 | |
| Gene Alias | GDE4 | |
| Cytomap | 17q22 | |
| Gene Type | protein-coding | GO ID | GO:0006066 | UniProtAcc | Q8N9F7 |
Top |
Malignant transformation analysis |
| Identification of the aberrant gene expression in precancerous and cancerous lesions by comparing the gene expression of stem-like cells in diseased tissues with normal stem cells |
| Entrez ID | Symbol | Replicates | Species | Organ | Tissue | Adj P-value | Log2FC | Malignancy |
| 284161 | GDPD1 | HCC1_Meng | Human | Liver | HCC | 1.06e-28 | 7.21e-02 | 0.0246 |
| 284161 | GDPD1 | HCC1 | Human | Liver | HCC | 6.13e-24 | 2.54e+00 | 0.5336 |
| 284161 | GDPD1 | HCC2 | Human | Liver | HCC | 1.47e-30 | 2.13e+00 | 0.5341 |
| 284161 | GDPD1 | HCC5 | Human | Liver | HCC | 7.26e-48 | 2.18e+00 | 0.4932 |
| Page: 1 |
| Tissue | Expression Dynamics | Abbreviation |
| Liver | 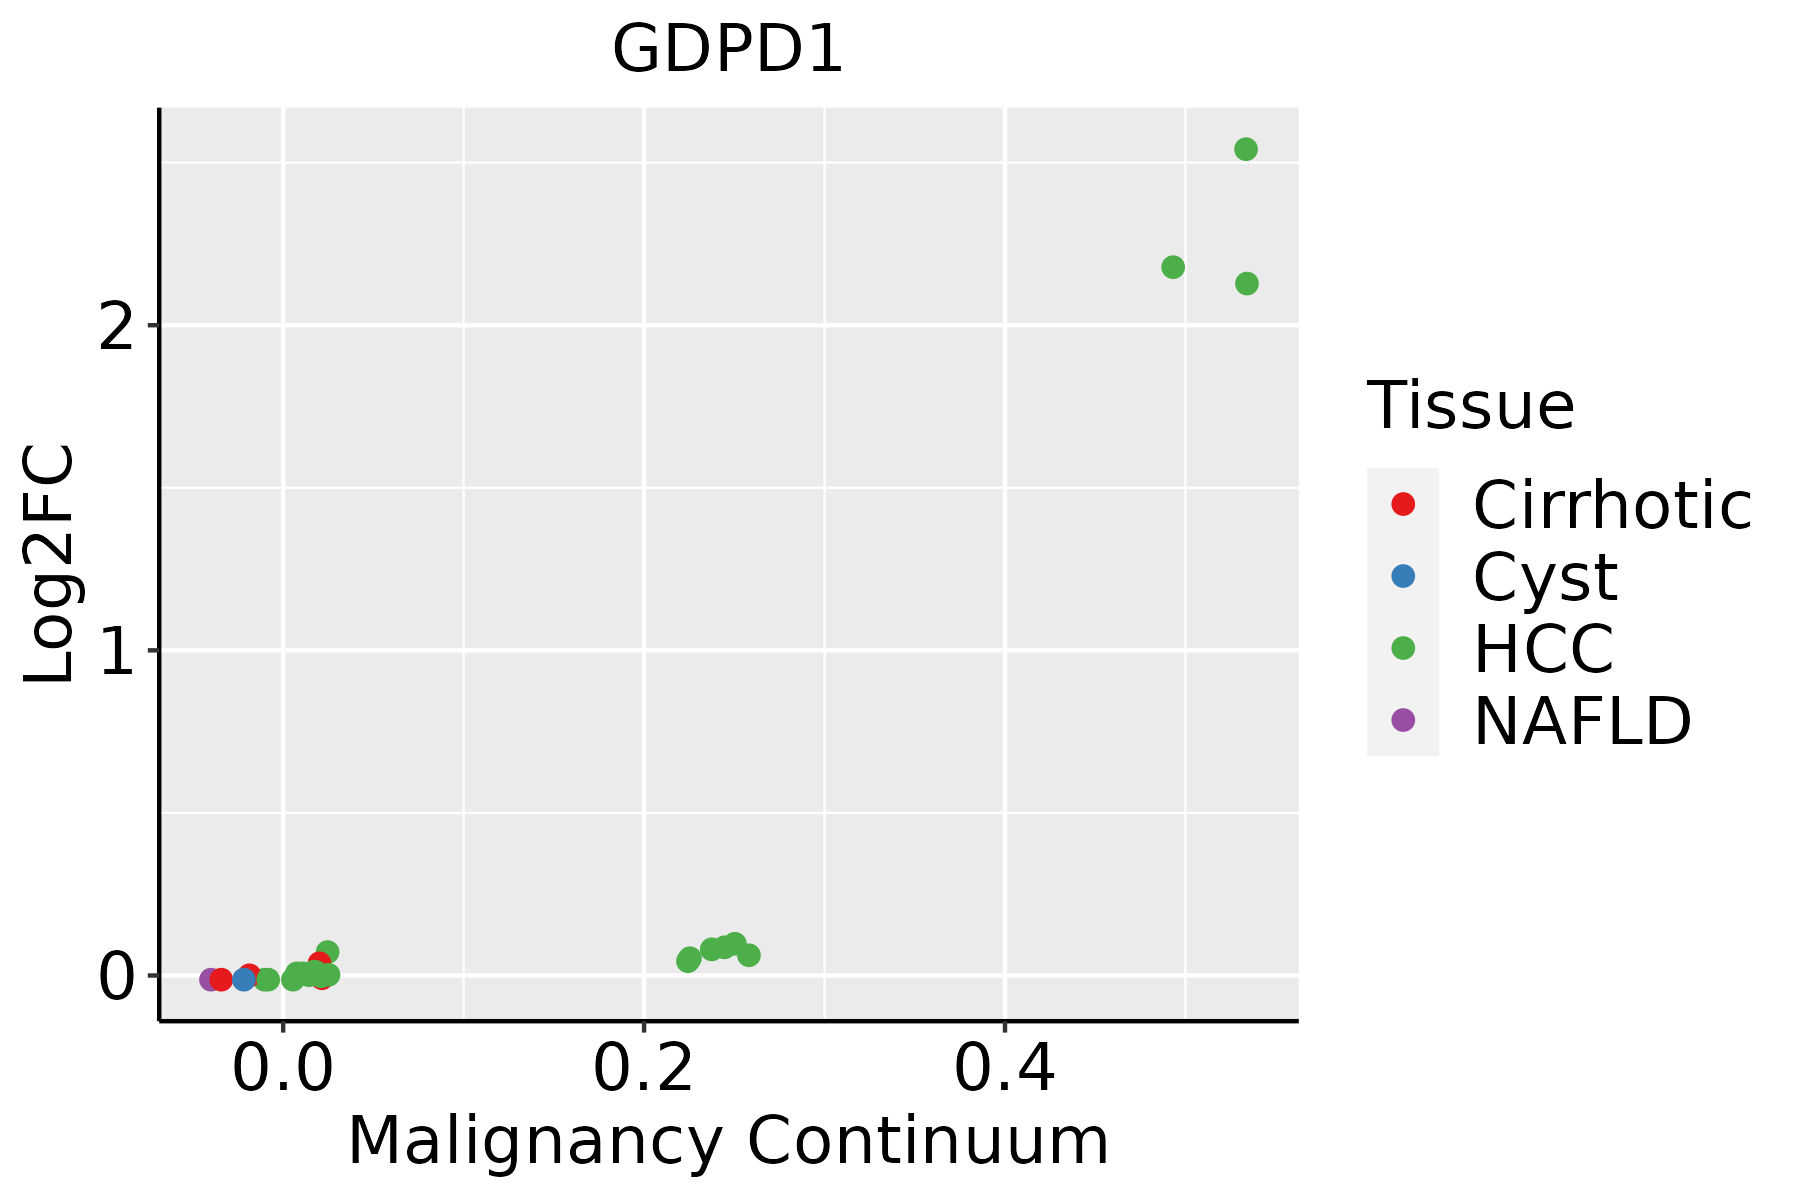 | HCC: Hepatocellular carcinoma |
| NAFLD: Non-alcoholic fatty liver disease |
| ∗log2FC in expression of this searched gene in stem-like cells from each diseased tissue sample relative to stem-like cells in normal samples in each tissue plotted against the malignancy continuum. Samples are colored based on if they are from different disease stage. |
Top |
Malignant transformation related pathway analysis |
| Find out the enriched GO biological processes and KEGG pathways involved in transition from healthy to precancer to cancer |
| Tissue | Disease Stage | Enriched GO biological Processes |
| Colorectum | AD |  |
| Colorectum | SER |  |
| Colorectum | MSS |  |
| Colorectum | MSI-H |  |
| Colorectum | FAP |  |
| ∗Top 15 enriched GO BP terms are showed in the bar plot of each disease state in each tissue. Each row represents a significant GO biological process which is colored according to the -log10(p.adjust). |
| Page: 1 2 3 4 5 6 7 8 9 |
| GO ID | Tissue | Disease Stage | Description | Gene Ratio | Bg Ratio | pvalue | p.adjust | Count |
| GO:000606621 | Liver | HCC | alcohol metabolic process | 208/7958 | 353/18723 | 2.80e-10 | 9.50e-09 | 208 |
| GO:004424222 | Liver | HCC | cellular lipid catabolic process | 134/7958 | 214/18723 | 2.07e-09 | 5.79e-08 | 134 |
| GO:00066444 | Liver | HCC | phospholipid metabolic process | 214/7958 | 383/18723 | 7.25e-08 | 1.48e-06 | 214 |
| GO:004648611 | Liver | HCC | glycerolipid metabolic process | 215/7958 | 392/18723 | 4.54e-07 | 7.49e-06 | 215 |
| GO:001604221 | Liver | HCC | lipid catabolic process | 175/7958 | 320/18723 | 6.50e-06 | 7.88e-05 | 175 |
| GO:00066504 | Liver | HCC | glycerophospholipid metabolic process | 168/7958 | 306/18723 | 7.27e-06 | 8.62e-05 | 168 |
| GO:00464342 | Liver | HCC | organophosphate catabolic process | 89/7958 | 155/18723 | 1.24e-04 | 1.03e-03 | 89 |
| GO:003430812 | Liver | HCC | primary alcohol metabolic process | 55/7958 | 102/18723 | 1.30e-02 | 4.67e-02 | 55 |
| Page: 1 |
| Pathway ID | Tissue | Disease Stage | Description | Gene Ratio | Bg Ratio | pvalue | p.adjust | qvalue | Count |
| Page: 1 |
Top |
Cell-cell communication analysis |
| Identification of potential cell-cell interactions between two cell types and their ligand-receptor pairs for different disease states |
| Ligand | Receptor | LRpair | Pathway | Tissue | Disease Stage |
| Page: 1 |
Top |
Single-cell gene regulatory network inference analysis |
| Find out the significant the regulons (TFs) and the target genes of each regulon across cell types for different disease states |
| TF | Cell Type | Tissue | Disease Stage | Target Gene | RSS | Regulon Activity |
| ∗The dot plots of a searched regulon are shown for all cell subpopulations in each disease state of each tissue based on the regulon specific score inferred using pySCENIC and by calculating the average expression. |
| Page: 1 |
Top |
Somatic mutation of malignant transformation related genes |
| Annotation of somatic variants for genes involved in malignant transformation |
| Hugo Symbol | Variant Class | Variant Classification | dbSNP RS | HGVSc | HGVSp | HGVSp Short | SWISSPROT | BIOTYPE | SIFT | PolyPhen | Tumor Sample Barcode | Tissue | Histology | Sex | Age | Stage | Therapy Types | Drugs | Outcome |
| GDPD1 | SNV | Missense_Mutation | c.383N>A | p.Gly128Glu | p.G128E | Q8N9F7 | protein_coding | deleterious(0.02) | possibly_damaging(0.596) | TCGA-A2-A04N-01 | Breast | breast invasive carcinoma | Female | >=65 | I/II | Chemotherapy | cytoxan | SD | |
| GDPD1 | SNV | Missense_Mutation | c.287N>C | p.Gly96Ala | p.G96A | Q8N9F7 | protein_coding | deleterious(0) | probably_damaging(0.997) | TCGA-A8-A09W-01 | Breast | breast invasive carcinoma | Female | >=65 | III/IV | Unknown | Unknown | SD | |
| GDPD1 | SNV | Missense_Mutation | c.365N>C | p.Arg122Thr | p.R122T | Q8N9F7 | protein_coding | tolerated(0.53) | benign(0.073) | TCGA-AC-A23H-01 | Breast | breast invasive carcinoma | Female | >=65 | I/II | Unknown | Unknown | PD | |
| GDPD1 | SNV | Missense_Mutation | novel | c.262N>A | p.Asp88Asn | p.D88N | Q8N9F7 | protein_coding | deleterious(0) | probably_damaging(1) | TCGA-AO-A0JC-01 | Breast | breast invasive carcinoma | Female | <65 | I/II | Chemotherapy | fluorouracil | SD |
| GDPD1 | SNV | Missense_Mutation | c.218N>C | p.Leu73Ser | p.L73S | Q8N9F7 | protein_coding | deleterious(0) | probably_damaging(0.997) | TCGA-BH-A18G-01 | Breast | breast invasive carcinoma | Female | >=65 | I/II | Unknown | Unknown | SD | |
| GDPD1 | SNV | Missense_Mutation | c.635N>C | p.Phe212Ser | p.F212S | Q8N9F7 | protein_coding | deleterious(0) | possibly_damaging(0.889) | TCGA-BH-A1EN-01 | Breast | breast invasive carcinoma | Female | >=65 | I/II | Unknown | Unknown | SD | |
| GDPD1 | deletion | Frame_Shift_Del | novel | c.416delN | p.Phe140LeufsTer20 | p.F140Lfs*20 | Q8N9F7 | protein_coding | TCGA-D8-A27V-01 | Breast | breast invasive carcinoma | Female | <65 | I/II | Hormone Therapy | tamoxiphen | SD | ||
| GDPD1 | SNV | Missense_Mutation | novel | c.278N>A | p.Arg93Lys | p.R93K | Q8N9F7 | protein_coding | deleterious(0) | probably_damaging(0.995) | TCGA-DS-A7WH-01 | Cervix | cervical & endocervical cancer | Female | <65 | I/II | Chemotherapy | cisplatin | CR |
| GDPD1 | SNV | Missense_Mutation | novel | c.5C>G | p.Ser2Trp | p.S2W | Q8N9F7 | protein_coding | deleterious_low_confidence(0) | possibly_damaging(0.752) | TCGA-AA-3968-01 | Colorectum | colon adenocarcinoma | Female | <65 | I/II | Unknown | Unknown | SD |
| GDPD1 | SNV | Missense_Mutation | novel | c.578N>C | p.Asn193Thr | p.N193T | Q8N9F7 | protein_coding | deleterious(0) | probably_damaging(0.976) | TCGA-CA-6717-01 | Colorectum | colon adenocarcinoma | Male | <65 | I/II | Chemotherapy | oxaliplatin | CR |
| Page: 1 2 3 4 |
Top |
Related drugs of malignant transformation related genes |
| Identification of chemicals and drugs interact with genes involved in malignant transfromation |
| (DGIdb 4.0) |
| Entrez ID | Symbol | Category | Interaction Types | Drug Claim Name | Drug Name | PMIDs |
| Page: 1 |

Copyright 2023-Present -The University of Texas Health Science Center at Houston |