Schematic overview of the cellular and molecular mechanisms involved in the cancer progression, including the proposed cellular and molecular mechanisms in cancer cells trajectory. AT1: alveolar type 1 cells; AT2: alveolar type 2 cells; AAH: atypical adenomatous hyperplasia; AIS: adenocarcinoma in situ; MIA: minimally invasive adenocarcinoma; IA: invasive adenocarcinoma; EMT: epithelial-mesenchymal transition

Home

Download

Statistics

Help

Contact

Center for Computational Systems Medicine
leaf

Gene summary

leaf

Malignant transformation analysis

leaf

Malignant transformation related pathway analysis

leaf

Cell-cell communication analysis

leaf

Single-cell gene regulatory network inference analysis

leaf

Somatic mutation of malignant transformation related genes

leaf

Related drugs of malignant transformation related genes

Gene: GDI1

Gene summary for GDI1

check button Gene summary.

Gene informationSpeciesHuman
Gene symbol

GDI1

Gene ID

2664

Gene nameGDP dissociation inhibitor 1
Gene Alias1A
CytomapXq28
Gene Typeprotein-coding
GO ID

GO:0000902

UniProtAcc

A0A0S2Z3X8


Top

Malignant transformation analysis

check button Identification of the aberrant gene expression in precancerous and cancerous lesions by comparing the gene expression of stem-like cells in diseased tissues with normal stem cells
check button Malignant transformation involving gene list.
Entrez IDSymbolReplicatesSpeciesOrganTissueAdj P-valueLog2FCMalignancy
2664GDI1LZE2THumanEsophagusESCC1.90e-056.90e-010.082
2664GDI1LZE4THumanEsophagusESCC1.36e-246.77e-010.0811
2664GDI1LZE5THumanEsophagusESCC4.21e-023.63e-010.0514
2664GDI1LZE7THumanEsophagusESCC5.46e-321.44e+000.0667
2664GDI1LZE8THumanEsophagusESCC3.62e-093.44e-010.067
2664GDI1LZE20THumanEsophagusESCC1.99e-154.24e-010.0662
2664GDI1LZE22THumanEsophagusESCC4.54e-097.28e-010.068
2664GDI1LZE24THumanEsophagusESCC2.10e-511.18e+000.0596
2664GDI1LZE21THumanEsophagusESCC6.27e-096.80e-010.0655
2664GDI1LZE6THumanEsophagusESCC3.59e-094.02e-010.0845
2664GDI1P1T-EHumanEsophagusESCC1.04e-271.12e+000.0875
2664GDI1P2T-EHumanEsophagusESCC1.54e-468.06e-010.1177
2664GDI1P4T-EHumanEsophagusESCC1.04e-347.76e-010.1323
2664GDI1P5T-EHumanEsophagusESCC8.64e-417.50e-010.1327
2664GDI1P8T-EHumanEsophagusESCC1.87e-345.93e-010.0889
2664GDI1P9T-EHumanEsophagusESCC1.14e-408.08e-010.1131
2664GDI1P10T-EHumanEsophagusESCC2.93e-741.36e+000.116
2664GDI1P11T-EHumanEsophagusESCC2.51e-351.11e+000.1426
2664GDI1P12T-EHumanEsophagusESCC9.42e-551.02e+000.1122
2664GDI1P15T-EHumanEsophagusESCC1.47e-447.56e-010.1149
Page: 1 2 3 4 5 6 

check button Transcriptomic changes along malignancy continuum.
TissueExpression DynamicsAbbreviation
EsophagusThe image shows the transcriptomic changes along malignancy continuum.log2FC in expression of this searched gene in stem-like cells from each diseased tissue sample relative to stem-like cells in normal samples in each tissue plotted against the malignancy continuum. Samples are colored based on if they are from different disease stage.ESCC: Esophageal squamous cell carcinoma
HGIN: High-grade intraepithelial neoplasias
LGIN: Low-grade intraepithelial neoplasias
LiverThe image shows the transcriptomic changes along malignancy continuum.log2FC in expression of this searched gene in stem-like cells from each diseased tissue sample relative to stem-like cells in normal samples in each tissue plotted against the malignancy continuum. Samples are colored based on if they are from different disease stage.
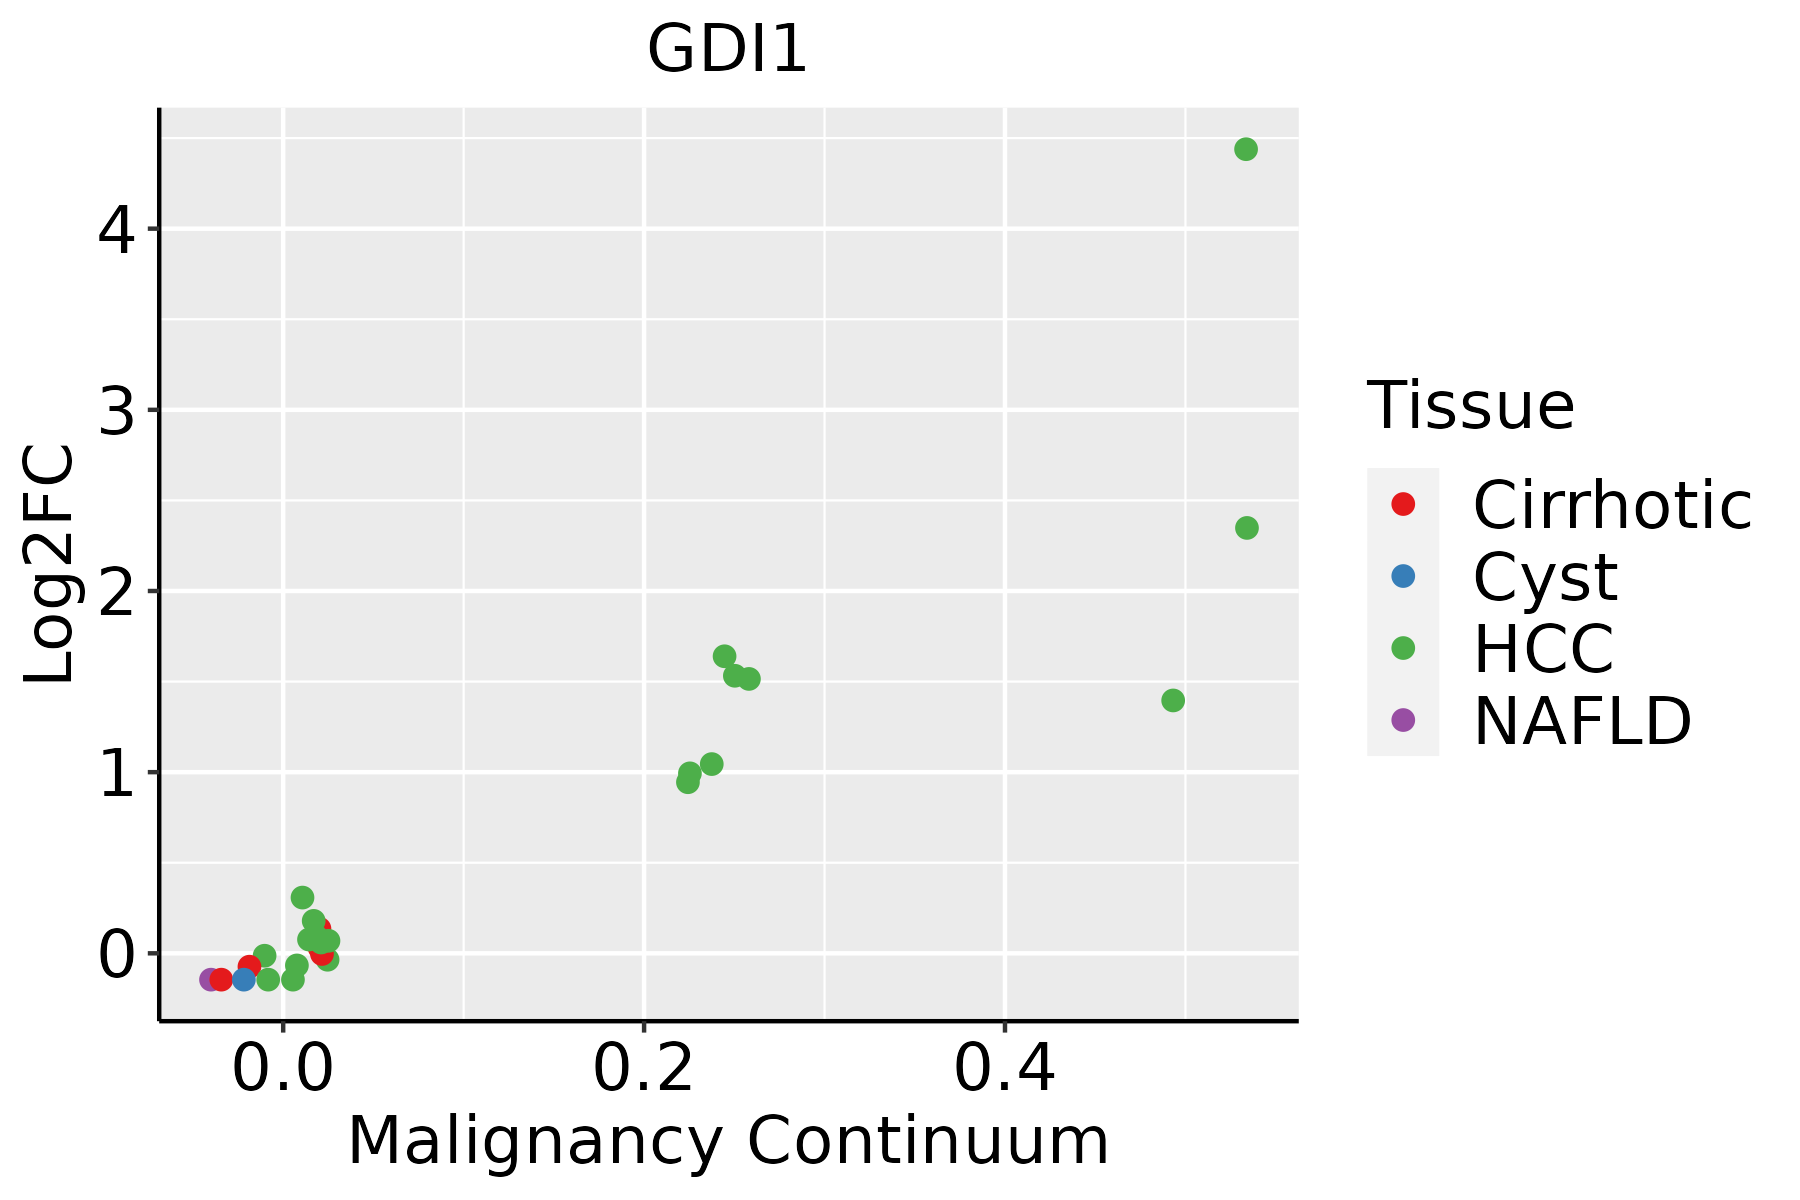
HCC: Hepatocellular carcinoma
NAFLD: Non-alcoholic fatty liver disease
Oral CavityThe image shows the transcriptomic changes along malignancy continuum.log2FC in expression of this searched gene in stem-like cells from each diseased tissue sample relative to stem-like cells in normal samples in each tissue plotted against the malignancy continuum. Samples are colored based on if they are from different disease stage.
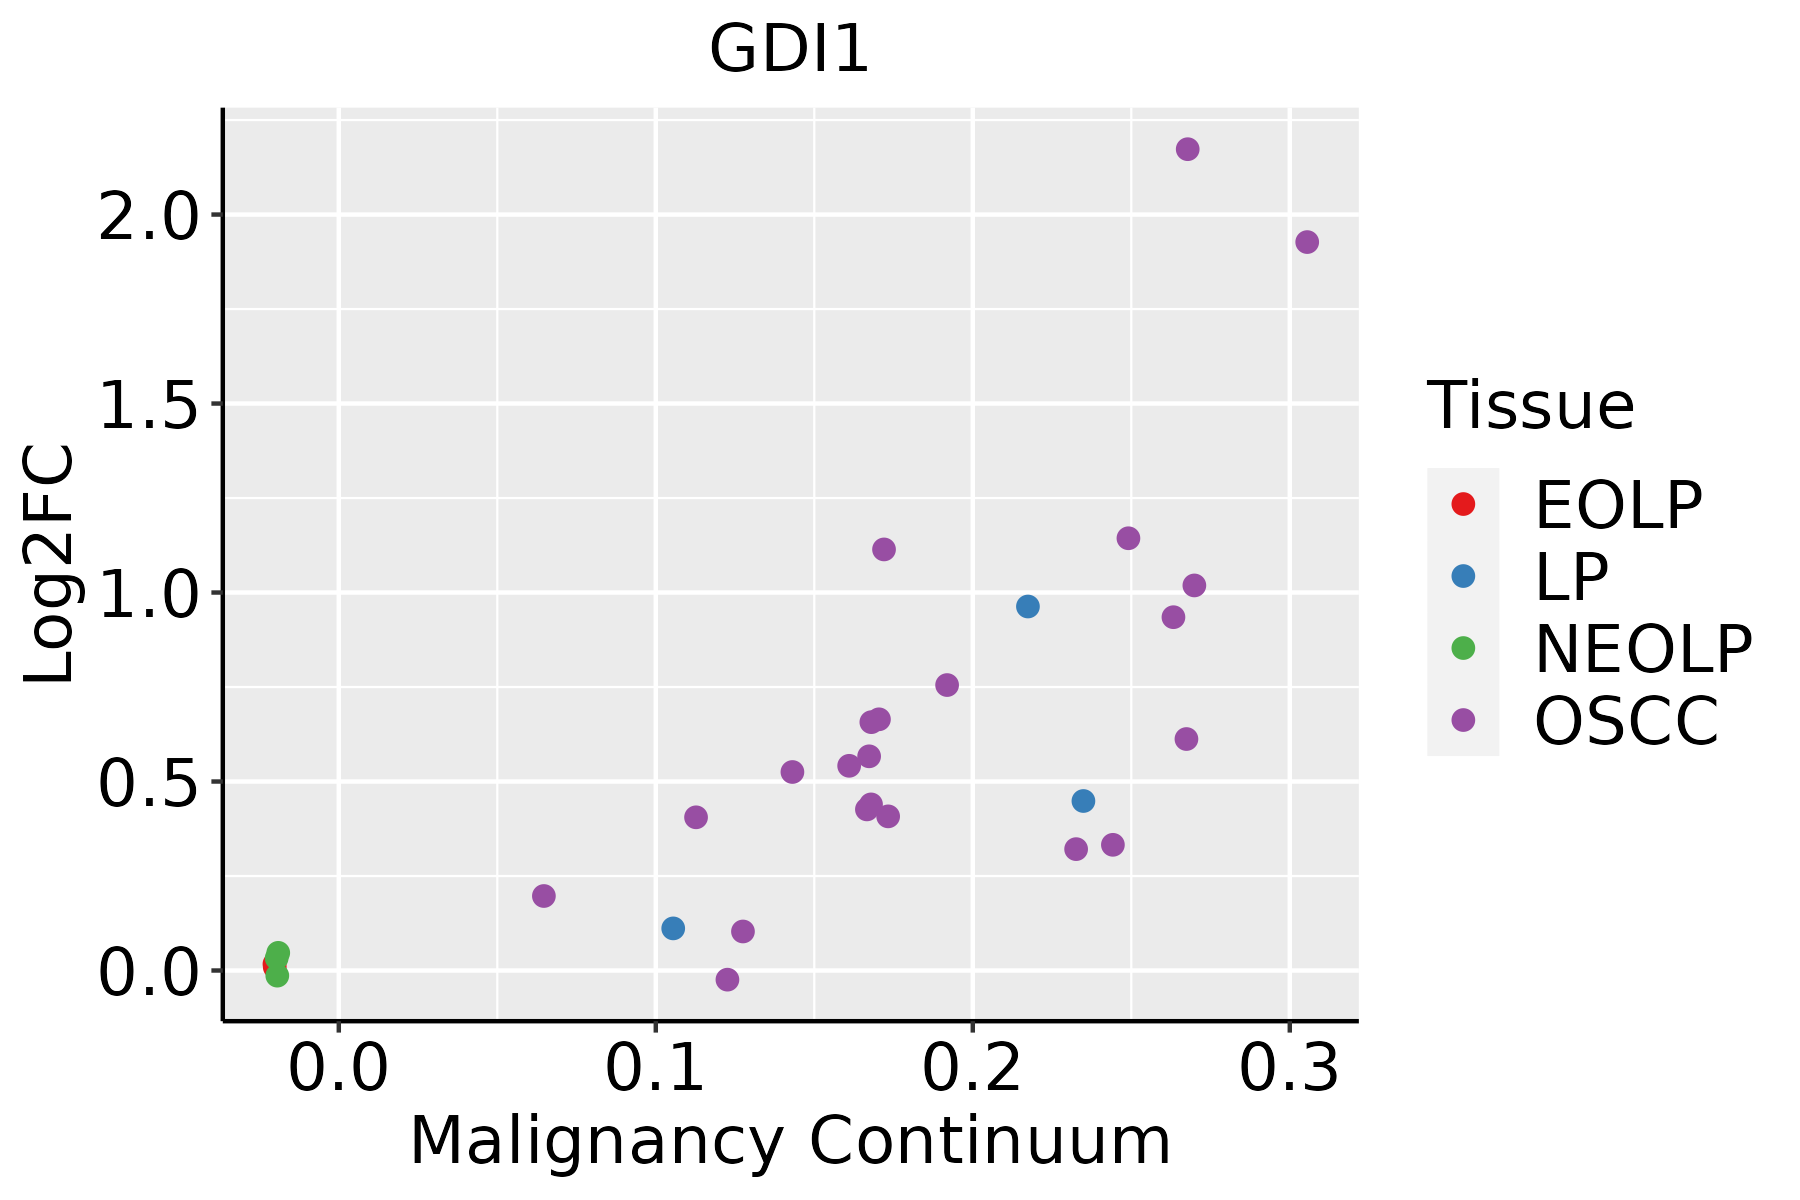
EOLP: Erosive Oral lichen planus
LP: leukoplakia
NEOLP: Non-erosive oral lichen planus
OSCC: Oral squamous cell carcinoma
SkinThe image shows the transcriptomic changes along malignancy continuum.log2FC in expression of this searched gene in stem-like cells from each diseased tissue sample relative to stem-like cells in normal samples in each tissue plotted against the malignancy continuum. Samples are colored based on if they are from different disease stage.
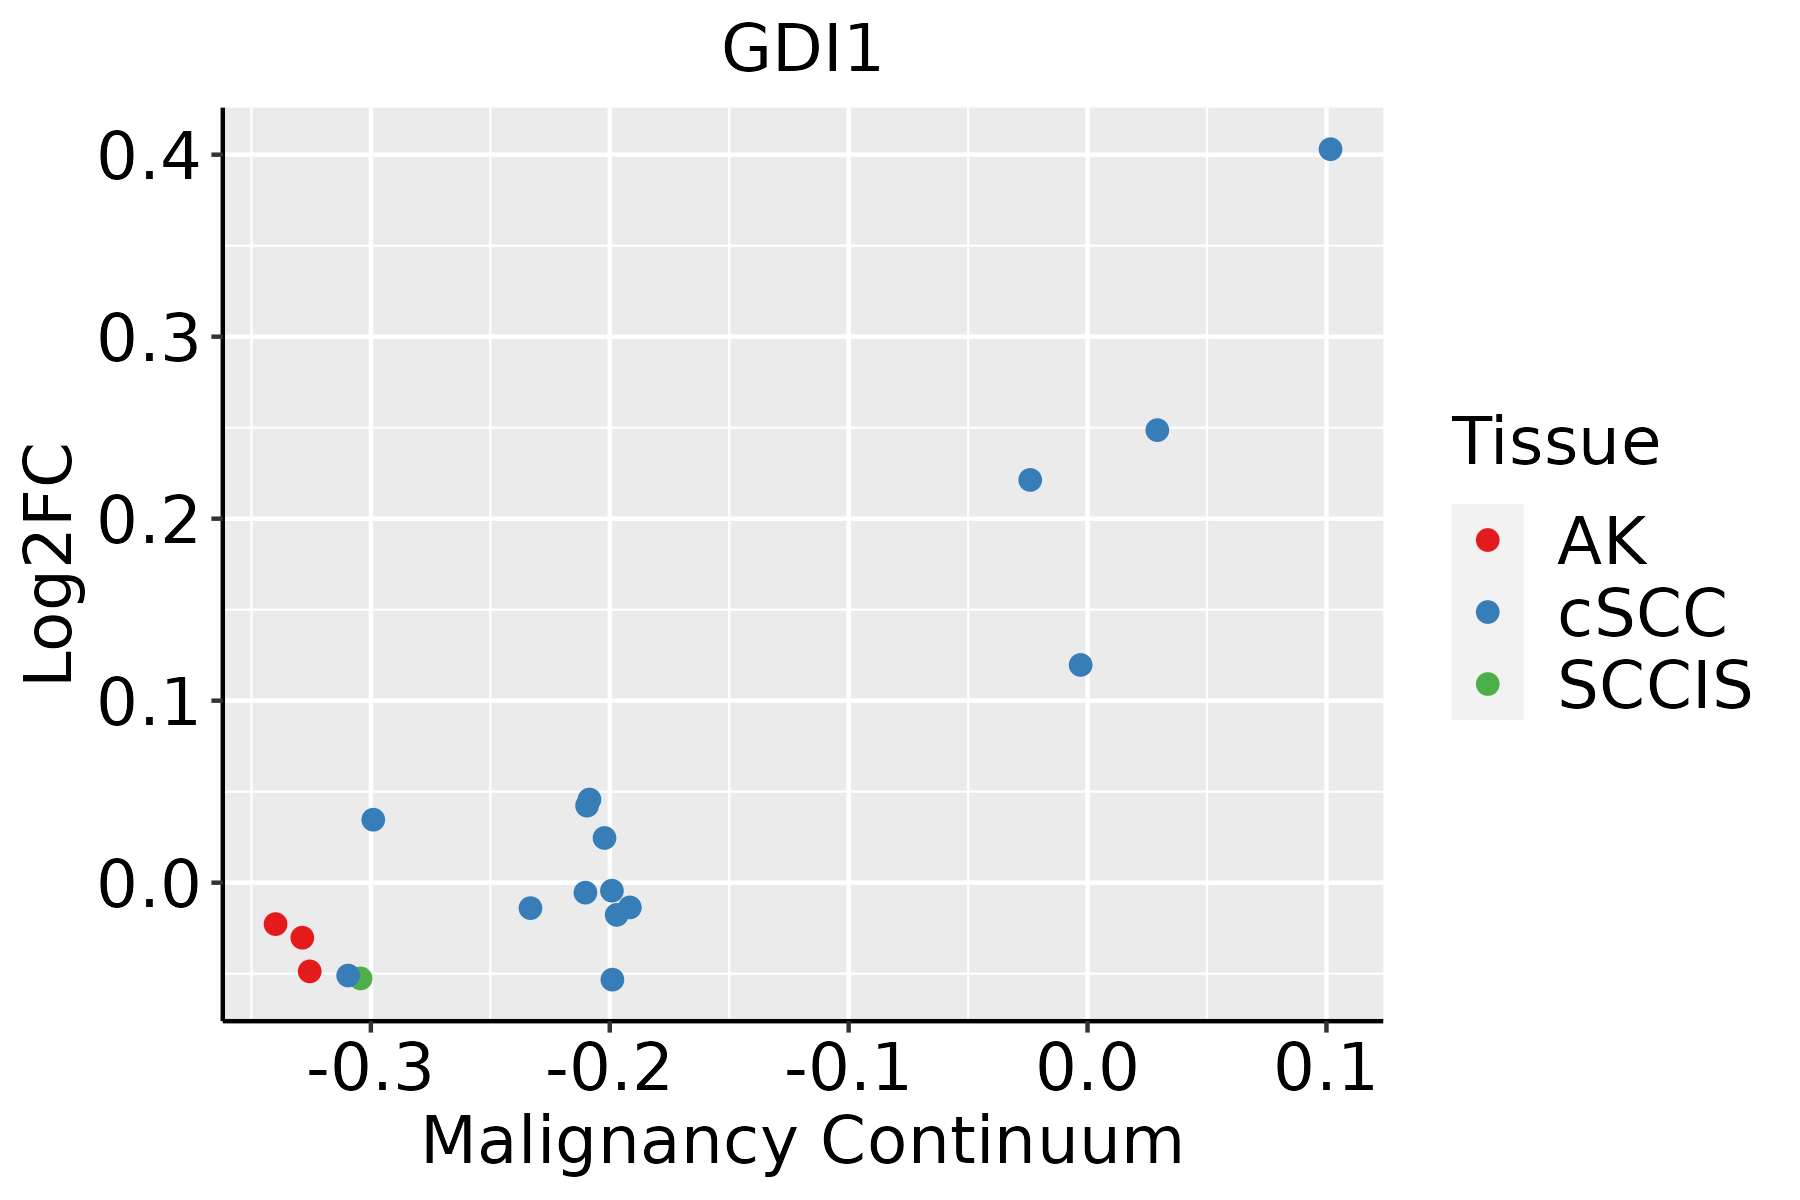
AK: Actinic keratosis
cSCC: Cutaneous squamous cell carcinoma
SCCIS:squamous cell carcinoma in situ
ThyroidThe image shows the transcriptomic changes along malignancy continuum.log2FC in expression of this searched gene in stem-like cells from each diseased tissue sample relative to stem-like cells in normal samples in each tissue plotted against the malignancy continuum. Samples are colored based on if they are from different disease stage.
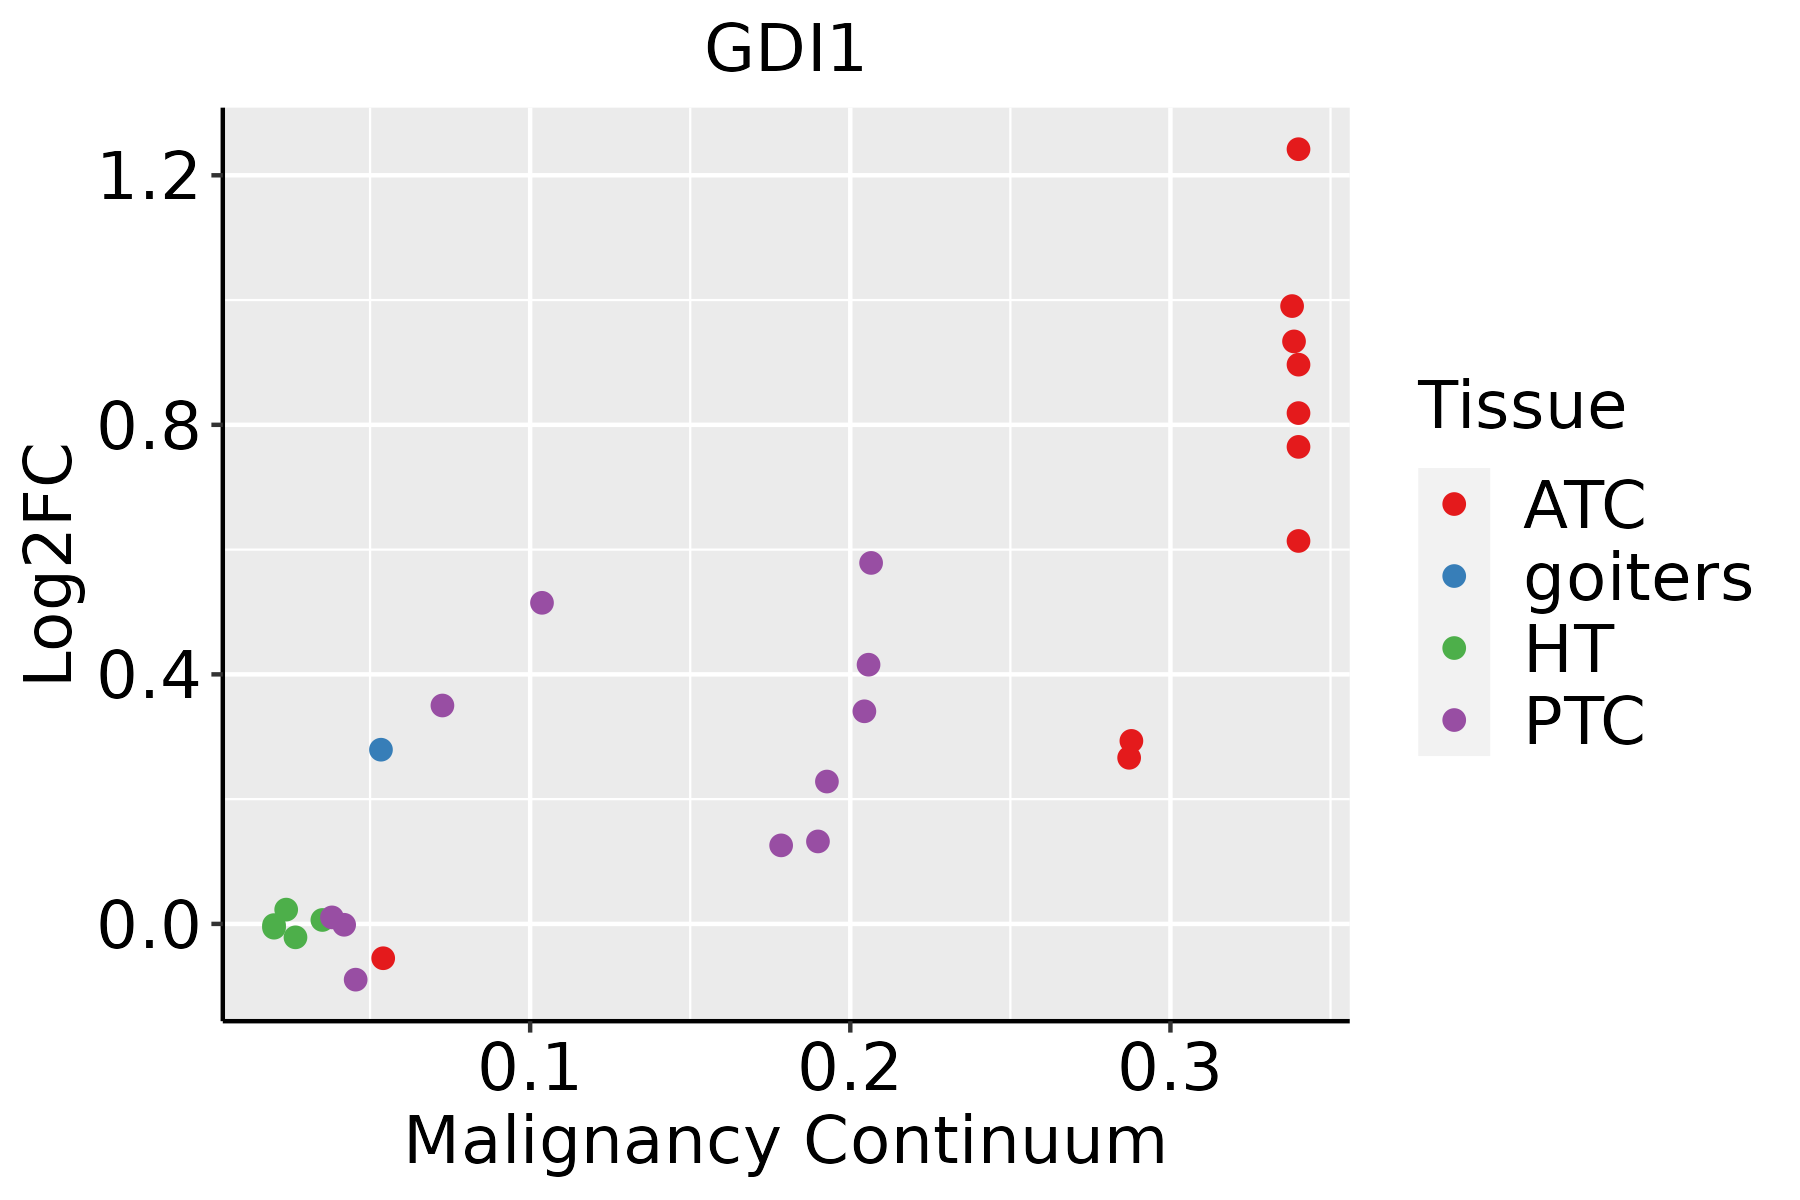
ATC: Anaplastic thyroid cancer
HT: Hashimoto's thyroiditis
PTC: Papillary thyroid cancer
∗log2FC in expression of this searched gene in stem-like cells from each diseased tissue sample relative to stem-like cells in normal samples in each tissue plotted against the malignancy continuum. Samples are colored based on if they are from different disease stage.

Top

Malignant transformation related pathway analysis

check buttonFind out the enriched GO biological processes and KEGG pathways involved in transition from healthy to precancer to cancer
check button Figure of enriched GO biological processes.
TissueDisease StageEnriched GO biological Processes
ColorectumADGO analysis - Figure of enriched GO biological processes: Top 15 enriched GO BP terms are showed in the bar plot of each disease state in each tissue. Each row represents a significant GO biological process which is colored according to the -log10(p.adjust).
ColorectumSERGO analysis - Figure of enriched GO biological processes: Top 15 enriched GO BP terms are showed in the bar plot of each disease state in each tissue. Each row represents a significant GO biological process which is colored according to the -log10(p.adjust).
ColorectumMSSGO analysis - Figure of enriched GO biological processes: Top 15 enriched GO BP terms are showed in the bar plot of each disease state in each tissue. Each row represents a significant GO biological process which is colored according to the -log10(p.adjust).
ColorectumMSI-HGO analysis - Figure of enriched GO biological processes: Top 15 enriched GO BP terms are showed in the bar plot of each disease state in each tissue. Each row represents a significant GO biological process which is colored according to the -log10(p.adjust).
ColorectumFAPGO analysis - Figure of enriched GO biological processes: Top 15 enriched GO BP terms are showed in the bar plot of each disease state in each tissue. Each row represents a significant GO biological process which is colored according to the -log10(p.adjust).
∗Top 15 enriched GO BP terms are showed in the bar plot of each disease state in each tissue. Each row represents a significant GO biological process which is colored according to the -log10(p.adjust).
Page: 1 2 3 4 5 6 7 8 9 

check button Enriched GO biological processes.
GO IDTissueDisease StageDescriptionGene RatioBg Ratiopvaluep.adjustCount
GO:003238618EsophagusESCCregulation of intracellular transport243/8552337/187233.20e-237.25e-21243
GO:0006605111EsophagusESCCprotein targeting229/8552314/187234.93e-231.01e-20229
GO:0033157110EsophagusESCCregulation of intracellular protein transport169/8552229/187233.31e-183.23e-16169
GO:0090150110EsophagusESCCestablishment of protein localization to membrane182/8552260/187231.27e-158.19e-14182
GO:0016049110EsophagusESCCcell growth289/8552482/187231.29e-103.77e-09289
GO:000155819EsophagusESCCregulation of cell growth248/8552414/187232.97e-096.45e-08248
GO:190547519EsophagusESCCregulation of protein localization to membrane117/8552175/187231.14e-082.26e-07117
GO:003253520EsophagusESCCregulation of cellular component size227/8552383/187234.77e-088.60e-07227
GO:000726510EsophagusESCCRas protein signal transduction201/8552337/187231.44e-072.30e-06201
GO:190353315EsophagusESCCregulation of protein targeting57/855281/187235.83e-066.03e-0557
GO:003134616EsophagusESCCpositive regulation of cell projection organization201/8552353/187231.19e-051.11e-04201
GO:001072010EsophagusESCCpositive regulation of cell development172/8552298/187231.74e-051.55e-04172
GO:19038289EsophagusESCCnegative regulation of cellular protein localization76/8552117/187231.97e-051.72e-0476
GO:00066124EsophagusESCCprotein targeting to membrane83/8552131/187233.31e-052.73e-0483
GO:001003827EsophagusESCCresponse to metal ion208/8552373/187235.02e-053.90e-04208
GO:005076710EsophagusESCCregulation of neurogenesis203/8552364/187236.10e-054.68e-04203
GO:00507697EsophagusESCCpositive regulation of neurogenesis131/8552225/187239.71e-056.90e-04131
GO:003030710EsophagusESCCpositive regulation of cell growth100/8552166/187231.07e-047.55e-04100
GO:00083619EsophagusESCCregulation of cell size107/8552181/187231.81e-041.16e-03107
GO:006156415EsophagusESCCaxon development251/8552467/187232.41e-041.49e-03251
Page: 1 2 3 4 5 6 7 8 9 10 11 12 13 14 

check button Enriched KEGG pathways.
Pathway IDTissueDisease StageDescriptionGene RatioBg Ratiopvaluep.adjustqvalueCount
Page: 1 

Top

Cell-cell communication analysis

check buttonIdentification of potential cell-cell interactions between two cell types and their ligand-receptor pairs for different disease states
LigandReceptorLRpairPathwayTissueDisease Stage
Page: 1 

Top

Single-cell gene regulatory network inference analysis

check buttonFind out the significant the regulons (TFs) and the target genes of each regulon across cell types for different disease states
TFCell TypeTissueDisease StageTarget GeneRSSRegulon Activity
∗The dot plots of a searched regulon are shown for all cell subpopulations in each disease state of each tissue based on the regulon specific score inferred using pySCENIC and by calculating the average expression.
Page: 1 

Top

Somatic mutation of malignant transformation related genes

check buttonAnnotation of somatic variants for genes involved in malignant transformation
Hugo SymbolVariant ClassVariant ClassificationdbSNP RSHGVScHGVSpHGVSp ShortSWISSPROTBIOTYPESIFTPolyPhenTumor Sample BarcodeTissueHistologySexAgeStageTherapy TypesDrugsOutcome
GDI1SNVMissense_Mutationc.991G>Ap.Asp331Asnp.D331NP31150protein_codingdeleterious(0.01)probably_damaging(0.997)TCGA-A8-A08O-01Breastbreast invasive carcinomaFemale<65III/IVChemotherapydocetaxelPD
GDI1SNVMissense_Mutationc.478N>Cp.Gly160Argp.G160RP31150protein_codingdeleterious(0.01)possibly_damaging(0.866)TCGA-AR-A0TW-01Breastbreast invasive carcinomaFemale<65III/IVChemotherapydoxorubicinPD
GDI1SNVMissense_Mutationrs782575041c.517N>Tp.Arg173Trpp.R173WP31150protein_codingdeleterious(0)possibly_damaging(0.673)TCGA-BH-A0E2-01Breastbreast invasive carcinomaFemale<65III/IVChemotherapydoxorubicinSD
GDI1SNVMissense_Mutationc.623N>Ap.Arg208Hisp.R208HP31150protein_codingdeleterious(0)probably_damaging(0.974)TCGA-C8-A12Z-01Breastbreast invasive carcinomaFemale<65I/IIChemotherapy5-fluorouracilCR
GDI1SNVMissense_Mutationnovelc.251N>Tp.Asn84Ilep.N84IP31150protein_codingdeleterious(0)probably_damaging(0.919)TCGA-C8-A3M8-01Breastbreast invasive carcinomaFemale>=65I/IIHormone TherapytamoxiphenCR
GDI1insertionFrame_Shift_Insnovelc.1123_1124insTp.Pro375LeufsTer3p.P375Lfs*3P31150protein_codingTCGA-A7-A0CJ-01Breastbreast invasive carcinomaFemale<65I/IIChemotherapycytoxanSD
GDI1insertionFrame_Shift_Insnovelc.1125_1126insCTGCCTTACCTCTCTGGAAAAAAp.Ile376LeufsTer67p.I376Lfs*67P31150protein_codingTCGA-A7-A0CJ-01Breastbreast invasive carcinomaFemale<65I/IIChemotherapycytoxanSD
GDI1insertionIn_Frame_Insnovelc.151_152insTAAGCCTTTCTTTTCCTCCCTTTCGAGTGTCCTTTGCAGTCCp.Glu51delinsValSerLeuSerPheProProPheArgValSerPheAlaValGlnp.E51delinsVSLSFPPFRVSFAVQP31150protein_codingTCGA-A8-A06P-01Breastbreast invasive carcinomaFemale<65III/IVUnspecificSD
GDI1deletionFrame_Shift_Delnovelc.796delGp.Val266TrpfsTer3p.V266Wfs*3P31150protein_codingTCGA-D8-A27V-01Breastbreast invasive carcinomaFemale<65I/IIHormone TherapytamoxiphenSD
GDI1SNVMissense_Mutationc.924N>Gp.Ile308Metp.I308MP31150protein_codingdeleterious(0)probably_damaging(0.988)TCGA-DS-A0VM-01Cervixcervical & endocervical cancerFemale<65I/IIChemotherapycisplatinPD
Page: 1 2 3 4 5 6 7 

Top

Related drugs of malignant transformation related genes

check buttonIdentification of chemicals and drugs interact with genes involved in malignant transfromation
(DGIdb 4.0)
Entrez IDSymbolCategoryInteraction TypesDrug Claim NameDrug NamePMIDs
Page: 1