
|
|||||
|
 | |
| |
| |
| |
| |
| |
|
Gene: GDF15 |
Gene summary for GDF15 |
| Gene information | Species | Human | Gene symbol | GDF15 | Gene ID | 9518 |
| Gene name | growth differentiation factor 15 | |
| Gene Alias | GDF-15 | |
| Cytomap | 19p13.11 | |
| Gene Type | protein-coding | GO ID | GO:0000165 | UniProtAcc | Q99988 |
Top |
Malignant transformation analysis |
| Identification of the aberrant gene expression in precancerous and cancerous lesions by comparing the gene expression of stem-like cells in diseased tissues with normal stem cells |
| Entrez ID | Symbol | Replicates | Species | Organ | Tissue | Adj P-value | Log2FC | Malignancy |
| 9518 | GDF15 | GSM4909282 | Human | Breast | IDC | 1.57e-03 | -1.73e-01 | -0.0288 |
| 9518 | GDF15 | GSM4909286 | Human | Breast | IDC | 3.32e-03 | -1.74e-01 | 0.1081 |
| 9518 | GDF15 | GSM4909297 | Human | Breast | IDC | 2.27e-06 | 4.81e-01 | 0.1517 |
| 9518 | GDF15 | GSM4909301 | Human | Breast | IDC | 3.32e-50 | 1.12e+00 | 0.1577 |
| 9518 | GDF15 | GSM4909308 | Human | Breast | IDC | 4.85e-04 | 1.62e-01 | 0.158 |
| 9518 | GDF15 | GSM4909319 | Human | Breast | IDC | 8.77e-03 | 1.99e-01 | 0.1563 |
| 9518 | GDF15 | GSM4909320 | Human | Breast | IDC | 2.87e-04 | 5.11e-01 | 0.1575 |
| 9518 | GDF15 | GSM4909321 | Human | Breast | IDC | 1.01e-17 | 7.92e-01 | 0.1559 |
| 9518 | GDF15 | brca1 | Human | Breast | Precancer | 4.02e-02 | -1.53e-01 | -0.0338 |
| 9518 | GDF15 | brca10 | Human | Breast | Precancer | 1.62e-38 | 1.15e+00 | -0.0029 |
| 9518 | GDF15 | HTA11_3410_2000001011 | Human | Colorectum | AD | 1.88e-03 | 3.08e-01 | 0.0155 |
| 9518 | GDF15 | HTA11_2951_2000001011 | Human | Colorectum | AD | 5.46e-04 | 7.61e-01 | 0.0216 |
| 9518 | GDF15 | HTA11_1938_2000001011 | Human | Colorectum | AD | 4.48e-13 | 1.08e+00 | -0.0811 |
| 9518 | GDF15 | HTA11_78_2000001011 | Human | Colorectum | AD | 1.11e-05 | 3.04e-01 | -0.1088 |
| 9518 | GDF15 | HTA11_411_2000001011 | Human | Colorectum | SER | 1.66e-02 | 3.06e-01 | -0.2602 |
| 9518 | GDF15 | HTA11_1391_2000001011 | Human | Colorectum | AD | 7.76e-16 | 1.13e+00 | -0.059 |
| 9518 | GDF15 | HTA11_866_3004761011 | Human | Colorectum | AD | 3.43e-10 | 7.35e-01 | 0.096 |
| 9518 | GDF15 | HTA11_10711_2000001011 | Human | Colorectum | AD | 1.17e-06 | 3.97e-01 | 0.0338 |
| 9518 | GDF15 | HTA11_7696_3000711011 | Human | Colorectum | AD | 1.30e-20 | 8.37e-01 | 0.0674 |
| 9518 | GDF15 | HTA11_6818_2000001011 | Human | Colorectum | AD | 4.38e-13 | 1.29e+00 | 0.0112 |
| Page: 1 2 3 4 5 6 7 8 |
| Tissue | Expression Dynamics | Abbreviation |
| Breast | 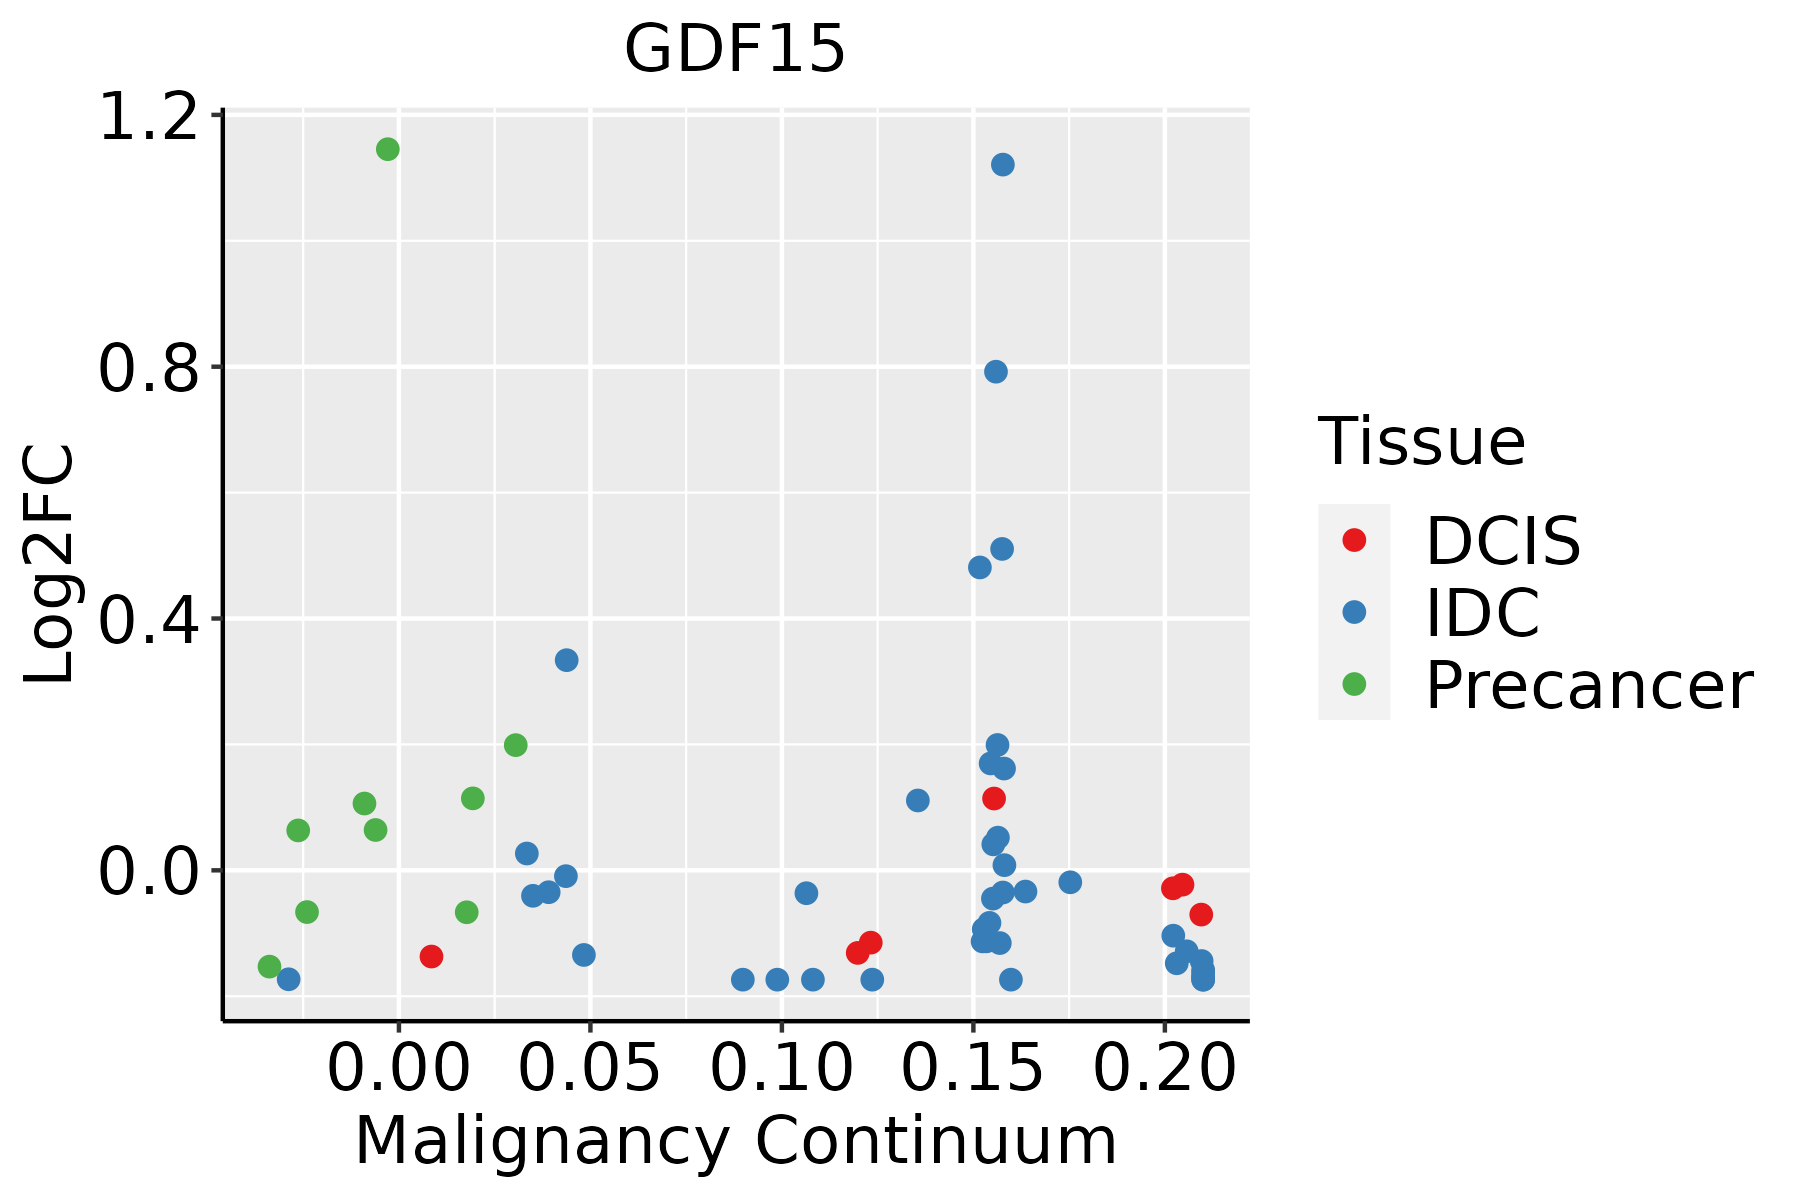 | IDC: Invasive ductal carcinoma |
| DCIS: Ductal carcinoma in situ | ||
| Precancer(BRCA1-mut): Precancerous lesion from BRCA1 mutation carriers | ||
| Colorectum (GSE201348) |  | FAP: Familial adenomatous polyposis |
| CRC: Colorectal cancer | ||
| Colorectum (HTA11) |  | AD: Adenomas |
| SER: Sessile serrated lesions | ||
| MSI-H: Microsatellite-high colorectal cancer | ||
| MSS: Microsatellite stable colorectal cancer | ||
| Endometrium |  | AEH: Atypical endometrial hyperplasia |
| EEC: Endometrioid Cancer | ||
| Esophagus |  | ESCC: Esophageal squamous cell carcinoma |
| HGIN: High-grade intraepithelial neoplasias | ||
| LGIN: Low-grade intraepithelial neoplasias | ||
| GC | 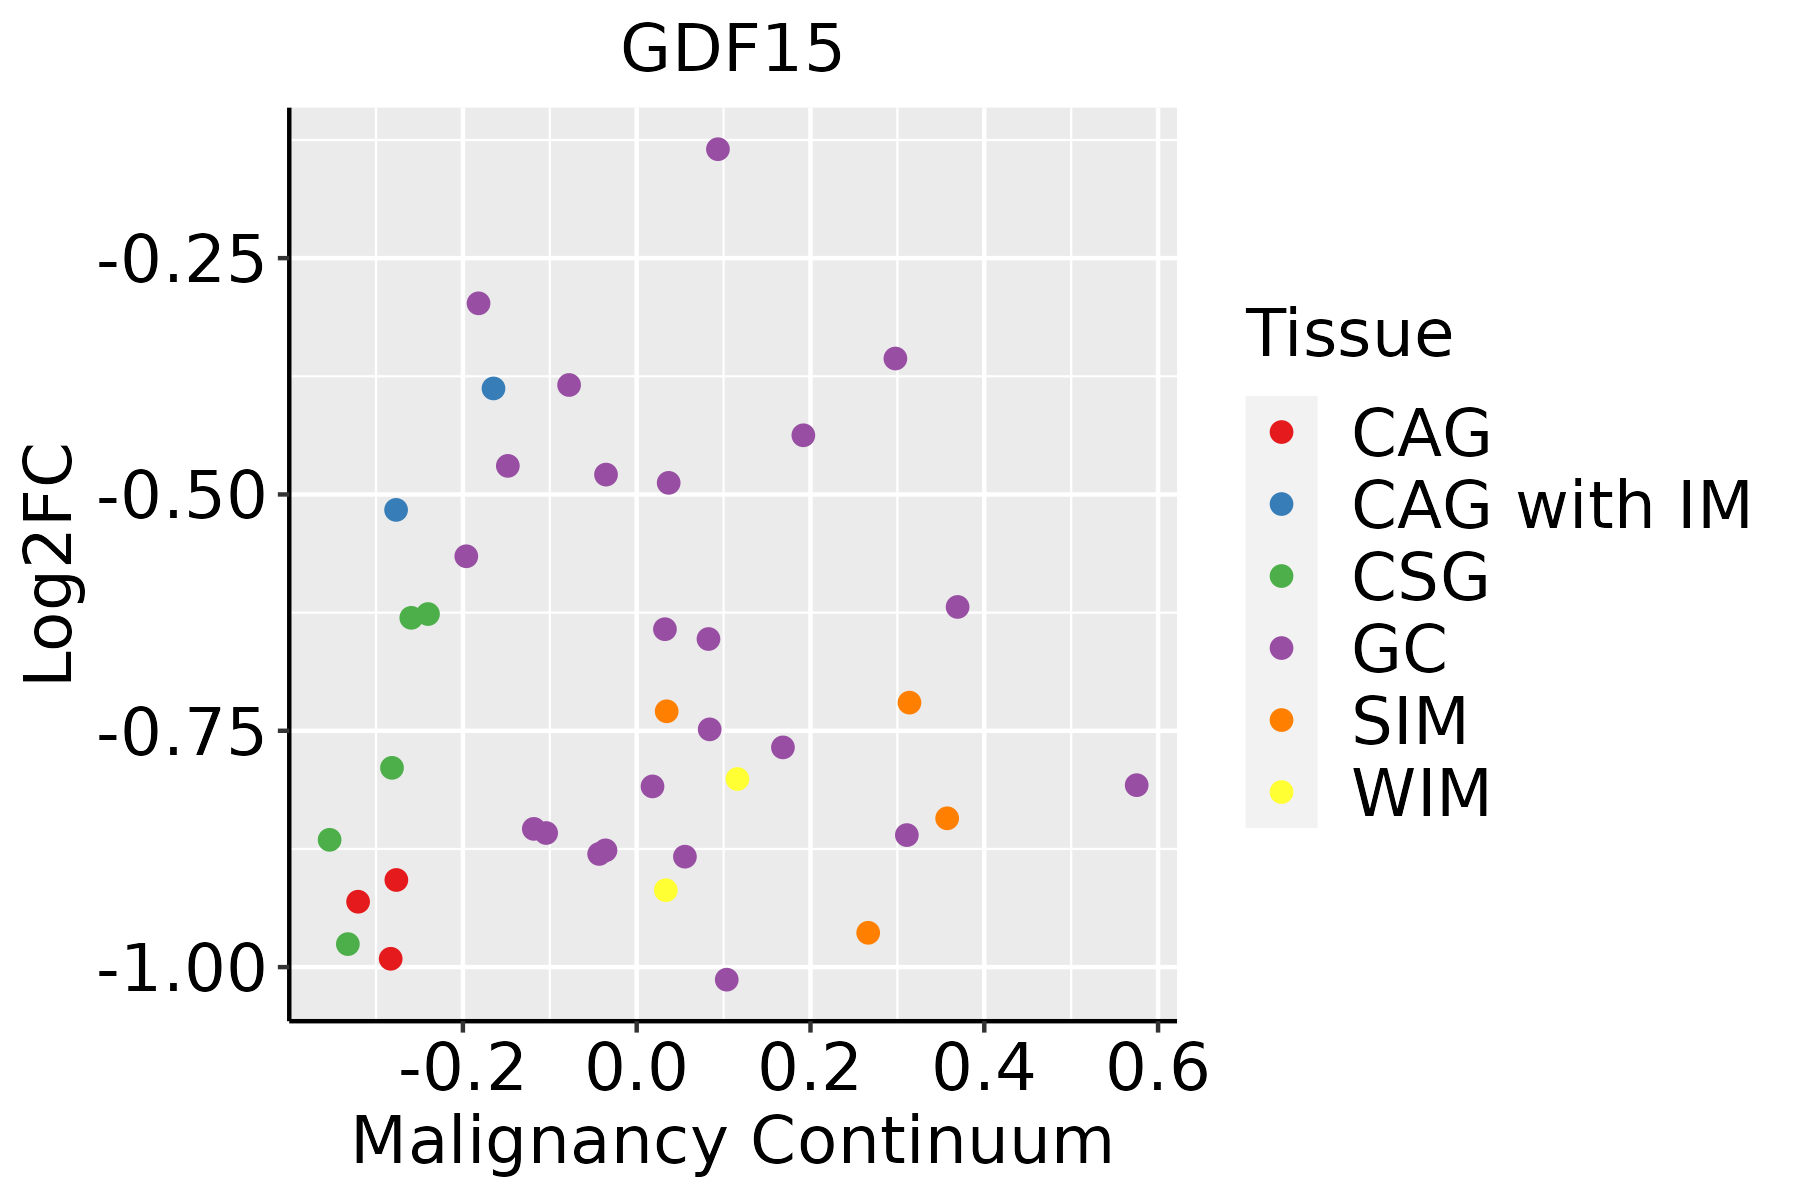 | CAG: Chronic atrophic gastritis |
| CAG with IM: Chronic atrophic gastritis with intestinal metaplasia | ||
| CSG: Chronic superficial gastritis | ||
| GC: Gastric cancer | ||
| SIM: Severe intestinal metaplasia | ||
| WIM: Wild intestinal metaplasia | ||
| Liver | 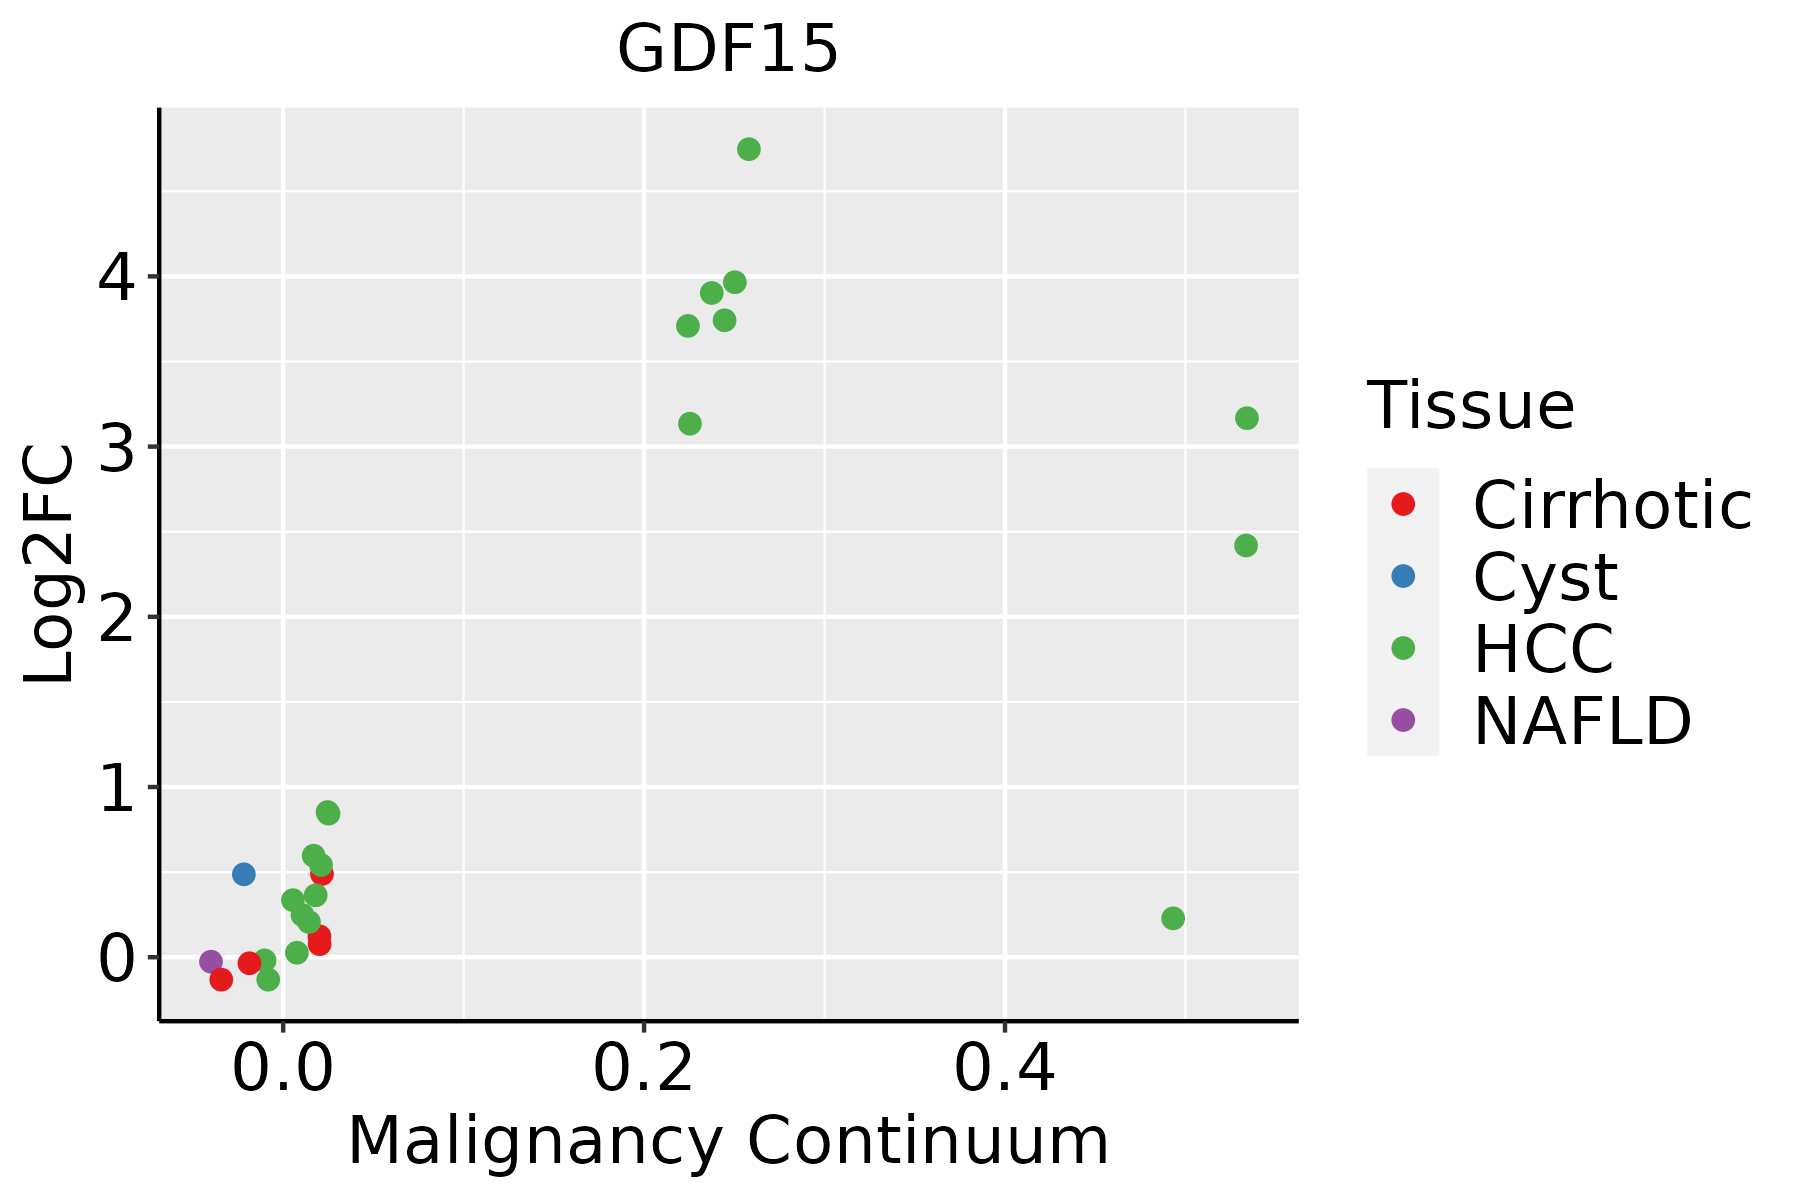 | HCC: Hepatocellular carcinoma |
| NAFLD: Non-alcoholic fatty liver disease | ||
| Lung | 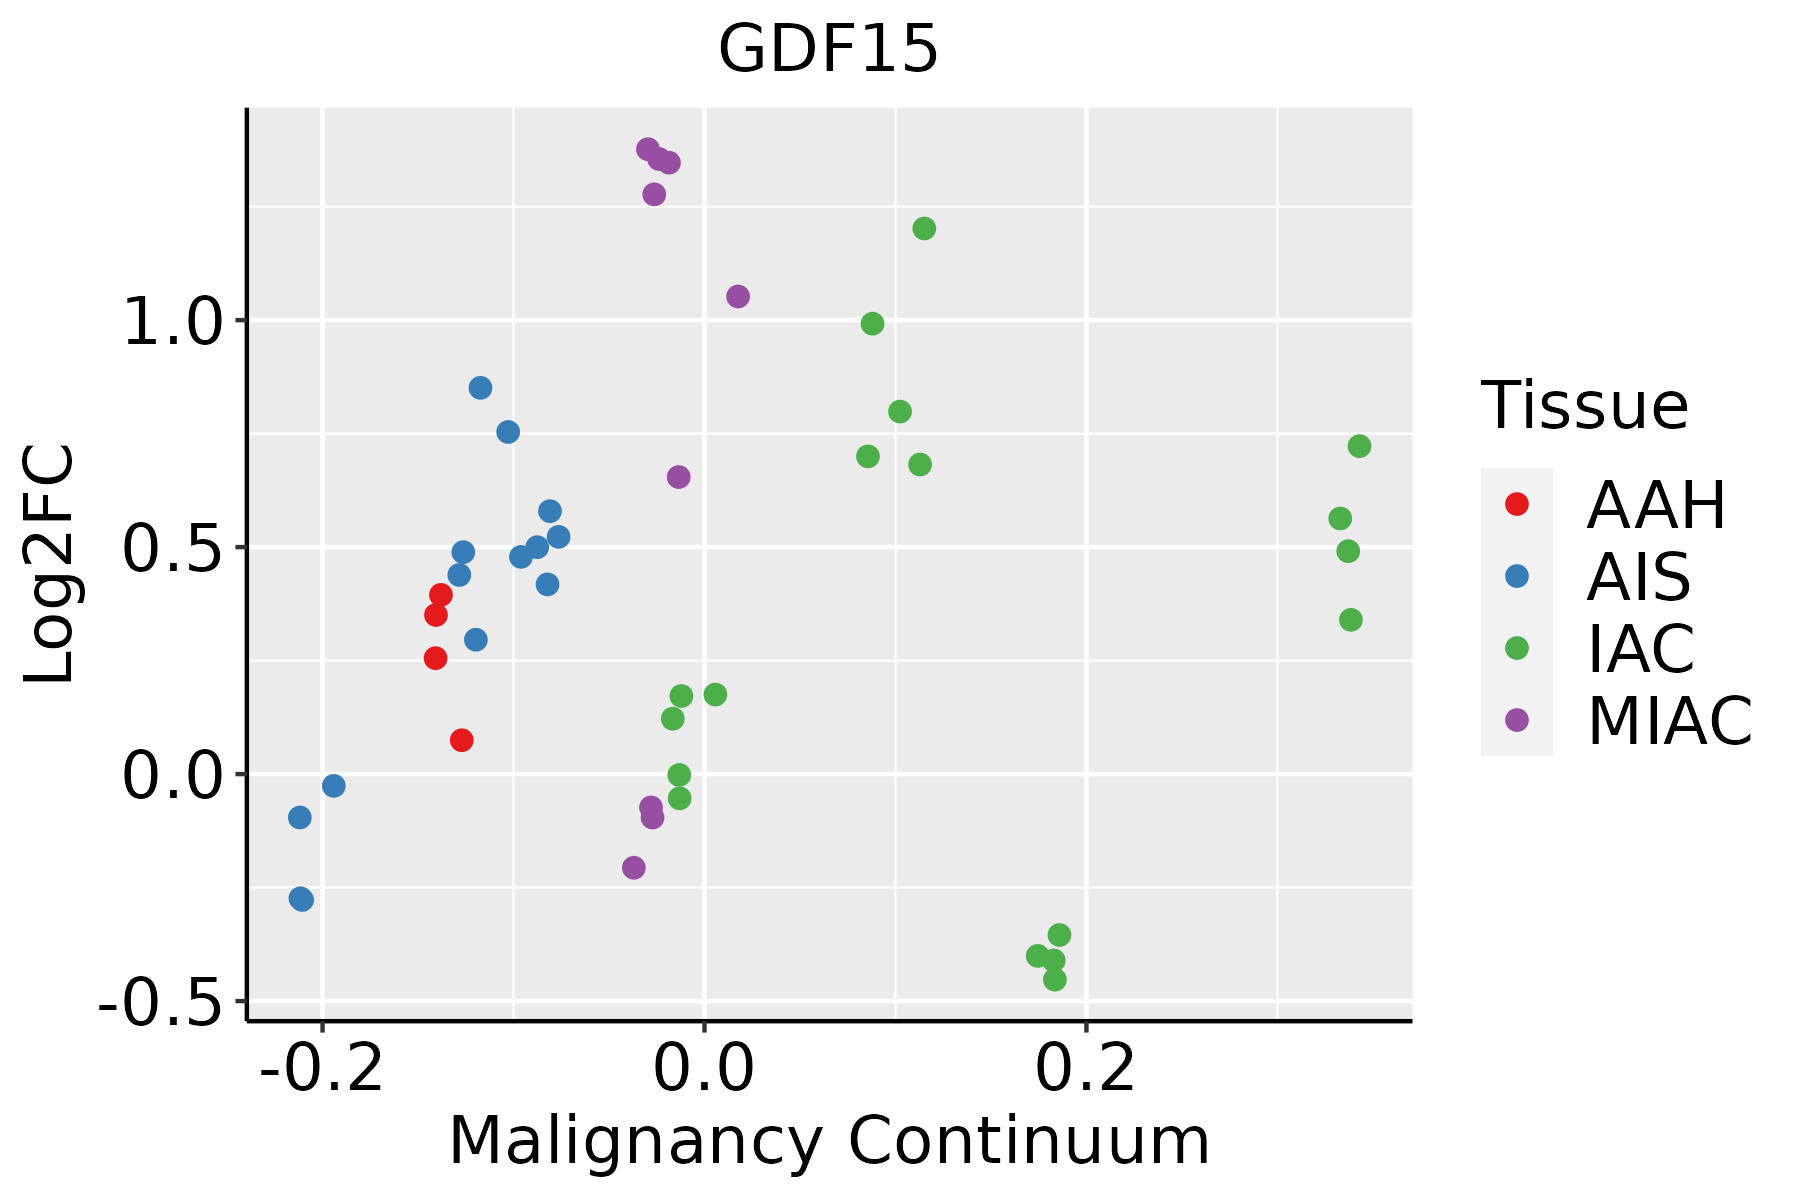 | AAH: Atypical adenomatous hyperplasia |
| AIS: Adenocarcinoma in situ | ||
| IAC: Invasive lung adenocarcinoma | ||
| MIA: Minimally invasive adenocarcinoma | ||
| Oral Cavity |  | EOLP: Erosive Oral lichen planus |
| LP: leukoplakia | ||
| NEOLP: Non-erosive oral lichen planus | ||
| OSCC: Oral squamous cell carcinoma | ||
| Prostate | 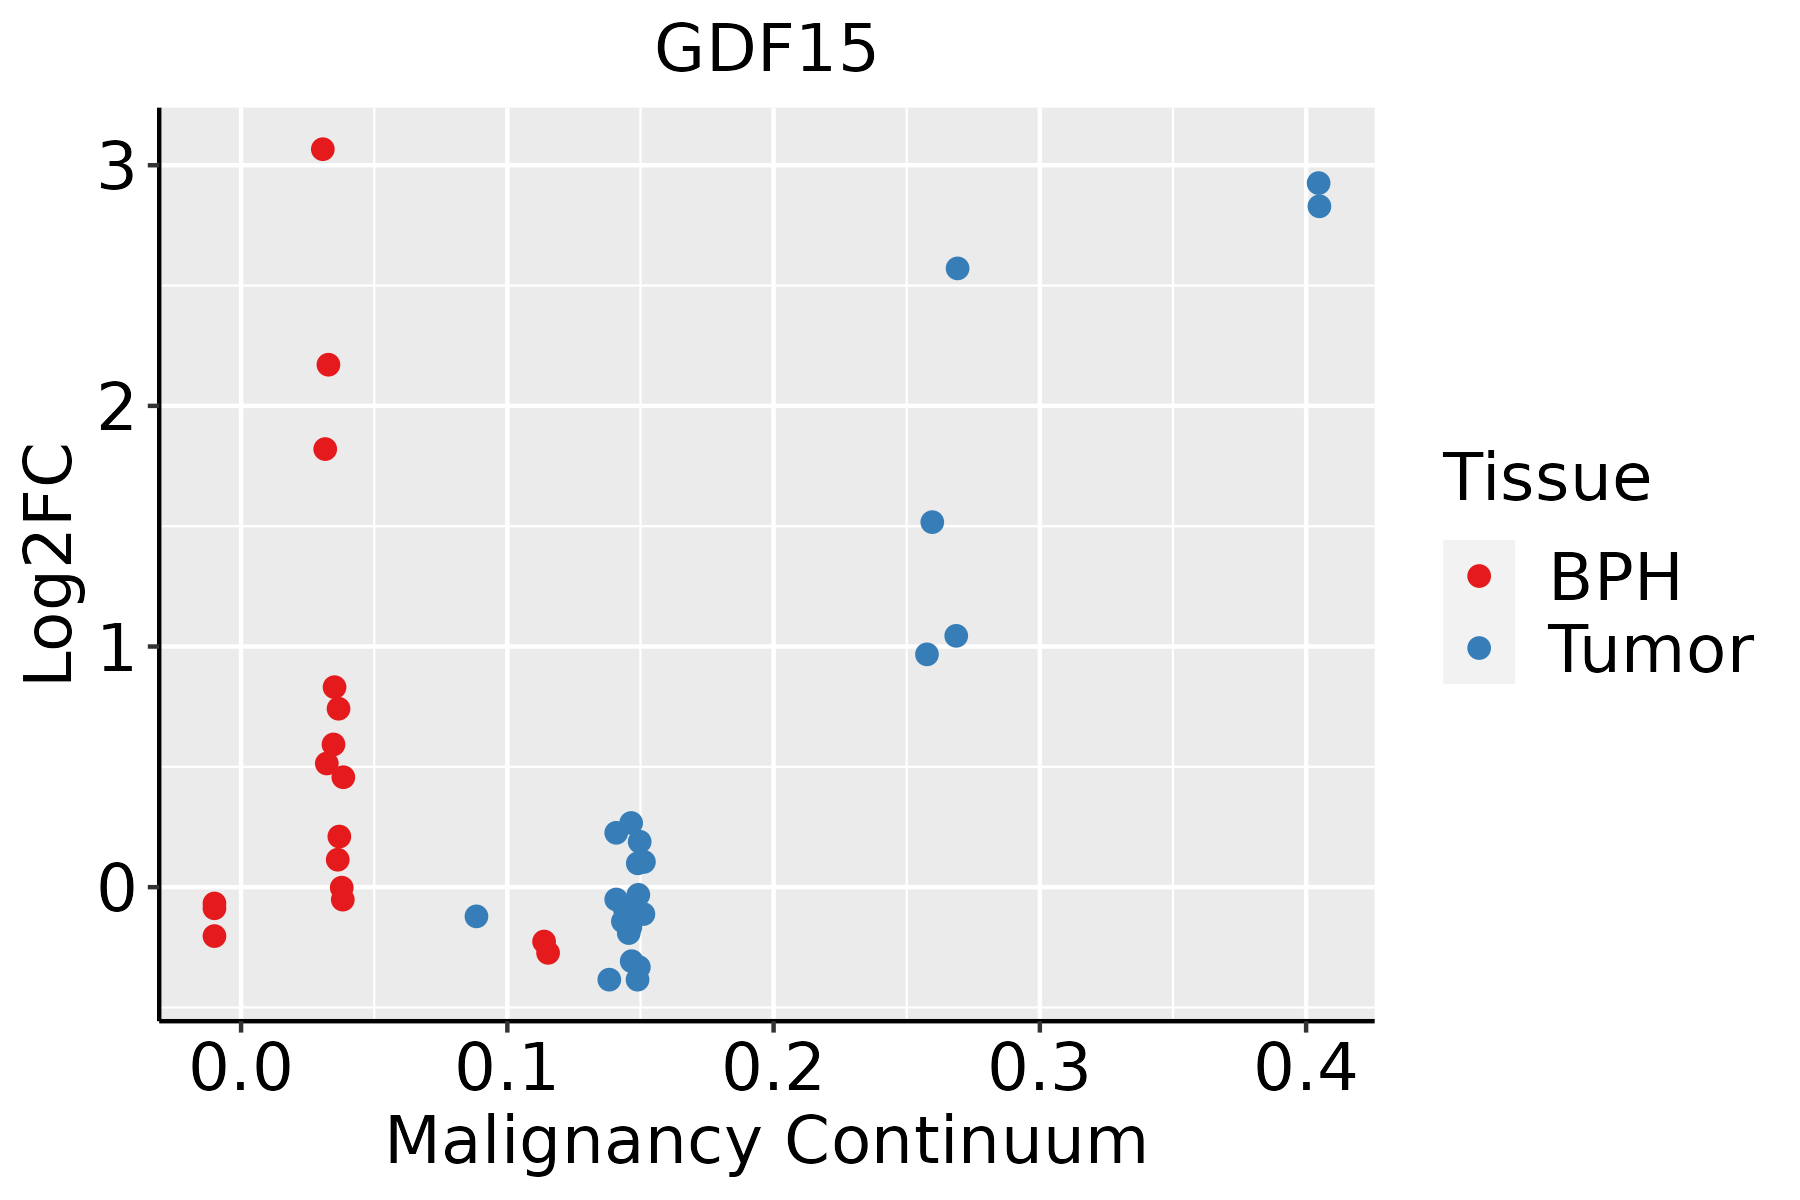 | BPH: Benign Prostatic Hyperplasia |
| Thyroid |  | ATC: Anaplastic thyroid cancer |
| HT: Hashimoto's thyroiditis | ||
| PTC: Papillary thyroid cancer |
| ∗log2FC in expression of this searched gene in stem-like cells from each diseased tissue sample relative to stem-like cells in normal samples in each tissue plotted against the malignancy continuum. Samples are colored based on if they are from different disease stage. |
Top |
Malignant transformation related pathway analysis |
| Find out the enriched GO biological processes and KEGG pathways involved in transition from healthy to precancer to cancer |
| Tissue | Disease Stage | Enriched GO biological Processes |
| Colorectum | AD |  |
| Colorectum | SER |  |
| Colorectum | MSS |  |
| Colorectum | MSI-H |  |
| Colorectum | FAP |  |
| ∗Top 15 enriched GO BP terms are showed in the bar plot of each disease state in each tissue. Each row represents a significant GO biological process which is colored according to the -log10(p.adjust). |
| Page: 1 2 3 4 5 6 7 8 9 |
| GO ID | Tissue | Disease Stage | Description | Gene Ratio | Bg Ratio | pvalue | p.adjust | Count |
| GO:00316679 | Breast | Precancer | response to nutrient levels | 47/1080 | 474/18723 | 2.09e-04 | 3.27e-03 | 47 |
| GO:00434912 | Breast | Precancer | protein kinase B signaling | 23/1080 | 211/18723 | 2.53e-03 | 2.30e-02 | 23 |
| GO:003166714 | Breast | IDC | response to nutrient levels | 62/1434 | 474/18723 | 2.33e-05 | 5.57e-04 | 62 |
| GO:00434348 | Breast | IDC | response to peptide hormone | 54/1434 | 414/18723 | 8.25e-05 | 1.61e-03 | 54 |
| GO:00426923 | Breast | IDC | muscle cell differentiation | 44/1434 | 384/18723 | 4.77e-03 | 3.66e-02 | 44 |
| GO:004349111 | Breast | IDC | protein kinase B signaling | 27/1434 | 211/18723 | 5.92e-03 | 4.26e-02 | 27 |
| GO:00511463 | Breast | IDC | striated muscle cell differentiation | 34/1434 | 283/18723 | 6.00e-03 | 4.31e-02 | 34 |
| GO:1901653 | Colorectum | AD | cellular response to peptide | 114/3918 | 359/18723 | 8.32e-07 | 2.88e-05 | 114 |
| GO:0071375 | Colorectum | AD | cellular response to peptide hormone stimulus | 95/3918 | 290/18723 | 1.50e-06 | 4.66e-05 | 95 |
| GO:0043434 | Colorectum | AD | response to peptide hormone | 126/3918 | 414/18723 | 2.70e-06 | 7.86e-05 | 126 |
| GO:0031667 | Colorectum | AD | response to nutrient levels | 138/3918 | 474/18723 | 1.22e-05 | 2.68e-04 | 138 |
| GO:0007178 | Colorectum | AD | transmembrane receptor protein serine/threonine kinase signaling pathway | 99/3918 | 355/18723 | 9.92e-04 | 9.28e-03 | 99 |
| GO:0071559 | Colorectum | AD | response to transforming growth factor beta | 74/3918 | 256/18723 | 1.45e-03 | 1.23e-02 | 74 |
| GO:0048638 | Colorectum | AD | regulation of developmental growth | 92/3918 | 330/18723 | 1.48e-03 | 1.25e-02 | 92 |
| GO:0071560 | Colorectum | AD | cellular response to transforming growth factor beta stimulus | 72/3918 | 250/18723 | 1.85e-03 | 1.52e-02 | 72 |
| GO:0007179 | Colorectum | AD | transforming growth factor beta receptor signaling pathway | 59/3918 | 198/18723 | 1.94e-03 | 1.58e-02 | 59 |
| GO:0060395 | Colorectum | AD | SMAD protein signal transduction | 28/3918 | 82/18723 | 3.73e-03 | 2.63e-02 | 28 |
| GO:0045926 | Colorectum | AD | negative regulation of growth | 70/3918 | 249/18723 | 4.07e-03 | 2.83e-02 | 70 |
| GO:00316671 | Colorectum | SER | response to nutrient levels | 106/2897 | 474/18723 | 3.94e-05 | 1.00e-03 | 106 |
| GO:19016531 | Colorectum | SER | cellular response to peptide | 83/2897 | 359/18723 | 8.03e-05 | 1.77e-03 | 83 |
| Page: 1 2 3 4 5 6 7 8 9 10 11 12 |
| Pathway ID | Tissue | Disease Stage | Description | Gene Ratio | Bg Ratio | pvalue | p.adjust | qvalue | Count |
| Page: 1 |
Top |
Cell-cell communication analysis |
| Identification of potential cell-cell interactions between two cell types and their ligand-receptor pairs for different disease states |
| Ligand | Receptor | LRpair | Pathway | Tissue | Disease Stage |
| GDF15 | TGFBR2 | GDF15_TGFBR2 | GDF | Breast | ADJ |
| GDF15 | TGFBR2 | GDF15_TGFBR2 | GDF | Breast | Healthy |
| GDF15 | TGFBR2 | GDF15_TGFBR2 | GDF | Breast | Precancer |
| GDF15 | TGFBR2 | GDF15_TGFBR2 | GDF | CRC | AD |
| GDF15 | TGFBR2 | GDF15_TGFBR2 | GDF | CRC | MSI-H |
| GDF15 | TGFBR2 | GDF15_TGFBR2 | GDF | CRC | MSS |
| GDF15 | TGFBR2 | GDF15_TGFBR2 | GDF | Endometrium | AEH |
| GDF15 | TGFBR2 | GDF15_TGFBR2 | GDF | Endometrium | EEC |
| GDF15 | TGFBR2 | GDF15_TGFBR2 | GDF | Endometrium | Healthy |
| GDF15 | TGFBR2 | GDF15_TGFBR2 | GDF | Esophagus | ESCC |
| GDF15 | TGFBR2 | GDF15_TGFBR2 | GDF | GC | Healthy |
| GDF15 | TGFBR2 | GDF15_TGFBR2 | GDF | HNSCC | ADJ |
| GDF15 | TGFBR2 | GDF15_TGFBR2 | GDF | Liver | HCC |
| GDF15 | TGFBR2 | GDF15_TGFBR2 | GDF | Liver | Precancer |
| GDF15 | TGFBR2 | GDF15_TGFBR2 | GDF | Lung | AAH |
| GDF15 | TGFBR2 | GDF15_TGFBR2 | GDF | Lung | ADJ |
| GDF15 | TGFBR2 | GDF15_TGFBR2 | GDF | Lung | AIS |
| GDF15 | TGFBR2 | GDF15_TGFBR2 | GDF | Lung | IAC |
| GDF15 | TGFBR2 | GDF15_TGFBR2 | GDF | Lung | MIAC |
| GDF15 | TGFBR2 | GDF15_TGFBR2 | GDF | Lung | Precancer |
| Page: 1 2 |
Top |
Single-cell gene regulatory network inference analysis |
| Find out the significant the regulons (TFs) and the target genes of each regulon across cell types for different disease states |
| TF | Cell Type | Tissue | Disease Stage | Target Gene | RSS | Regulon Activity |
| ∗The dot plots of a searched regulon are shown for all cell subpopulations in each disease state of each tissue based on the regulon specific score inferred using pySCENIC and by calculating the average expression. |
| Page: 1 |
Top |
Somatic mutation of malignant transformation related genes |
| Annotation of somatic variants for genes involved in malignant transformation |
| Hugo Symbol | Variant Class | Variant Classification | dbSNP RS | HGVSc | HGVSp | HGVSp Short | SWISSPROT | BIOTYPE | SIFT | PolyPhen | Tumor Sample Barcode | Tissue | Histology | Sex | Age | Stage | Therapy Types | Drugs | Outcome |
| GDF15 | SNV | Missense_Mutation | novel | c.364N>T | p.Arg122Trp | p.R122W | Q99988 | protein_coding | deleterious(0) | probably_damaging(0.969) | TCGA-2W-A8YY-01 | Cervix | cervical & endocervical cancer | Female | <65 | I/II | Chemotherapy | cisplatin | CR |
| GDF15 | SNV | Missense_Mutation | novel | c.155G>T | p.Arg52Ile | p.R52I | Q99988 | protein_coding | deleterious(0.01) | possibly_damaging(0.601) | TCGA-AA-A010-01 | Colorectum | colon adenocarcinoma | Female | <65 | I/II | Chemotherapy | folinic | CR |
| GDF15 | SNV | Missense_Mutation | c.650N>A | p.Arg217His | p.R217H | Q99988 | protein_coding | deleterious(0.03) | benign(0.001) | TCGA-CM-6674-01 | Colorectum | colon adenocarcinoma | Male | <65 | I/II | Unknown | Unknown | SD | |
| GDF15 | SNV | Missense_Mutation | rs114827523 | c.269C>T | p.Thr90Met | p.T90M | Q99988 | protein_coding | deleterious(0.04) | probably_damaging(0.931) | TCGA-D5-6931-01 | Colorectum | colon adenocarcinoma | Male | >=65 | III/IV | Unknown | Unknown | SD |
| GDF15 | SNV | Missense_Mutation | c.16N>A | p.Leu6Ile | p.L6I | Q99988 | protein_coding | tolerated_low_confidence(0.28) | benign(0.014) | TCGA-DC-5337-01 | Colorectum | rectum adenocarcinoma | Male | >=65 | I/II | Unknown | Unknown | SD | |
| GDF15 | SNV | Missense_Mutation | novel | c.251N>A | p.Pro84His | p.P84H | Q99988 | protein_coding | deleterious(0) | possibly_damaging(0.536) | TCGA-A5-A1OF-01 | Endometrium | uterine corpus endometrioid carcinoma | Female | <65 | I/II | Unknown | Unknown | SD |
| GDF15 | SNV | Missense_Mutation | rs753270463 | c.145G>A | p.Glu49Lys | p.E49K | Q99988 | protein_coding | tolerated(0.18) | benign(0.024) | TCGA-EO-A22U-01 | Endometrium | uterine corpus endometrioid carcinoma | Female | >=65 | I/II | Unknown | Unknown | SD |
| GDF15 | SNV | Missense_Mutation | novel | c.756C>A | p.Asn252Lys | p.N252K | Q99988 | protein_coding | tolerated(0.06) | possibly_damaging(0.87) | TCGA-05-4244-01 | Lung | lung adenocarcinoma | Male | >=65 | III/IV | Unknown | Unknown | SD |
| GDF15 | SNV | Missense_Mutation | novel | c.292N>T | p.Gly98Cys | p.G98C | Q99988 | protein_coding | deleterious(0.02) | possibly_damaging(0.867) | TCGA-78-7535-01 | Lung | lung adenocarcinoma | Male | <65 | I/II | Chemotherapy | vinblastine | PD |
| GDF15 | SNV | Missense_Mutation | novel | c.334N>A | p.Glu112Lys | p.E112K | Q99988 | protein_coding | tolerated(0.64) | benign(0) | TCGA-91-6830-01 | Lung | lung adenocarcinoma | Female | >=65 | I/II | Unknown | Unknown | PD |
| Page: 1 2 |
Top |
Related drugs of malignant transformation related genes |
| Identification of chemicals and drugs interact with genes involved in malignant transfromation |
| (DGIdb 4.0) |
| Entrez ID | Symbol | Category | Interaction Types | Drug Claim Name | Drug Name | PMIDs |
| 9518 | GDF15 | TRANSCRIPTION FACTOR, DRUGGABLE GENOME, GROWTH FACTOR | NSAIDS | 15509713 | ||
| 9518 | GDF15 | TRANSCRIPTION FACTOR, DRUGGABLE GENOME, GROWTH FACTOR | RESVERATROL | RESVERATROL | 11895857 | |
| 9518 | GDF15 | TRANSCRIPTION FACTOR, DRUGGABLE GENOME, GROWTH FACTOR | CALCITRIOL | CALCITRIOL | 15386353 | |
| 9518 | GDF15 | TRANSCRIPTION FACTOR, DRUGGABLE GENOME, GROWTH FACTOR | ETOPOSIDE | ETOPOSIDE | 10618379 | |
| 9518 | GDF15 | TRANSCRIPTION FACTOR, DRUGGABLE GENOME, GROWTH FACTOR | DICLOFENAC | DICLOFENAC | 15555568 | |
| 9518 | GDF15 | TRANSCRIPTION FACTOR, DRUGGABLE GENOME, GROWTH FACTOR | INDOLE-3-CARBINOL | INDOLE-3-CARBINOL | 15670751 | |
| 9518 | GDF15 | TRANSCRIPTION FACTOR, DRUGGABLE GENOME, GROWTH FACTOR | SULINDAC SULFIDE | 15180942 |
| Page: 1 |

Copyright 2023-Present -The University of Texas Health Science Center at Houston |