
|
|||||
|
 | |
| |
| |
| |
| |
| |
|
Gene: GDF11 |
Gene summary for GDF11 |
| Gene information | Species | Human | Gene symbol | GDF11 | Gene ID | 10220 |
| Gene name | growth differentiation factor 11 | |
| Gene Alias | BMP-11 | |
| Cytomap | 12q13.2 | |
| Gene Type | protein-coding | GO ID | GO:0001501 | UniProtAcc | A0A024RB20 |
Top |
Malignant transformation analysis |
| Identification of the aberrant gene expression in precancerous and cancerous lesions by comparing the gene expression of stem-like cells in diseased tissues with normal stem cells |
| Entrez ID | Symbol | Replicates | Species | Organ | Tissue | Adj P-value | Log2FC | Malignancy |
| 10220 | GDF11 | male-WTA | Human | Thyroid | PTC | 1.25e-10 | 3.53e-02 | 0.1037 |
| 10220 | GDF11 | PTC01 | Human | Thyroid | PTC | 1.62e-10 | 6.50e-02 | 0.1899 |
| 10220 | GDF11 | PTC04 | Human | Thyroid | PTC | 2.43e-04 | 3.06e-02 | 0.1927 |
| 10220 | GDF11 | PTC05 | Human | Thyroid | PTC | 6.06e-04 | 1.33e-01 | 0.2065 |
| 10220 | GDF11 | PTC06 | Human | Thyroid | PTC | 2.50e-10 | 1.27e-01 | 0.2057 |
| 10220 | GDF11 | PTC07 | Human | Thyroid | PTC | 2.24e-12 | 1.01e-01 | 0.2044 |
| 10220 | GDF11 | ATC12 | Human | Thyroid | ATC | 2.11e-10 | 1.14e-01 | 0.34 |
| 10220 | GDF11 | ATC13 | Human | Thyroid | ATC | 9.39e-76 | 1.33e+00 | 0.34 |
| 10220 | GDF11 | ATC1 | Human | Thyroid | ATC | 1.25e-02 | 2.21e-01 | 0.2878 |
| 10220 | GDF11 | ATC4 | Human | Thyroid | ATC | 3.04e-12 | 1.46e-01 | 0.34 |
| 10220 | GDF11 | ATC5 | Human | Thyroid | ATC | 3.62e-74 | 1.41e+00 | 0.34 |
| Page: 1 |
| Tissue | Expression Dynamics | Abbreviation |
| Thyroid | 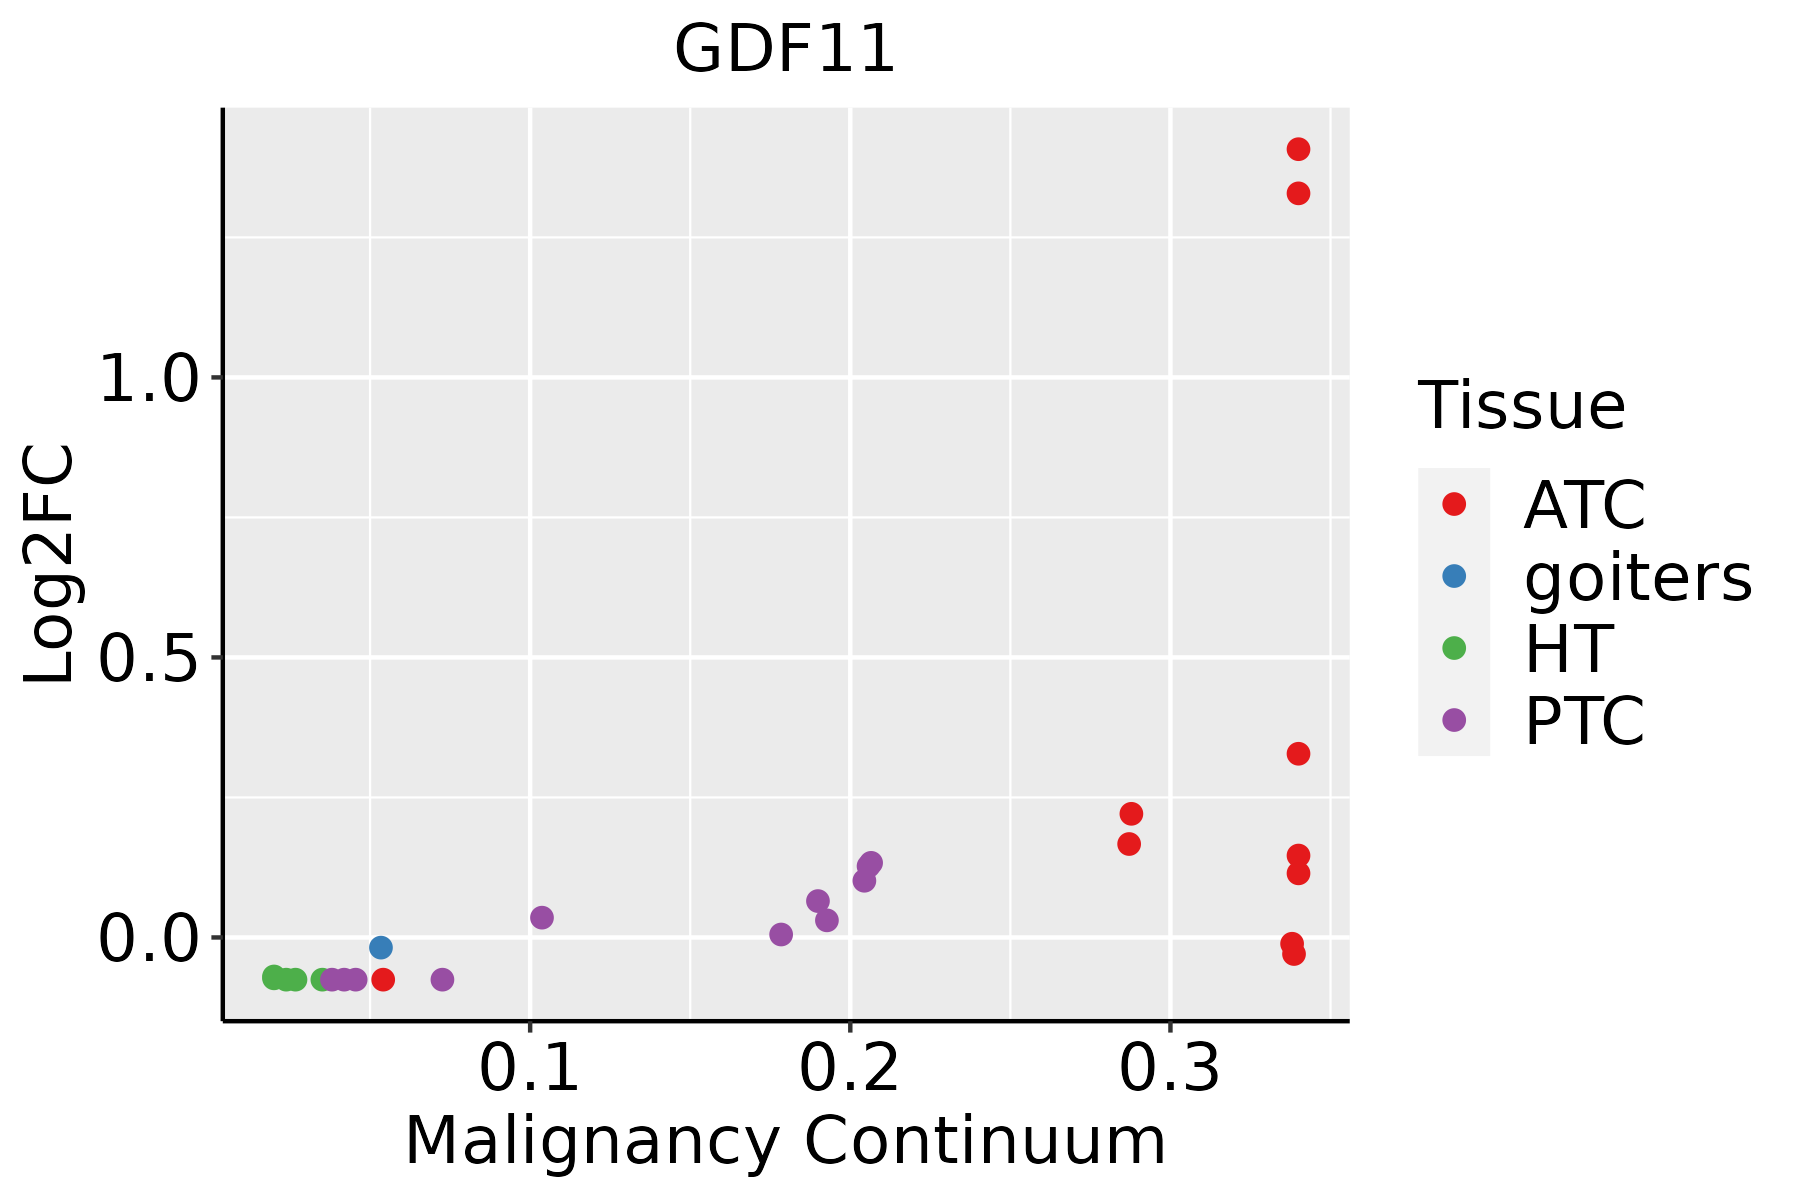 | ATC: Anaplastic thyroid cancer |
| HT: Hashimoto's thyroiditis | ||
| PTC: Papillary thyroid cancer |
| ∗log2FC in expression of this searched gene in stem-like cells from each diseased tissue sample relative to stem-like cells in normal samples in each tissue plotted against the malignancy continuum. Samples are colored based on if they are from different disease stage. |
Top |
Malignant transformation related pathway analysis |
| Find out the enriched GO biological processes and KEGG pathways involved in transition from healthy to precancer to cancer |
| Tissue | Disease Stage | Enriched GO biological Processes |
| Colorectum | AD |  |
| Colorectum | SER |  |
| Colorectum | MSS |  |
| Colorectum | MSI-H |  |
| Colorectum | FAP |  |
| ∗Top 15 enriched GO BP terms are showed in the bar plot of each disease state in each tissue. Each row represents a significant GO biological process which is colored according to the -log10(p.adjust). |
| Page: 1 2 3 4 5 6 7 8 9 |
| GO ID | Tissue | Disease Stage | Description | Gene Ratio | Bg Ratio | pvalue | p.adjust | Count |
| GO:000717819 | Thyroid | PTC | transmembrane receptor protein serine/threonine kinase signaling pathway | 156/5968 | 355/18723 | 1.02e-06 | 1.51e-05 | 156 |
| GO:00900925 | Thyroid | PTC | regulation of transmembrane receptor protein serine/threonine kinase signaling pathway | 108/5968 | 256/18723 | 3.07e-04 | 2.14e-03 | 108 |
| GO:000717823 | Thyroid | ATC | transmembrane receptor protein serine/threonine kinase signaling pathway | 170/6293 | 355/18723 | 1.40e-08 | 2.87e-07 | 170 |
| GO:009009214 | Thyroid | ATC | regulation of transmembrane receptor protein serine/threonine kinase signaling pathway | 120/6293 | 256/18723 | 6.62e-06 | 6.85e-05 | 120 |
| GO:00901001 | Thyroid | ATC | positive regulation of transmembrane receptor protein serine/threonine kinase signaling pathway | 51/6293 | 114/18723 | 8.62e-03 | 3.28e-02 | 51 |
| Page: 1 |
| Pathway ID | Tissue | Disease Stage | Description | Gene Ratio | Bg Ratio | pvalue | p.adjust | qvalue | Count |
| Page: 1 |
Top |
Cell-cell communication analysis |
| Identification of potential cell-cell interactions between two cell types and their ligand-receptor pairs for different disease states |
| Ligand | Receptor | LRpair | Pathway | Tissue | Disease Stage |
| GDF11 | TGFBR1_ACVR2A | GDF11_TGFBR1_ACVR2A | GDF | THCA | Cancer |
| Page: 1 |
Top |
Single-cell gene regulatory network inference analysis |
| Find out the significant the regulons (TFs) and the target genes of each regulon across cell types for different disease states |
| TF | Cell Type | Tissue | Disease Stage | Target Gene | RSS | Regulon Activity |
| ∗The dot plots of a searched regulon are shown for all cell subpopulations in each disease state of each tissue based on the regulon specific score inferred using pySCENIC and by calculating the average expression. |
| Page: 1 |
Top |
Somatic mutation of malignant transformation related genes |
| Annotation of somatic variants for genes involved in malignant transformation |
| Hugo Symbol | Variant Class | Variant Classification | dbSNP RS | HGVSc | HGVSp | HGVSp Short | SWISSPROT | BIOTYPE | SIFT | PolyPhen | Tumor Sample Barcode | Tissue | Histology | Sex | Age | Stage | Therapy Types | Drugs | Outcome |
| GDF11 | SNV | Missense_Mutation | novel | c.901G>A | p.Gly301Ser | p.G301S | O95390 | protein_coding | tolerated(0.05) | possibly_damaging(0.748) | TCGA-3C-AALJ-01 | Breast | breast invasive carcinoma | Female | <65 | I/II | Chemotherapy | doxorubicin | SD |
| GDF11 | SNV | Missense_Mutation | c.252N>C | p.Leu84Phe | p.L84F | O95390 | protein_coding | deleterious(0) | probably_damaging(0.999) | TCGA-EK-A3GK-01 | Cervix | cervical & endocervical cancer | Female | <65 | I/II | Unknown | Unknown | SD | |
| GDF11 | SNV | Missense_Mutation | c.557C>T | p.Pro186Leu | p.P186L | O95390 | protein_coding | deleterious(0.04) | probably_damaging(0.925) | TCGA-AA-3492-01 | Colorectum | colon adenocarcinoma | Female | >=65 | I/II | Unknown | Unknown | SD | |
| GDF11 | SNV | Missense_Mutation | c.1177T>C | p.Tyr393His | p.Y393H | O95390 | protein_coding | deleterious(0.04) | benign(0.198) | TCGA-AA-3663-01 | Colorectum | colon adenocarcinoma | Male | <65 | I/II | Unknown | Unknown | SD | |
| GDF11 | SNV | Missense_Mutation | c.649C>T | p.Arg217Cys | p.R217C | O95390 | protein_coding | deleterious(0.02) | probably_damaging(0.93) | TCGA-AA-3672-01 | Colorectum | colon adenocarcinoma | Female | >=65 | III/IV | Unknown | Unknown | SD | |
| GDF11 | SNV | Missense_Mutation | c.1087N>T | p.Asn363Tyr | p.N363Y | O95390 | protein_coding | deleterious(0) | possibly_damaging(0.764) | TCGA-AA-3815-01 | Colorectum | colon adenocarcinoma | Female | >=65 | I/II | Unknown | Unknown | SD | |
| GDF11 | SNV | Missense_Mutation | c.1120N>A | p.Pro374Thr | p.P374T | O95390 | protein_coding | deleterious(0) | probably_damaging(0.993) | TCGA-AA-3821-01 | Colorectum | colon adenocarcinoma | Female | >=65 | I/II | Unknown | Unknown | SD | |
| GDF11 | SNV | Missense_Mutation | rs753523328 | c.565C>T | p.Arg189Cys | p.R189C | O95390 | protein_coding | deleterious(0.02) | possibly_damaging(0.86) | TCGA-AJ-A3OK-01 | Endometrium | uterine corpus endometrioid carcinoma | Female | >=65 | I/II | Chemotherapy | carboplatin | CR |
| GDF11 | SNV | Missense_Mutation | rs747619714 | c.1066N>G | p.Thr356Ala | p.T356A | O95390 | protein_coding | tolerated(0.12) | possibly_damaging(0.522) | TCGA-AP-A059-01 | Endometrium | uterine corpus endometrioid carcinoma | Female | >=65 | I/II | Unknown | Unknown | SD |
| GDF11 | SNV | Missense_Mutation | rs761420405 | c.944N>A | p.Arg315Gln | p.R315Q | O95390 | protein_coding | deleterious(0) | probably_damaging(0.998) | TCGA-B5-A11H-01 | Endometrium | uterine corpus endometrioid carcinoma | Female | >=65 | III/IV | Hormone Therapy | megace | SD |
| Page: 1 2 |
Top |
Related drugs of malignant transformation related genes |
| Identification of chemicals and drugs interact with genes involved in malignant transfromation |
| (DGIdb 4.0) |
| Entrez ID | Symbol | Category | Interaction Types | Drug Claim Name | Drug Name | PMIDs |
| Page: 1 |

Copyright 2023-Present -The University of Texas Health Science Center at Houston |