Schematic overview of the cellular and molecular mechanisms involved in the cancer progression, including the proposed cellular and molecular mechanisms in cancer cells trajectory. AT1: alveolar type 1 cells; AT2: alveolar type 2 cells; AAH: atypical adenomatous hyperplasia; AIS: adenocarcinoma in situ; MIA: minimally invasive adenocarcinoma; IA: invasive adenocarcinoma; EMT: epithelial-mesenchymal transition

Home

Download

Statistics

Help

Contact

Center for Computational Systems Medicine
leaf

Gene summary

leaf

Malignant transformation analysis

leaf

Malignant transformation related pathway analysis

leaf

Cell-cell communication analysis

leaf

Single-cell gene regulatory network inference analysis

leaf

Somatic mutation of malignant transformation related genes

leaf

Related drugs of malignant transformation related genes

Gene: GDE1

Gene summary for GDE1

check button Gene summary.

Gene informationSpeciesHuman
Gene symbol

GDE1

Gene ID

51573

Gene nameglycerophosphodiester phosphodiesterase 1
Gene Alias363E6.2
Cytomap16p12.3
Gene Typeprotein-coding
GO ID

GO:0006066

UniProtAcc

A0A024QYU1


Top

Malignant transformation analysis

check button Identification of the aberrant gene expression in precancerous and cancerous lesions by comparing the gene expression of stem-like cells in diseased tissues with normal stem cells
check button Malignant transformation involving gene list.
Entrez IDSymbolReplicatesSpeciesOrganTissueAdj P-valueLog2FCMalignancy
51573GDE1HTA11_2487_2000001011HumanColorectumSER2.24e-054.02e-01-0.1808
51573GDE1HTA11_1938_2000001011HumanColorectumAD2.76e-065.09e-01-0.0811
51573GDE1HTA11_78_2000001011HumanColorectumAD3.18e-023.31e-01-0.1088
51573GDE1HTA11_347_2000001011HumanColorectumAD5.09e-206.31e-01-0.1954
51573GDE1HTA11_2112_2000001011HumanColorectumSER5.57e-078.71e-01-0.2196
51573GDE1HTA11_696_2000001011HumanColorectumAD1.13e-043.36e-01-0.1464
51573GDE1HTA11_866_2000001011HumanColorectumAD3.03e-052.73e-01-0.1001
51573GDE1HTA11_1391_2000001011HumanColorectumAD3.82e-064.64e-01-0.059
51573GDE1HTA11_10623_2000001011HumanColorectumAD2.60e-024.11e-01-0.0177
51573GDE1HTA11_99999965104_69814HumanColorectumMSS3.64e-085.53e-010.281
51573GDE1HTA11_99999971662_82457HumanColorectumMSS1.70e-043.39e-010.3859
51573GDE1A002-C-201HumanColorectumFAP1.13e-03-1.41e-010.0324
51573GDE1A002-C-205HumanColorectumFAP1.42e-02-1.13e-01-0.1236
51573GDE1A015-C-006HumanColorectumFAP1.19e-03-1.66e-01-0.0994
51573GDE1A002-C-114HumanColorectumFAP2.15e-02-1.31e-01-0.1561
51573GDE1A015-C-104HumanColorectumFAP5.13e-03-1.41e-01-0.1899
51573GDE1A001-C-203HumanColorectumFAP2.47e-02-1.20e-01-0.0481
51573GDE1A002-C-116HumanColorectumFAP1.79e-02-1.23e-01-0.0452
51573GDE1A014-C-008HumanColorectumFAP2.99e-03-1.66e-01-0.191
51573GDE1A018-E-020HumanColorectumFAP1.31e-03-1.50e-01-0.2034
Page: 1 2 3 4 5 6 7 

check button Transcriptomic changes along malignancy continuum.
TissueExpression DynamicsAbbreviation
Colorectum (GSE201348)The image shows the transcriptomic changes along malignancy continuum.log2FC in expression of this searched gene in stem-like cells from each diseased tissue sample relative to stem-like cells in normal samples in each tissue plotted against the malignancy continuum. Samples are colored based on if they are from different disease stage.
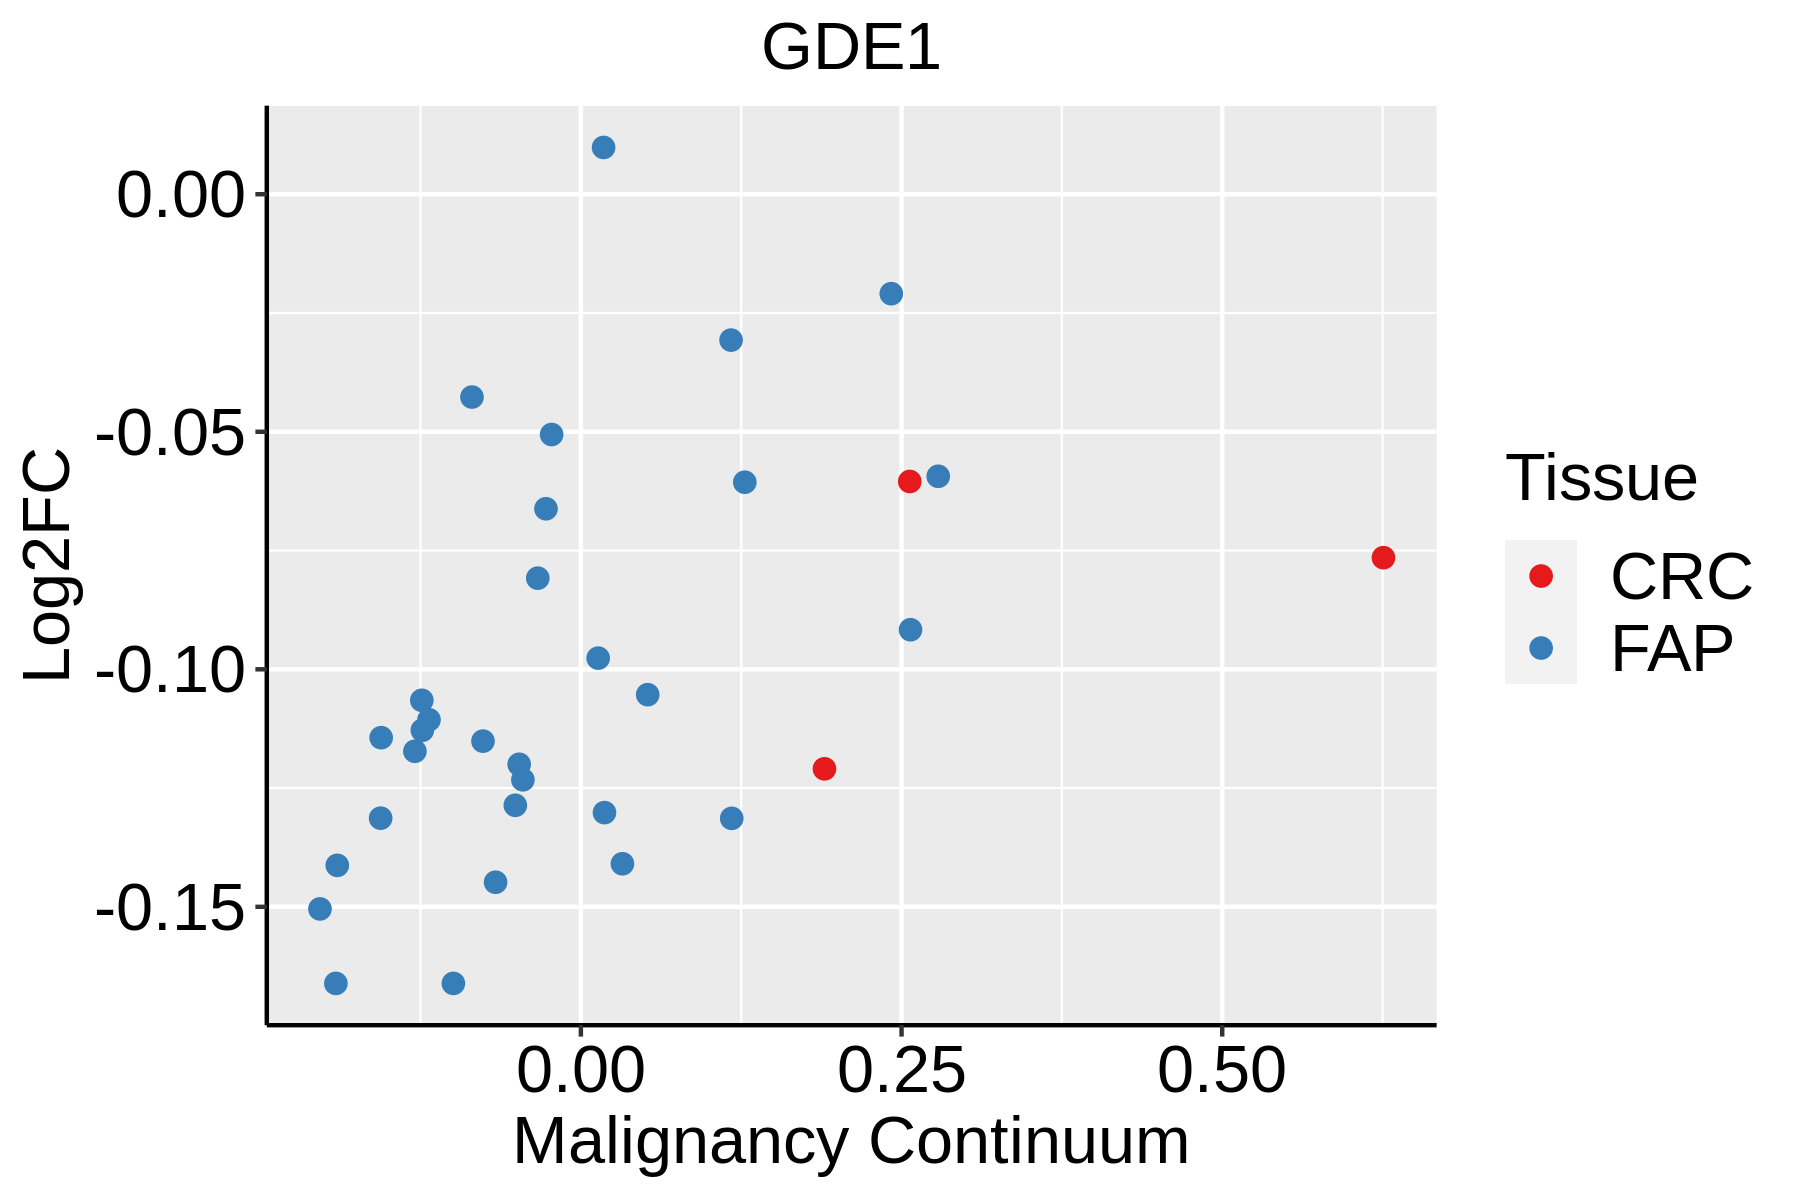
FAP: Familial adenomatous polyposis
CRC: Colorectal cancer
Colorectum (HTA11)The image shows the transcriptomic changes along malignancy continuum.log2FC in expression of this searched gene in stem-like cells from each diseased tissue sample relative to stem-like cells in normal samples in each tissue plotted against the malignancy continuum. Samples are colored based on if they are from different disease stage.AD: Adenomas
SER: Sessile serrated lesions
MSI-H: Microsatellite-high colorectal cancer
MSS: Microsatellite stable colorectal cancer
EsophagusThe image shows the transcriptomic changes along malignancy continuum.log2FC in expression of this searched gene in stem-like cells from each diseased tissue sample relative to stem-like cells in normal samples in each tissue plotted against the malignancy continuum. Samples are colored based on if they are from different disease stage.ESCC: Esophageal squamous cell carcinoma
HGIN: High-grade intraepithelial neoplasias
LGIN: Low-grade intraepithelial neoplasias
LiverThe image shows the transcriptomic changes along malignancy continuum.log2FC in expression of this searched gene in stem-like cells from each diseased tissue sample relative to stem-like cells in normal samples in each tissue plotted against the malignancy continuum. Samples are colored based on if they are from different disease stage.
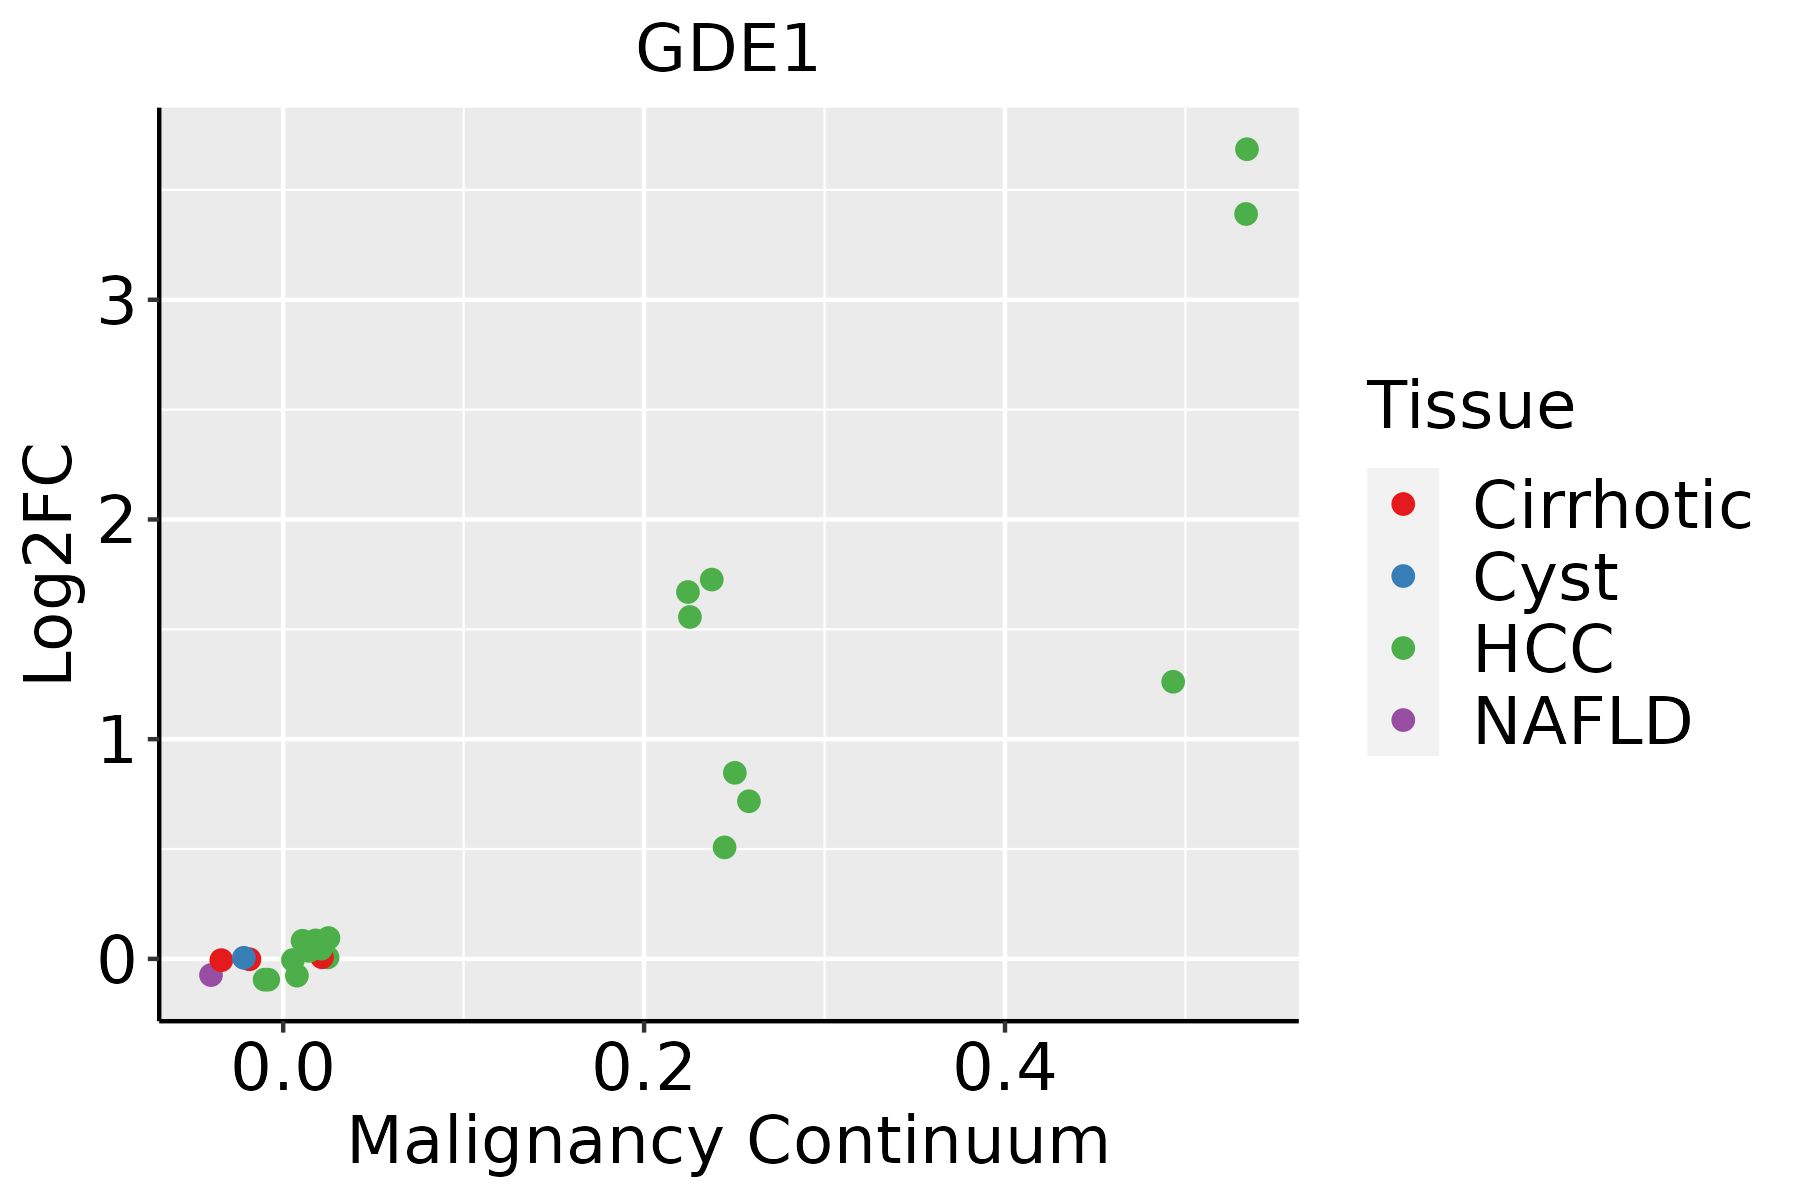
HCC: Hepatocellular carcinoma
NAFLD: Non-alcoholic fatty liver disease
Oral CavityThe image shows the transcriptomic changes along malignancy continuum.log2FC in expression of this searched gene in stem-like cells from each diseased tissue sample relative to stem-like cells in normal samples in each tissue plotted against the malignancy continuum. Samples are colored based on if they are from different disease stage.
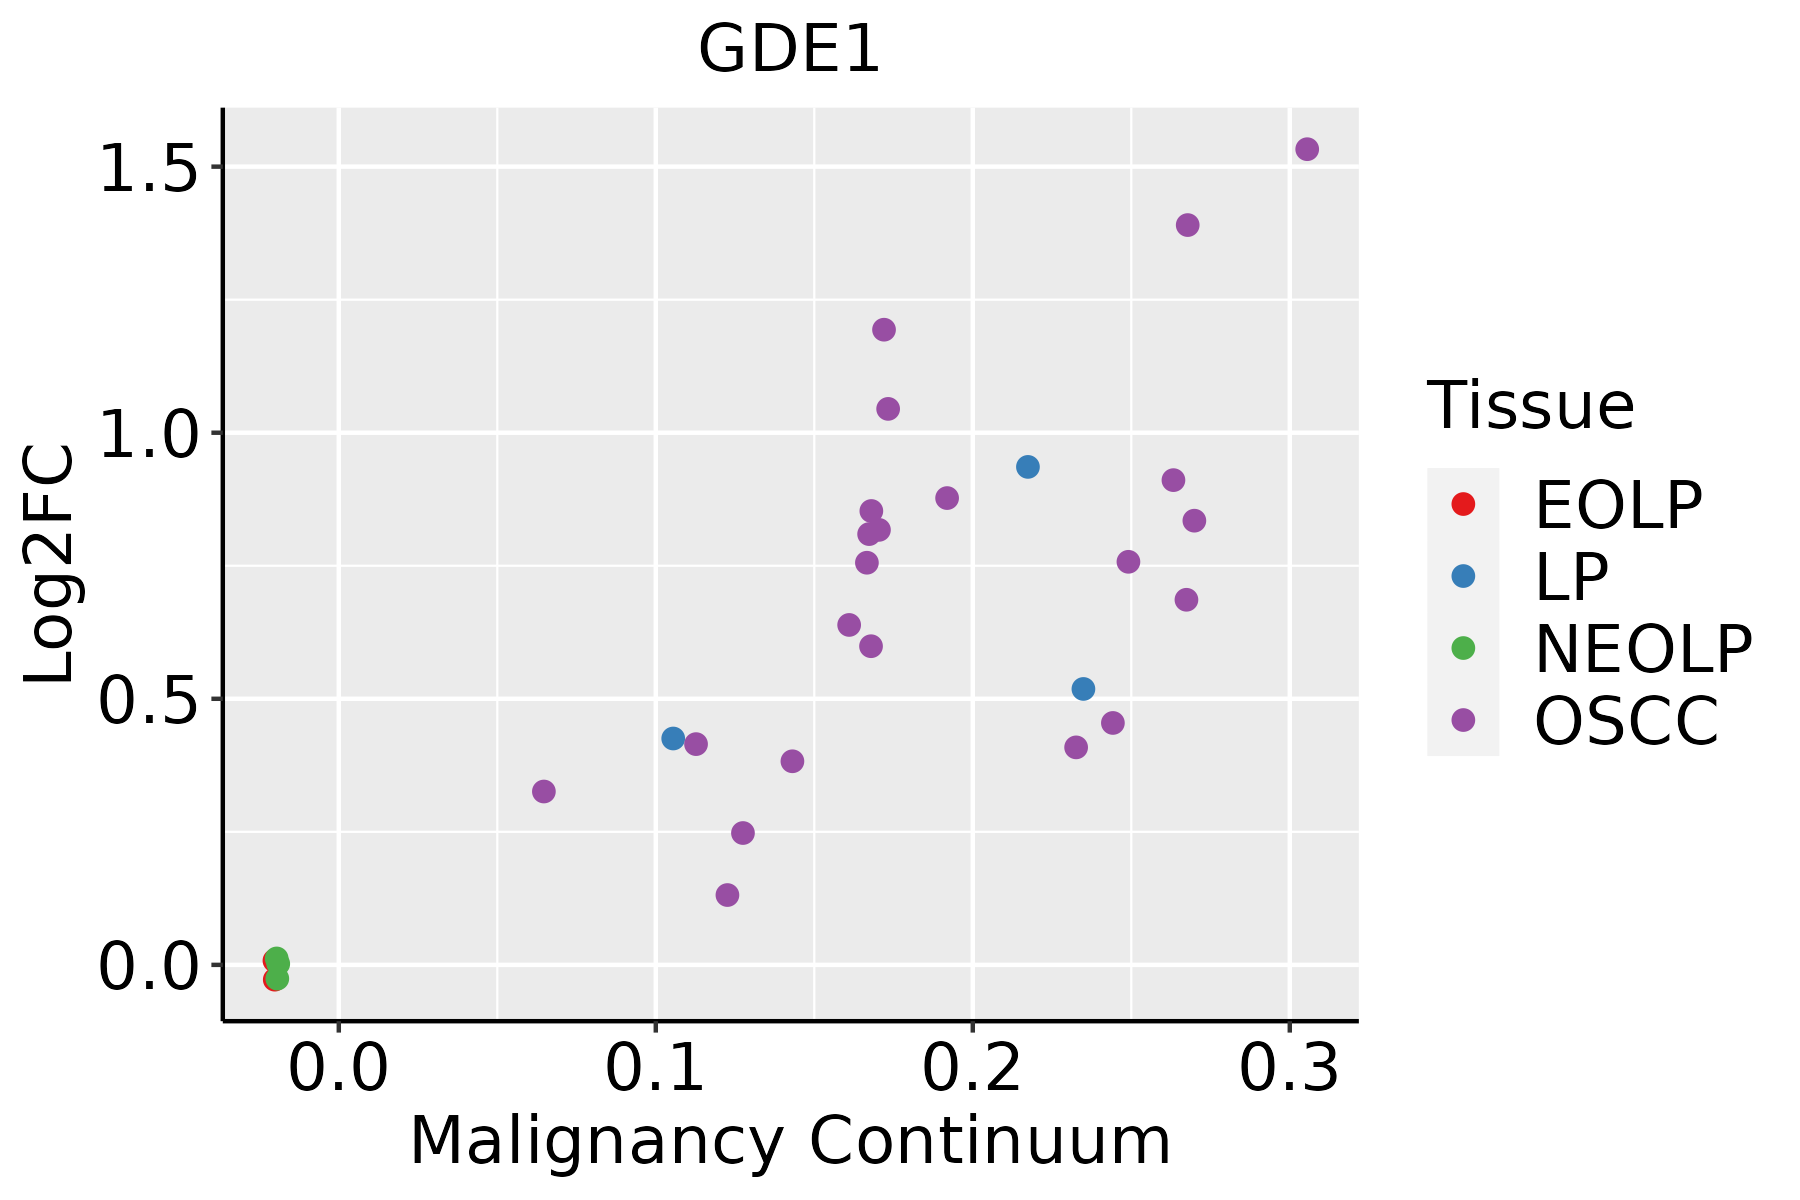
EOLP: Erosive Oral lichen planus
LP: leukoplakia
NEOLP: Non-erosive oral lichen planus
OSCC: Oral squamous cell carcinoma
ProstateThe image shows the transcriptomic changes along malignancy continuum.log2FC in expression of this searched gene in stem-like cells from each diseased tissue sample relative to stem-like cells in normal samples in each tissue plotted against the malignancy continuum. Samples are colored based on if they are from different disease stage.
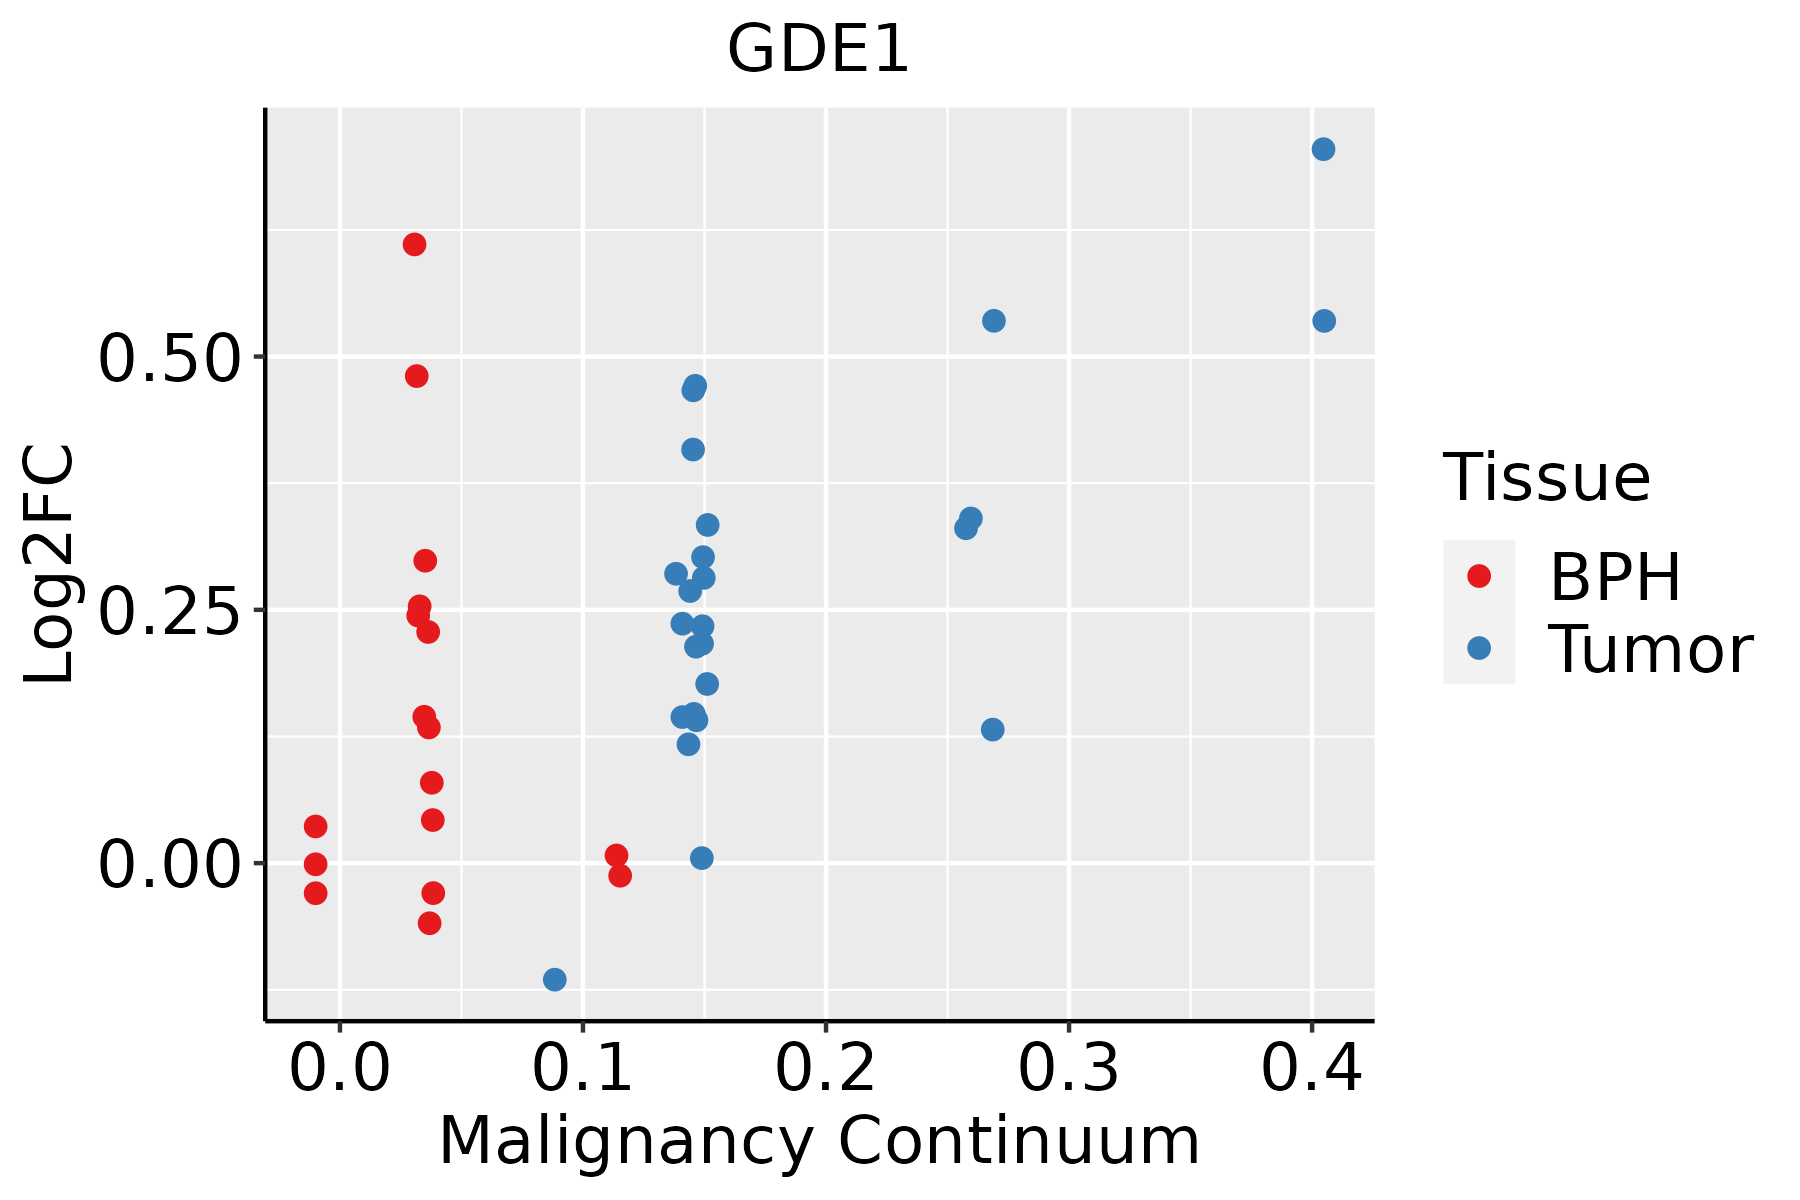
BPH: Benign Prostatic Hyperplasia
SkinThe image shows the transcriptomic changes along malignancy continuum.log2FC in expression of this searched gene in stem-like cells from each diseased tissue sample relative to stem-like cells in normal samples in each tissue plotted against the malignancy continuum. Samples are colored based on if they are from different disease stage.AK: Actinic keratosis
cSCC: Cutaneous squamous cell carcinoma
SCCIS:squamous cell carcinoma in situ
ThyroidThe image shows the transcriptomic changes along malignancy continuum.log2FC in expression of this searched gene in stem-like cells from each diseased tissue sample relative to stem-like cells in normal samples in each tissue plotted against the malignancy continuum. Samples are colored based on if they are from different disease stage.ATC: Anaplastic thyroid cancer
HT: Hashimoto's thyroiditis
PTC: Papillary thyroid cancer
∗log2FC in expression of this searched gene in stem-like cells from each diseased tissue sample relative to stem-like cells in normal samples in each tissue plotted against the malignancy continuum. Samples are colored based on if they are from different disease stage.

Top

Malignant transformation related pathway analysis

check buttonFind out the enriched GO biological processes and KEGG pathways involved in transition from healthy to precancer to cancer
check button Figure of enriched GO biological processes.
TissueDisease StageEnriched GO biological Processes
ColorectumADGO analysis - Figure of enriched GO biological processes: Top 15 enriched GO BP terms are showed in the bar plot of each disease state in each tissue. Each row represents a significant GO biological process which is colored according to the -log10(p.adjust).
ColorectumSERGO analysis - Figure of enriched GO biological processes: Top 15 enriched GO BP terms are showed in the bar plot of each disease state in each tissue. Each row represents a significant GO biological process which is colored according to the -log10(p.adjust).
ColorectumMSSGO analysis - Figure of enriched GO biological processes: Top 15 enriched GO BP terms are showed in the bar plot of each disease state in each tissue. Each row represents a significant GO biological process which is colored according to the -log10(p.adjust).
ColorectumMSI-HGO analysis - Figure of enriched GO biological processes: Top 15 enriched GO BP terms are showed in the bar plot of each disease state in each tissue. Each row represents a significant GO biological process which is colored according to the -log10(p.adjust).
ColorectumFAPGO analysis - Figure of enriched GO biological processes: Top 15 enriched GO BP terms are showed in the bar plot of each disease state in each tissue. Each row represents a significant GO biological process which is colored according to the -log10(p.adjust).
∗Top 15 enriched GO BP terms are showed in the bar plot of each disease state in each tissue. Each row represents a significant GO biological process which is colored according to the -log10(p.adjust).
Page: 1 2 3 4 5 6 7 8 9 

check button Enriched GO biological processes.
GO IDTissueDisease StageDescriptionGene RatioBg Ratiopvaluep.adjustCount
GO:0006066ColorectumADalcohol metabolic process106/3918353/187233.02e-055.57e-04106
GO:0016042ColorectumADlipid catabolic process97/3918320/187234.31e-057.56e-0497
GO:0044242ColorectumADcellular lipid catabolic process66/3918214/187233.96e-044.50e-0366
GO:0034308ColorectumADprimary alcohol metabolic process35/3918102/187231.16e-031.05e-0235
GO:0006650ColorectumADglycerophospholipid metabolic process83/3918306/187235.40e-033.55e-0283
GO:0006644ColorectumADphospholipid metabolic process101/3918383/187235.80e-033.67e-02101
GO:00160421ColorectumSERlipid catabolic process77/2897320/187233.52e-059.18e-0477
GO:00060661ColorectumSERalcohol metabolic process79/2897353/187233.50e-045.50e-0379
GO:00442421ColorectumSERcellular lipid catabolic process51/2897214/187238.60e-041.05e-0251
GO:0046486ColorectumSERglycerolipid metabolic process82/2897392/187232.26e-032.17e-0282
GO:00066441ColorectumSERphospholipid metabolic process79/2897383/187233.94e-033.24e-0279
GO:00343081ColorectumSERprimary alcohol metabolic process26/2897102/187235.87e-034.29e-0226
GO:00066501ColorectumSERglycerophospholipid metabolic process64/2897306/187236.41e-034.60e-0264
GO:00060662ColorectumMSSalcohol metabolic process92/3467353/187232.57e-043.46e-0392
GO:00160422ColorectumMSSlipid catabolic process77/3467320/187237.43e-034.71e-0277
GO:00442422ColorectumFAPcellular lipid catabolic process49/2622214/187232.87e-043.77e-0349
GO:00160423ColorectumFAPlipid catabolic process65/2622320/187231.13e-031.08e-0265
GO:00066502ColorectumFAPglycerophospholipid metabolic process62/2622306/187231.54e-031.38e-0262
GO:00066442ColorectumFAPphospholipid metabolic process74/2622383/187232.24e-031.83e-0274
GO:00060663ColorectumFAPalcohol metabolic process69/2622353/187232.29e-031.85e-0269
Page: 1 2 3 

check button Enriched KEGG pathways.
Pathway IDTissueDisease StageDescriptionGene RatioBg Ratiopvaluep.adjustqvalueCount
Page: 1 

Top

Cell-cell communication analysis

check buttonIdentification of potential cell-cell interactions between two cell types and their ligand-receptor pairs for different disease states
LigandReceptorLRpairPathwayTissueDisease Stage
Page: 1 

Top

Single-cell gene regulatory network inference analysis

check buttonFind out the significant the regulons (TFs) and the target genes of each regulon across cell types for different disease states
TFCell TypeTissueDisease StageTarget GeneRSSRegulon Activity
∗The dot plots of a searched regulon are shown for all cell subpopulations in each disease state of each tissue based on the regulon specific score inferred using pySCENIC and by calculating the average expression.
Page: 1 

Top

Somatic mutation of malignant transformation related genes

check buttonAnnotation of somatic variants for genes involved in malignant transformation
Hugo SymbolVariant ClassVariant ClassificationdbSNP RSHGVScHGVSpHGVSp ShortSWISSPROTBIOTYPESIFTPolyPhenTumor Sample BarcodeTissueHistologySexAgeStageTherapy TypesDrugsOutcome
GDE1SNVMissense_Mutationc.652C>Gp.Arg218Glyp.R218GQ9NZC3protein_codingtolerated(0.17)benign(0.119)TCGA-E2-A573-01Breastbreast invasive carcinomaFemale<65I/IIChemotherapytaxotereCR
GDE1insertionFrame_Shift_Insnovelc.278_279insTGGTTATTCATGTAATATCAATp.Thr94GlyfsTer15p.T94Gfs*15Q9NZC3protein_codingTCGA-AN-A049-01Breastbreast invasive carcinomaFemale<65I/IIUnknownUnknownSD
GDE1SNVMissense_Mutationrs757733912c.652N>Tp.Arg218Trpp.R218WQ9NZC3protein_codingdeleterious(0.01)possibly_damaging(0.606)TCGA-AZ-4315-01Colorectumcolon adenocarcinomaMale<65I/IIUnknownUnknownSD
GDE1SNVMissense_Mutationrs757733912c.652N>Tp.Arg218Trpp.R218WQ9NZC3protein_codingdeleterious(0.01)possibly_damaging(0.606)TCGA-AP-A056-01Endometriumuterine corpus endometrioid carcinomaFemale<65I/IIUnknownUnknownSD
GDE1SNVMissense_Mutationnovelc.779N>Cp.Ser260Thrp.S260TQ9NZC3protein_codingtolerated(0.18)possibly_damaging(0.725)TCGA-AP-A0LM-01Endometriumuterine corpus endometrioid carcinomaFemale<65III/IVChemotherapycisplatinSD
GDE1SNVMissense_Mutationnovelc.752N>Gp.Val251Glyp.V251GQ9NZC3protein_codingtolerated(0.54)benign(0.003)TCGA-AX-A2HD-01Endometriumuterine corpus endometrioid carcinomaFemale>=65III/IVUnknownUnknownSD
GDE1SNVMissense_Mutationrs537541856c.374G>Ap.Arg125Glnp.R125QQ9NZC3protein_codingtolerated(0.54)benign(0.012)TCGA-BG-A220-01Endometriumuterine corpus endometrioid carcinomaFemale>=65I/IIUnknownUnknownSD
GDE1SNVMissense_Mutationc.877N>Ap.Gly293Argp.G293RQ9NZC3protein_codingdeleterious(0)probably_damaging(0.999)TCGA-D1-A0ZU-01Endometriumuterine corpus endometrioid carcinomaFemale<65I/IIChemotherapycarboplatinSD
GDE1SNVMissense_Mutationrs757733912c.652C>Tp.Arg218Trpp.R218WQ9NZC3protein_codingdeleterious(0.01)possibly_damaging(0.606)TCGA-D1-A16X-01Endometriumuterine corpus endometrioid carcinomaFemale<65I/IIUnknownUnknownSD
GDE1SNVMissense_Mutationnovelc.677N>Gp.His226Argp.H226RQ9NZC3protein_codingtolerated(0.19)possibly_damaging(0.759)TCGA-FI-A2F4-01Endometriumuterine corpus endometrioid carcinomaFemale<65I/IIUnknownUnknownSD
Page: 1 2 

Top

Related drugs of malignant transformation related genes

check buttonIdentification of chemicals and drugs interact with genes involved in malignant transfromation
(DGIdb 4.0)
Entrez IDSymbolCategoryInteraction TypesDrug Claim NameDrug NamePMIDs
Page: 1