
|
|||||
|
 | |
| |
| |
| |
| |
| |
|
Gene: GDAP1L1 |
Gene summary for GDAP1L1 |
| Gene information | Species | Human | Gene symbol | GDAP1L1 | Gene ID | 78997 |
| Gene name | ganglioside induced differentiation associated protein 1 like 1 | |
| Gene Alias | dJ881L22.1 | |
| Cytomap | 20q13.12 | |
| Gene Type | protein-coding | GO ID | GO:0006518 | UniProtAcc | Q96MZ0 |
Top |
Malignant transformation analysis |
| Identification of the aberrant gene expression in precancerous and cancerous lesions by comparing the gene expression of stem-like cells in diseased tissues with normal stem cells |
| Entrez ID | Symbol | Replicates | Species | Organ | Tissue | Adj P-value | Log2FC | Malignancy |
| 78997 | GDAP1L1 | S014 | Human | Liver | HCC | 2.84e-04 | 3.49e-01 | 0.2254 |
| 78997 | GDAP1L1 | S015 | Human | Liver | HCC | 1.66e-13 | 7.10e-01 | 0.2375 |
| 78997 | GDAP1L1 | S016 | Human | Liver | HCC | 1.83e-19 | 7.53e-01 | 0.2243 |
| Page: 1 |
| Tissue | Expression Dynamics | Abbreviation |
| Liver | 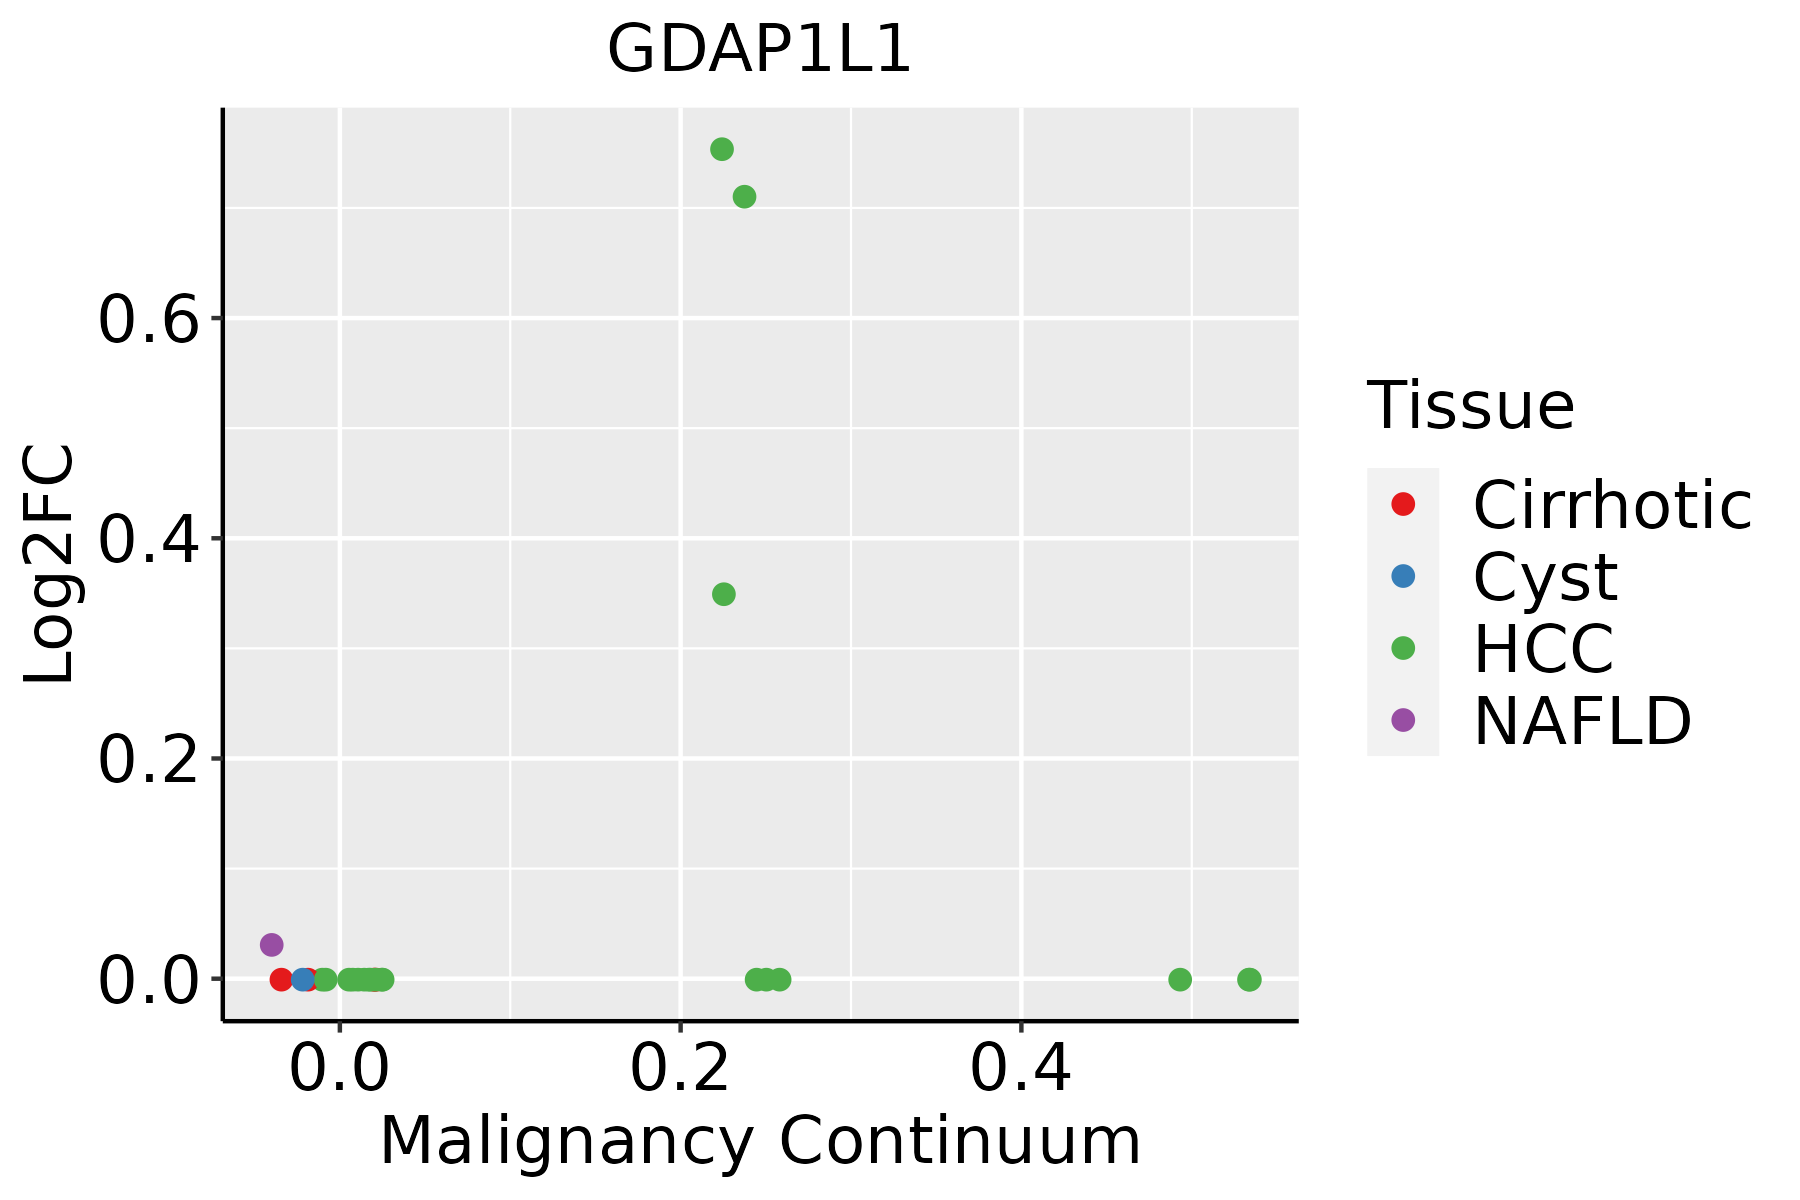 | HCC: Hepatocellular carcinoma |
| NAFLD: Non-alcoholic fatty liver disease |
| ∗log2FC in expression of this searched gene in stem-like cells from each diseased tissue sample relative to stem-like cells in normal samples in each tissue plotted against the malignancy continuum. Samples are colored based on if they are from different disease stage. |
Top |
Malignant transformation related pathway analysis |
| Find out the enriched GO biological processes and KEGG pathways involved in transition from healthy to precancer to cancer |
| Tissue | Disease Stage | Enriched GO biological Processes |
| Colorectum | AD |  |
| Colorectum | SER |  |
| Colorectum | MSS |  |
| Colorectum | MSI-H |  |
| Colorectum | FAP |  |
| ∗Top 15 enriched GO BP terms are showed in the bar plot of each disease state in each tissue. Each row represents a significant GO biological process which is colored according to the -log10(p.adjust). |
| Page: 1 2 3 4 5 6 7 8 9 |
| GO ID | Tissue | Disease Stage | Description | Gene Ratio | Bg Ratio | pvalue | p.adjust | Count |
| GO:000679021 | Liver | HCC | sulfur compound metabolic process | 212/7958 | 339/18723 | 5.60e-14 | 3.39e-12 | 212 |
| GO:000657521 | Liver | HCC | cellular modified amino acid metabolic process | 119/7958 | 188/18723 | 6.47e-09 | 1.67e-07 | 119 |
| GO:000674911 | Liver | HCC | glutathione metabolic process | 44/7958 | 64/18723 | 1.95e-05 | 2.09e-04 | 44 |
| Page: 1 |
| Pathway ID | Tissue | Disease Stage | Description | Gene Ratio | Bg Ratio | pvalue | p.adjust | qvalue | Count |
| Page: 1 |
Top |
Cell-cell communication analysis |
| Identification of potential cell-cell interactions between two cell types and their ligand-receptor pairs for different disease states |
| Ligand | Receptor | LRpair | Pathway | Tissue | Disease Stage |
| Page: 1 |
Top |
Single-cell gene regulatory network inference analysis |
| Find out the significant the regulons (TFs) and the target genes of each regulon across cell types for different disease states |
| TF | Cell Type | Tissue | Disease Stage | Target Gene | RSS | Regulon Activity |
| ∗The dot plots of a searched regulon are shown for all cell subpopulations in each disease state of each tissue based on the regulon specific score inferred using pySCENIC and by calculating the average expression. |
| Page: 1 |
Top |
Somatic mutation of malignant transformation related genes |
| Annotation of somatic variants for genes involved in malignant transformation |
| Hugo Symbol | Variant Class | Variant Classification | dbSNP RS | HGVSc | HGVSp | HGVSp Short | SWISSPROT | BIOTYPE | SIFT | PolyPhen | Tumor Sample Barcode | Tissue | Histology | Sex | Age | Stage | Therapy Types | Drugs | Outcome |
| GDAP1L1 | SNV | Missense_Mutation | rs776586206 | c.118N>T | p.Ala40Ser | p.A40S | Q96MZ0 | protein_coding | tolerated_low_confidence(0.31) | benign(0.003) | TCGA-EW-A3E8-01 | Breast | breast invasive carcinoma | Female | <65 | I/II | Hormone Therapy | anastrozole | SD |
| GDAP1L1 | SNV | Missense_Mutation | rs758637664 | c.359N>A | p.Arg120His | p.R120H | Q96MZ0 | protein_coding | deleterious(0.02) | possibly_damaging(0.638) | TCGA-2W-A8YY-01 | Cervix | cervical & endocervical cancer | Female | <65 | I/II | Chemotherapy | cisplatin | CR |
| GDAP1L1 | SNV | Missense_Mutation | novel | c.895N>T | p.Leu299Phe | p.L299F | Q96MZ0 | protein_coding | deleterious(0) | probably_damaging(1) | TCGA-2W-A8YY-01 | Cervix | cervical & endocervical cancer | Female | <65 | I/II | Chemotherapy | cisplatin | CR |
| GDAP1L1 | SNV | Missense_Mutation | rs774843670 | c.407N>A | p.Ala136Asp | p.A136D | Q96MZ0 | protein_coding | tolerated(0.23) | benign(0.005) | TCGA-FU-A3HZ-01 | Cervix | cervical & endocervical cancer | Female | <65 | I/II | Chemotherapy | cisplatin | CR |
| GDAP1L1 | SNV | Missense_Mutation | c.601C>T | p.Arg201Cys | p.R201C | Q96MZ0 | protein_coding | deleterious(0.02) | probably_damaging(0.987) | TCGA-A6-5659-01 | Colorectum | colon adenocarcinoma | Male | >=65 | I/II | Unknown | Unknown | SD | |
| GDAP1L1 | SNV | Missense_Mutation | rs752380295 | c.1028C>T | p.Ser343Leu | p.S343L | Q96MZ0 | protein_coding | deleterious(0) | probably_damaging(0.994) | TCGA-AA-A010-01 | Colorectum | colon adenocarcinoma | Female | <65 | I/II | Chemotherapy | folinic | CR |
| GDAP1L1 | SNV | Missense_Mutation | rs749288709 | c.922T>C | p.Tyr308His | p.Y308H | Q96MZ0 | protein_coding | tolerated(0.07) | probably_damaging(0.953) | TCGA-AA-A01P-01 | Colorectum | colon adenocarcinoma | Female | >=65 | III/IV | Unknown | Unknown | PD |
| GDAP1L1 | SNV | Missense_Mutation | c.586N>A | p.Ala196Thr | p.A196T | Q96MZ0 | protein_coding | tolerated(0.08) | probably_damaging(0.977) | TCGA-G4-6311-01 | Colorectum | colon adenocarcinoma | Male | >=65 | III/IV | Chemotherapy | oxaliplatin | SD | |
| GDAP1L1 | SNV | Missense_Mutation | novel | c.717G>C | p.Glu239Asp | p.E239D | Q96MZ0 | protein_coding | tolerated(1) | benign(0.046) | TCGA-AG-3898-01 | Colorectum | rectum adenocarcinoma | Male | <65 | I/II | Unknown | Unknown | SD |
| GDAP1L1 | SNV | Missense_Mutation | rs758637664 | c.359N>A | p.Arg120His | p.R120H | Q96MZ0 | protein_coding | deleterious(0.02) | possibly_damaging(0.638) | TCGA-A5-A0G1-01 | Endometrium | uterine corpus endometrioid carcinoma | Female | >=65 | I/II | Unknown | Unknown | SD |
| Page: 1 2 3 4 |
Top |
Related drugs of malignant transformation related genes |
| Identification of chemicals and drugs interact with genes involved in malignant transfromation |
| (DGIdb 4.0) |
| Entrez ID | Symbol | Category | Interaction Types | Drug Claim Name | Drug Name | PMIDs |
| Page: 1 |

Copyright 2023-Present -The University of Texas Health Science Center at Houston |