
|
|||||
|
 | |
| |
| |
| |
| |
| |
|
Gene: GDAP1 |
Gene summary for GDAP1 |
| Gene information | Species | Human | Gene symbol | GDAP1 | Gene ID | 54332 |
| Gene name | ganglioside induced differentiation associated protein 1 | |
| Gene Alias | CMT4 | |
| Cytomap | 8q21.11 | |
| Gene Type | protein-coding | GO ID | GO:0000266 | UniProtAcc | Q8TB36 |
Top |
Malignant transformation analysis |
| Identification of the aberrant gene expression in precancerous and cancerous lesions by comparing the gene expression of stem-like cells in diseased tissues with normal stem cells |
| Entrez ID | Symbol | Replicates | Species | Organ | Tissue | Adj P-value | Log2FC | Malignancy |
| 54332 | GDAP1 | LZE4T | Human | Esophagus | ESCC | 9.92e-11 | 3.54e-01 | 0.0811 |
| 54332 | GDAP1 | LZE24T | Human | Esophagus | ESCC | 9.34e-05 | 1.55e-01 | 0.0596 |
| 54332 | GDAP1 | P4T-E | Human | Esophagus | ESCC | 8.78e-10 | 2.83e-01 | 0.1323 |
| 54332 | GDAP1 | P5T-E | Human | Esophagus | ESCC | 6.56e-15 | 3.00e-01 | 0.1327 |
| 54332 | GDAP1 | P8T-E | Human | Esophagus | ESCC | 4.17e-05 | 1.29e-01 | 0.0889 |
| 54332 | GDAP1 | P9T-E | Human | Esophagus | ESCC | 4.96e-05 | 1.54e-01 | 0.1131 |
| 54332 | GDAP1 | P10T-E | Human | Esophagus | ESCC | 5.79e-16 | 2.63e-01 | 0.116 |
| 54332 | GDAP1 | P12T-E | Human | Esophagus | ESCC | 3.58e-28 | 4.93e-01 | 0.1122 |
| 54332 | GDAP1 | P15T-E | Human | Esophagus | ESCC | 3.50e-13 | 3.12e-01 | 0.1149 |
| 54332 | GDAP1 | P16T-E | Human | Esophagus | ESCC | 7.61e-16 | 2.56e-01 | 0.1153 |
| 54332 | GDAP1 | P20T-E | Human | Esophagus | ESCC | 2.42e-05 | 1.94e-01 | 0.1124 |
| 54332 | GDAP1 | P22T-E | Human | Esophagus | ESCC | 1.96e-05 | 1.28e-01 | 0.1236 |
| 54332 | GDAP1 | P23T-E | Human | Esophagus | ESCC | 1.00e-10 | 3.86e-01 | 0.108 |
| 54332 | GDAP1 | P26T-E | Human | Esophagus | ESCC | 4.12e-11 | 2.44e-01 | 0.1276 |
| 54332 | GDAP1 | P27T-E | Human | Esophagus | ESCC | 4.16e-22 | 3.50e-01 | 0.1055 |
| 54332 | GDAP1 | P28T-E | Human | Esophagus | ESCC | 7.98e-13 | 2.19e-01 | 0.1149 |
| 54332 | GDAP1 | P30T-E | Human | Esophagus | ESCC | 1.12e-06 | 3.47e-01 | 0.137 |
| 54332 | GDAP1 | P31T-E | Human | Esophagus | ESCC | 1.88e-04 | 9.76e-02 | 0.1251 |
| 54332 | GDAP1 | P32T-E | Human | Esophagus | ESCC | 1.78e-03 | 1.03e-01 | 0.1666 |
| 54332 | GDAP1 | P36T-E | Human | Esophagus | ESCC | 3.28e-04 | 3.02e-01 | 0.1187 |
| Page: 1 2 3 |
| Tissue | Expression Dynamics | Abbreviation |
| Esophagus | 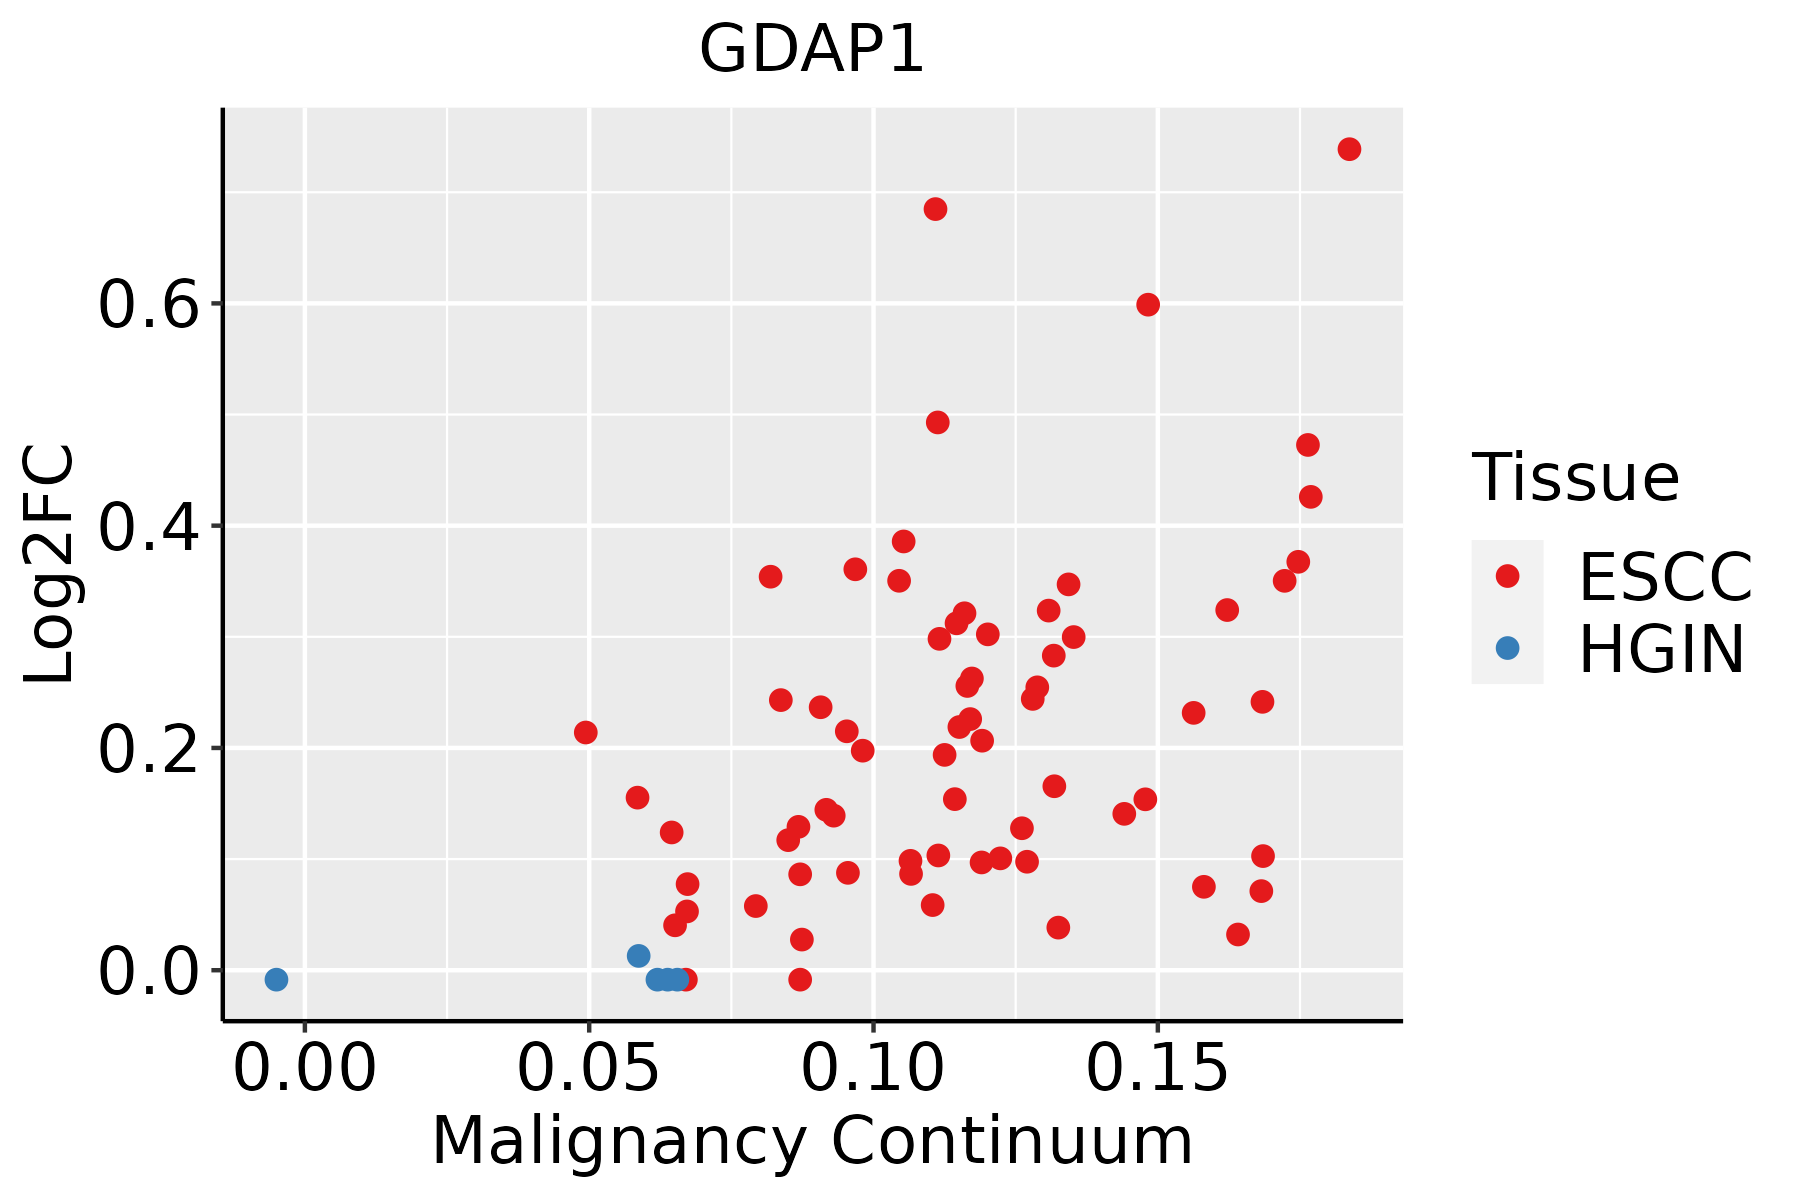 | ESCC: Esophageal squamous cell carcinoma |
| HGIN: High-grade intraepithelial neoplasias | ||
| LGIN: Low-grade intraepithelial neoplasias | ||
| Liver | 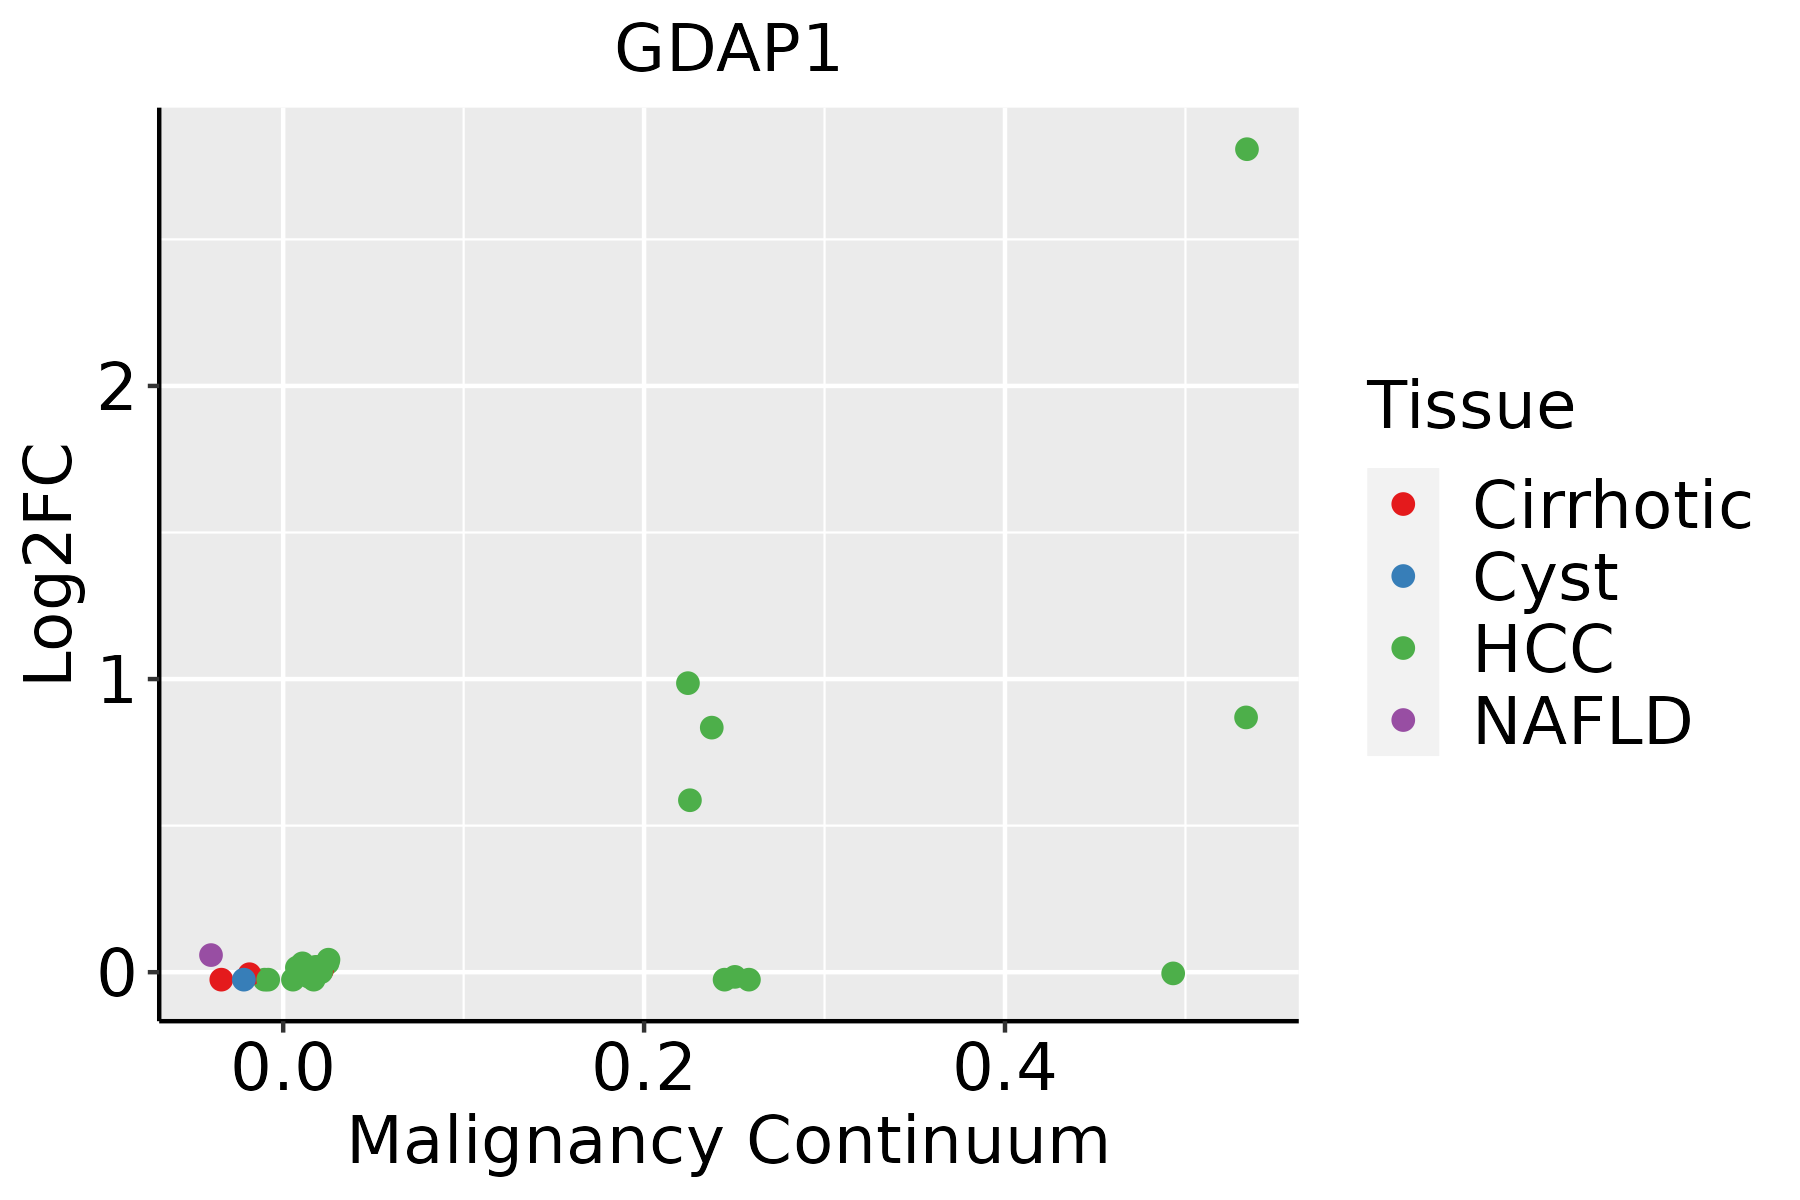 | HCC: Hepatocellular carcinoma |
| NAFLD: Non-alcoholic fatty liver disease |
| ∗log2FC in expression of this searched gene in stem-like cells from each diseased tissue sample relative to stem-like cells in normal samples in each tissue plotted against the malignancy continuum. Samples are colored based on if they are from different disease stage. |
Top |
Malignant transformation related pathway analysis |
| Find out the enriched GO biological processes and KEGG pathways involved in transition from healthy to precancer to cancer |
| Tissue | Disease Stage | Enriched GO biological Processes |
| Colorectum | AD |  |
| Colorectum | SER |  |
| Colorectum | MSS |  |
| Colorectum | MSI-H |  |
| Colorectum | FAP |  |
| ∗Top 15 enriched GO BP terms are showed in the bar plot of each disease state in each tissue. Each row represents a significant GO biological process which is colored according to the -log10(p.adjust). |
| Page: 1 2 3 4 5 6 7 8 9 |
| GO ID | Tissue | Disease Stage | Description | Gene Ratio | Bg Ratio | pvalue | p.adjust | Count |
| GO:0072594110 | Esophagus | ESCC | establishment of protein localization to organelle | 311/8552 | 422/18723 | 3.02e-32 | 2.13e-29 | 311 |
| GO:0006605111 | Esophagus | ESCC | protein targeting | 229/8552 | 314/18723 | 4.93e-23 | 1.01e-20 | 229 |
| GO:0006839110 | Esophagus | ESCC | mitochondrial transport | 187/8552 | 254/18723 | 8.35e-20 | 9.81e-18 | 187 |
| GO:0072655110 | Esophagus | ESCC | establishment of protein localization to mitochondrion | 97/8552 | 120/18723 | 2.17e-15 | 1.33e-13 | 97 |
| GO:0070585110 | Esophagus | ESCC | protein localization to mitochondrion | 100/8552 | 125/18723 | 2.96e-15 | 1.77e-13 | 100 |
| GO:0071496111 | Esophagus | ESCC | cellular response to external stimulus | 215/8552 | 320/18723 | 4.29e-15 | 2.43e-13 | 215 |
| GO:0006626110 | Esophagus | ESCC | protein targeting to mitochondrion | 81/8552 | 100/18723 | 3.60e-13 | 1.67e-11 | 81 |
| GO:00482853 | Esophagus | ESCC | organelle fission | 301/8552 | 488/18723 | 4.64e-13 | 2.12e-11 | 301 |
| GO:0031668111 | Esophagus | ESCC | cellular response to extracellular stimulus | 168/8552 | 246/18723 | 4.93e-13 | 2.23e-11 | 168 |
| GO:0031669110 | Esophagus | ESCC | cellular response to nutrient levels | 148/8552 | 215/18723 | 4.58e-12 | 1.76e-10 | 148 |
| GO:0031667111 | Esophagus | ESCC | response to nutrient levels | 289/8552 | 474/18723 | 9.25e-12 | 3.47e-10 | 289 |
| GO:000758410 | Esophagus | ESCC | response to nutrient | 114/8552 | 174/18723 | 9.43e-08 | 1.56e-06 | 114 |
| GO:00067906 | Esophagus | ESCC | sulfur compound metabolic process | 201/8552 | 339/18723 | 2.64e-07 | 3.94e-06 | 201 |
| GO:00482844 | Esophagus | ESCC | organelle fusion | 94/8552 | 141/18723 | 3.72e-07 | 5.16e-06 | 94 |
| GO:00065757 | Esophagus | ESCC | cellular modified amino acid metabolic process | 112/8552 | 188/18723 | 8.31e-05 | 6.06e-04 | 112 |
| GO:00332734 | Esophagus | ESCC | response to vitamin | 60/8552 | 93/18723 | 1.89e-04 | 1.21e-03 | 60 |
| GO:000674912 | Esophagus | ESCC | glutathione metabolic process | 42/8552 | 64/18723 | 1.01e-03 | 5.12e-03 | 42 |
| GO:0033280 | Esophagus | ESCC | response to vitamin D | 25/8552 | 35/18723 | 1.82e-03 | 8.35e-03 | 25 |
| GO:00080532 | Esophagus | ESCC | mitochondrial fusion | 20/8552 | 27/18723 | 2.61e-03 | 1.11e-02 | 20 |
| GO:00316701 | Esophagus | ESCC | cellular response to nutrient | 30/8552 | 45/18723 | 3.63e-03 | 1.48e-02 | 30 |
| Page: 1 2 3 |
| Pathway ID | Tissue | Disease Stage | Description | Gene Ratio | Bg Ratio | pvalue | p.adjust | qvalue | Count |
| Page: 1 |
Top |
Cell-cell communication analysis |
| Identification of potential cell-cell interactions between two cell types and their ligand-receptor pairs for different disease states |
| Ligand | Receptor | LRpair | Pathway | Tissue | Disease Stage |
| Page: 1 |
Top |
Single-cell gene regulatory network inference analysis |
| Find out the significant the regulons (TFs) and the target genes of each regulon across cell types for different disease states |
| TF | Cell Type | Tissue | Disease Stage | Target Gene | RSS | Regulon Activity |
| ∗The dot plots of a searched regulon are shown for all cell subpopulations in each disease state of each tissue based on the regulon specific score inferred using pySCENIC and by calculating the average expression. |
| Page: 1 |
Top |
Somatic mutation of malignant transformation related genes |
| Annotation of somatic variants for genes involved in malignant transformation |
| Hugo Symbol | Variant Class | Variant Classification | dbSNP RS | HGVSc | HGVSp | HGVSp Short | SWISSPROT | BIOTYPE | SIFT | PolyPhen | Tumor Sample Barcode | Tissue | Histology | Sex | Age | Stage | Therapy Types | Drugs | Outcome |
| GDAP1 | SNV | Missense_Mutation | novel | c.829N>A | p.Glu277Lys | p.E277K | Q8TB36 | protein_coding | deleterious(0.01) | benign(0.262) | TCGA-A7-A6VY-01 | Breast | breast invasive carcinoma | Female | <65 | I/II | Chemotherapy | cyclophosphamide | CR |
| GDAP1 | SNV | Missense_Mutation | c.919N>G | p.Thr307Ala | p.T307A | Q8TB36 | protein_coding | tolerated(0.22) | benign(0.146) | TCGA-A8-A06P-01 | Breast | breast invasive carcinoma | Female | <65 | III/IV | Unspecific | SD | ||
| GDAP1 | SNV | Missense_Mutation | rs778105019 | c.754N>A | p.Ala252Thr | p.A252T | Q8TB36 | protein_coding | tolerated(0.24) | possibly_damaging(0.781) | TCGA-A8-A082-01 | Breast | breast invasive carcinoma | Female | <65 | I/II | Chemotherapy | 5-fluorouracil | CR |
| GDAP1 | SNV | Missense_Mutation | c.919N>G | p.Thr307Ala | p.T307A | Q8TB36 | protein_coding | tolerated(0.22) | benign(0.146) | TCGA-D8-A27F-01 | Breast | breast invasive carcinoma | Female | <65 | I/II | Chemotherapy | adriamycin+cyclophosphamide | SD | |
| GDAP1 | SNV | Missense_Mutation | novel | c.194N>G | p.Glu65Gly | p.E65G | Q8TB36 | protein_coding | deleterious(0) | probably_damaging(1) | TCGA-2W-A8YY-01 | Cervix | cervical & endocervical cancer | Female | <65 | I/II | Chemotherapy | cisplatin | CR |
| GDAP1 | SNV | Missense_Mutation | c.886N>A | p.Val296Ile | p.V296I | Q8TB36 | protein_coding | tolerated(0.65) | benign(0.052) | TCGA-A6-5665-01 | Colorectum | colon adenocarcinoma | Female | >=65 | I/II | Unknown | Unknown | PD | |
| GDAP1 | SNV | Missense_Mutation | novel | c.994N>A | p.Val332Met | p.V332M | Q8TB36 | protein_coding | tolerated(1) | benign(0) | TCGA-AA-3984-01 | Colorectum | colon adenocarcinoma | Female | <65 | I/II | Unknown | Unknown | SD |
| GDAP1 | SNV | Missense_Mutation | rs772722746 | c.572N>A | p.Arg191Gln | p.R191Q | Q8TB36 | protein_coding | tolerated(0.25) | benign(0.183) | TCGA-AA-A03J-01 | Colorectum | colon adenocarcinoma | Female | >=65 | I/II | Unknown | Unknown | SD |
| GDAP1 | SNV | Missense_Mutation | novel | c.989N>T | p.Ala330Val | p.A330V | Q8TB36 | protein_coding | tolerated(0.1) | benign(0) | TCGA-F4-6459-01 | Colorectum | colon adenocarcinoma | Female | <65 | III/IV | Unknown | Unknown | SD |
| GDAP1 | SNV | Missense_Mutation | c.490A>T | p.Ile164Phe | p.I164F | Q8TB36 | protein_coding | tolerated(0.21) | benign(0.131) | TCGA-G4-6304-01 | Colorectum | colon adenocarcinoma | Female | >=65 | I/II | Chemotherapy | fluorouracil | PD |
| Page: 1 2 3 4 |
Top |
Related drugs of malignant transformation related genes |
| Identification of chemicals and drugs interact with genes involved in malignant transfromation |
| (DGIdb 4.0) |
| Entrez ID | Symbol | Category | Interaction Types | Drug Claim Name | Drug Name | PMIDs |
| Page: 1 |

Copyright 2023-Present -The University of Texas Health Science Center at Houston |