
|
|||||
|
 | |
| |
| |
| |
| |
| |
|
Gene: GCNT3 |
Gene summary for GCNT3 |
| Gene information | Species | Human | Gene symbol | GCNT3 | Gene ID | 9245 |
| Gene name | glucosaminyl (N-acetyl) transferase 3, mucin type | |
| Gene Alias | C2/4GnT | |
| Cytomap | 15q22.2 | |
| Gene Type | protein-coding | GO ID | GO:0001655 | UniProtAcc | A0A024R5T9 |
Top |
Malignant transformation analysis |
| Identification of the aberrant gene expression in precancerous and cancerous lesions by comparing the gene expression of stem-like cells in diseased tissues with normal stem cells |
| Entrez ID | Symbol | Replicates | Species | Organ | Tissue | Adj P-value | Log2FC | Malignancy |
| 9245 | GCNT3 | HTA11_3410_2000001011 | Human | Colorectum | AD | 4.38e-03 | -2.65e-01 | 0.0155 |
| 9245 | GCNT3 | HTA11_2487_2000001011 | Human | Colorectum | SER | 3.15e-27 | 1.88e+00 | -0.1808 |
| 9245 | GCNT3 | HTA11_1938_2000001011 | Human | Colorectum | AD | 9.69e-04 | 5.74e-01 | -0.0811 |
| 9245 | GCNT3 | HTA11_78_2000001011 | Human | Colorectum | AD | 3.92e-04 | 6.12e-01 | -0.1088 |
| 9245 | GCNT3 | HTA11_347_2000001011 | Human | Colorectum | AD | 1.94e-15 | 1.03e+00 | -0.1954 |
| 9245 | GCNT3 | HTA11_411_2000001011 | Human | Colorectum | SER | 5.88e-13 | 2.73e+00 | -0.2602 |
| 9245 | GCNT3 | HTA11_2112_2000001011 | Human | Colorectum | SER | 1.20e-09 | 1.66e+00 | -0.2196 |
| 9245 | GCNT3 | HTA11_3361_2000001011 | Human | Colorectum | AD | 7.69e-03 | 5.44e-01 | -0.1207 |
| 9245 | GCNT3 | HTA11_83_2000001011 | Human | Colorectum | SER | 8.82e-07 | 1.22e+00 | -0.1526 |
| 9245 | GCNT3 | HTA11_696_2000001011 | Human | Colorectum | AD | 4.82e-09 | 9.16e-01 | -0.1464 |
| 9245 | GCNT3 | HTA11_1391_2000001011 | Human | Colorectum | AD | 3.77e-04 | 6.80e-01 | -0.059 |
| 9245 | GCNT3 | HTA11_5212_2000001011 | Human | Colorectum | AD | 1.57e-08 | 1.43e+00 | -0.2061 |
| 9245 | GCNT3 | HTA11_866_3004761011 | Human | Colorectum | AD | 5.47e-04 | -2.81e-01 | 0.096 |
| 9245 | GCNT3 | HTA11_7696_3000711011 | Human | Colorectum | AD | 1.36e-03 | -2.47e-01 | 0.0674 |
| 9245 | GCNT3 | HTA11_99999971662_82457 | Human | Colorectum | MSS | 1.67e-03 | -2.43e-01 | 0.3859 |
| 9245 | GCNT3 | HTA11_99999974143_84620 | Human | Colorectum | MSS | 5.84e-07 | -2.83e-01 | 0.3005 |
| 9245 | GCNT3 | A002-C-010 | Human | Colorectum | FAP | 5.44e-05 | -2.22e-01 | 0.242 |
| 9245 | GCNT3 | A015-C-203 | Human | Colorectum | FAP | 3.22e-02 | -1.99e-01 | -0.1294 |
| 9245 | GCNT3 | A002-C-205 | Human | Colorectum | FAP | 5.36e-05 | -2.59e-01 | -0.1236 |
| 9245 | GCNT3 | A015-C-006 | Human | Colorectum | FAP | 6.82e-03 | -2.64e-01 | -0.0994 |
| Page: 1 2 3 4 |
| Tissue | Expression Dynamics | Abbreviation |
| Colorectum (GSE201348) |  | FAP: Familial adenomatous polyposis |
| CRC: Colorectal cancer | ||
| Colorectum (HTA11) |  | AD: Adenomas |
| SER: Sessile serrated lesions | ||
| MSI-H: Microsatellite-high colorectal cancer | ||
| MSS: Microsatellite stable colorectal cancer | ||
| Esophagus | 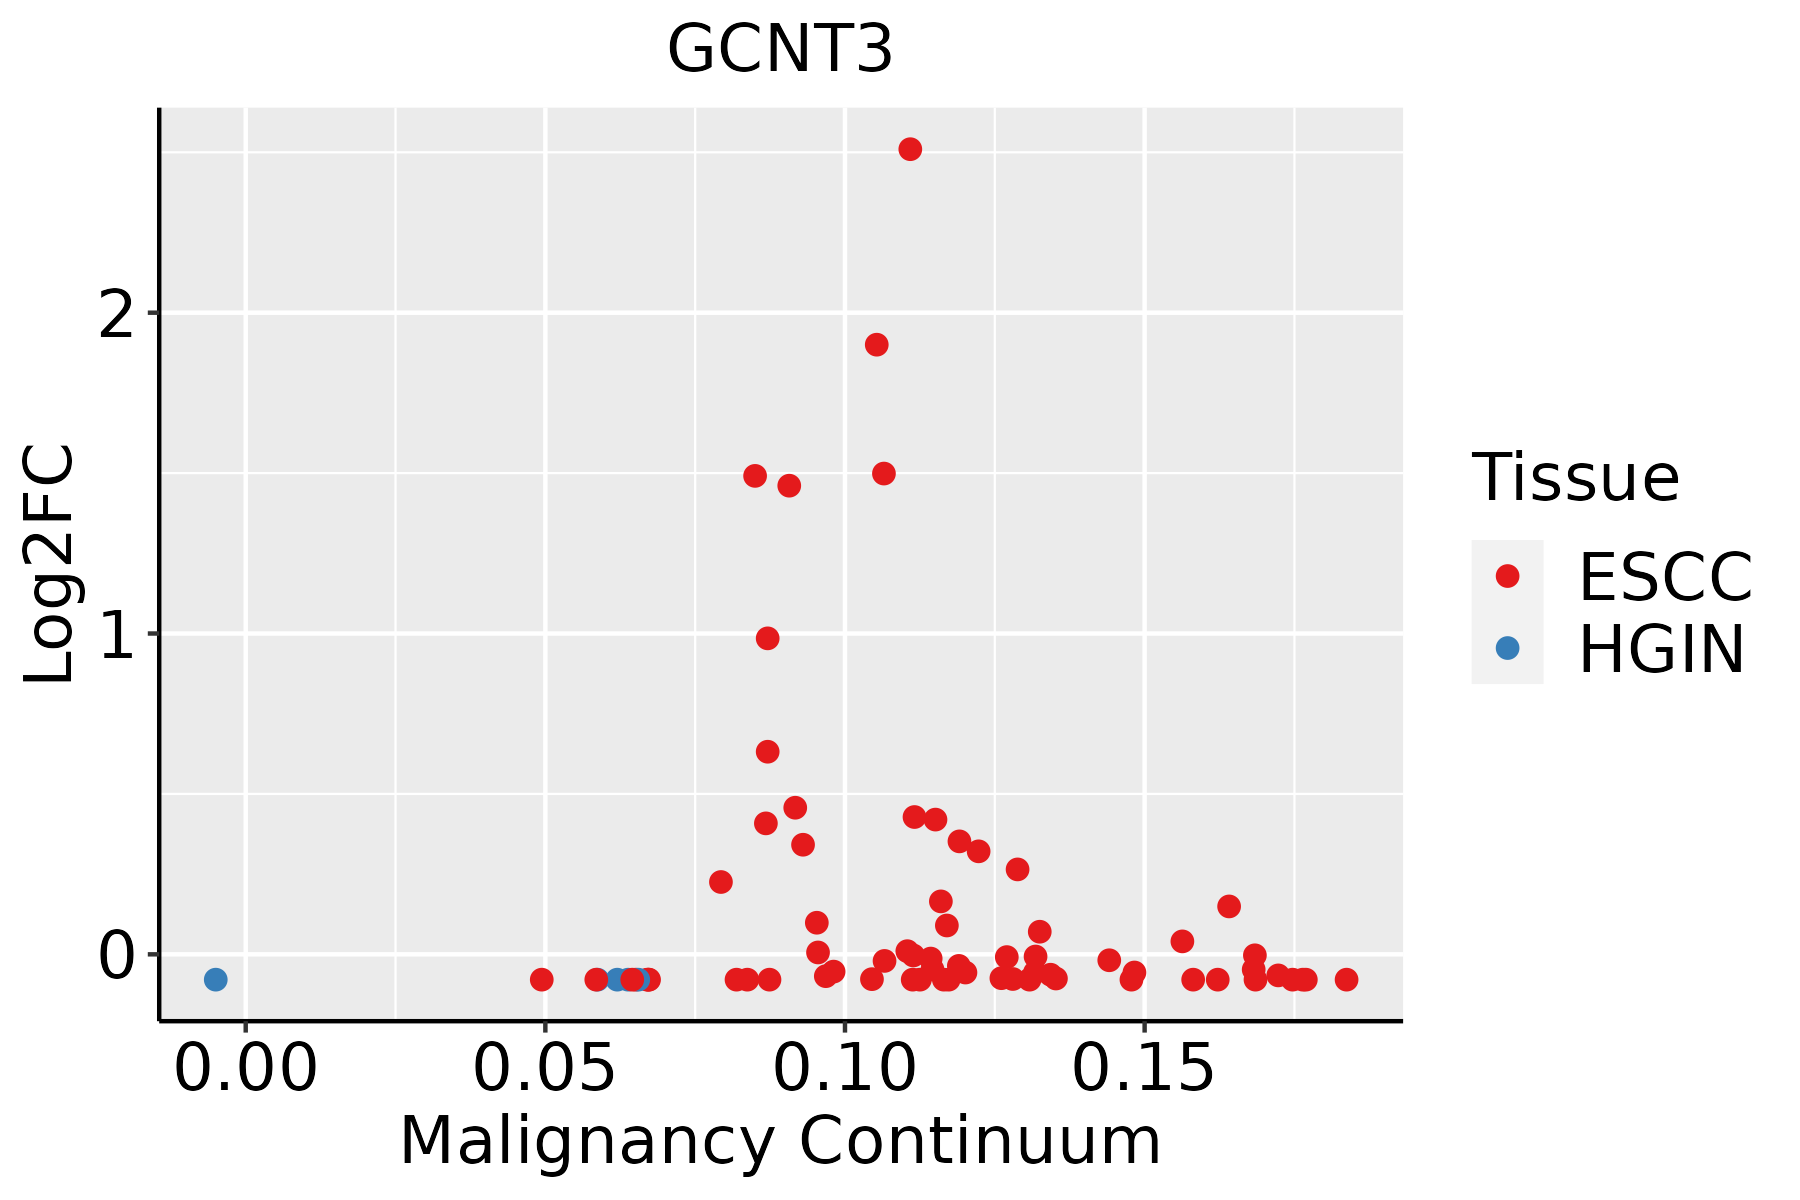 | ESCC: Esophageal squamous cell carcinoma |
| HGIN: High-grade intraepithelial neoplasias | ||
| LGIN: Low-grade intraepithelial neoplasias | ||
| GC | 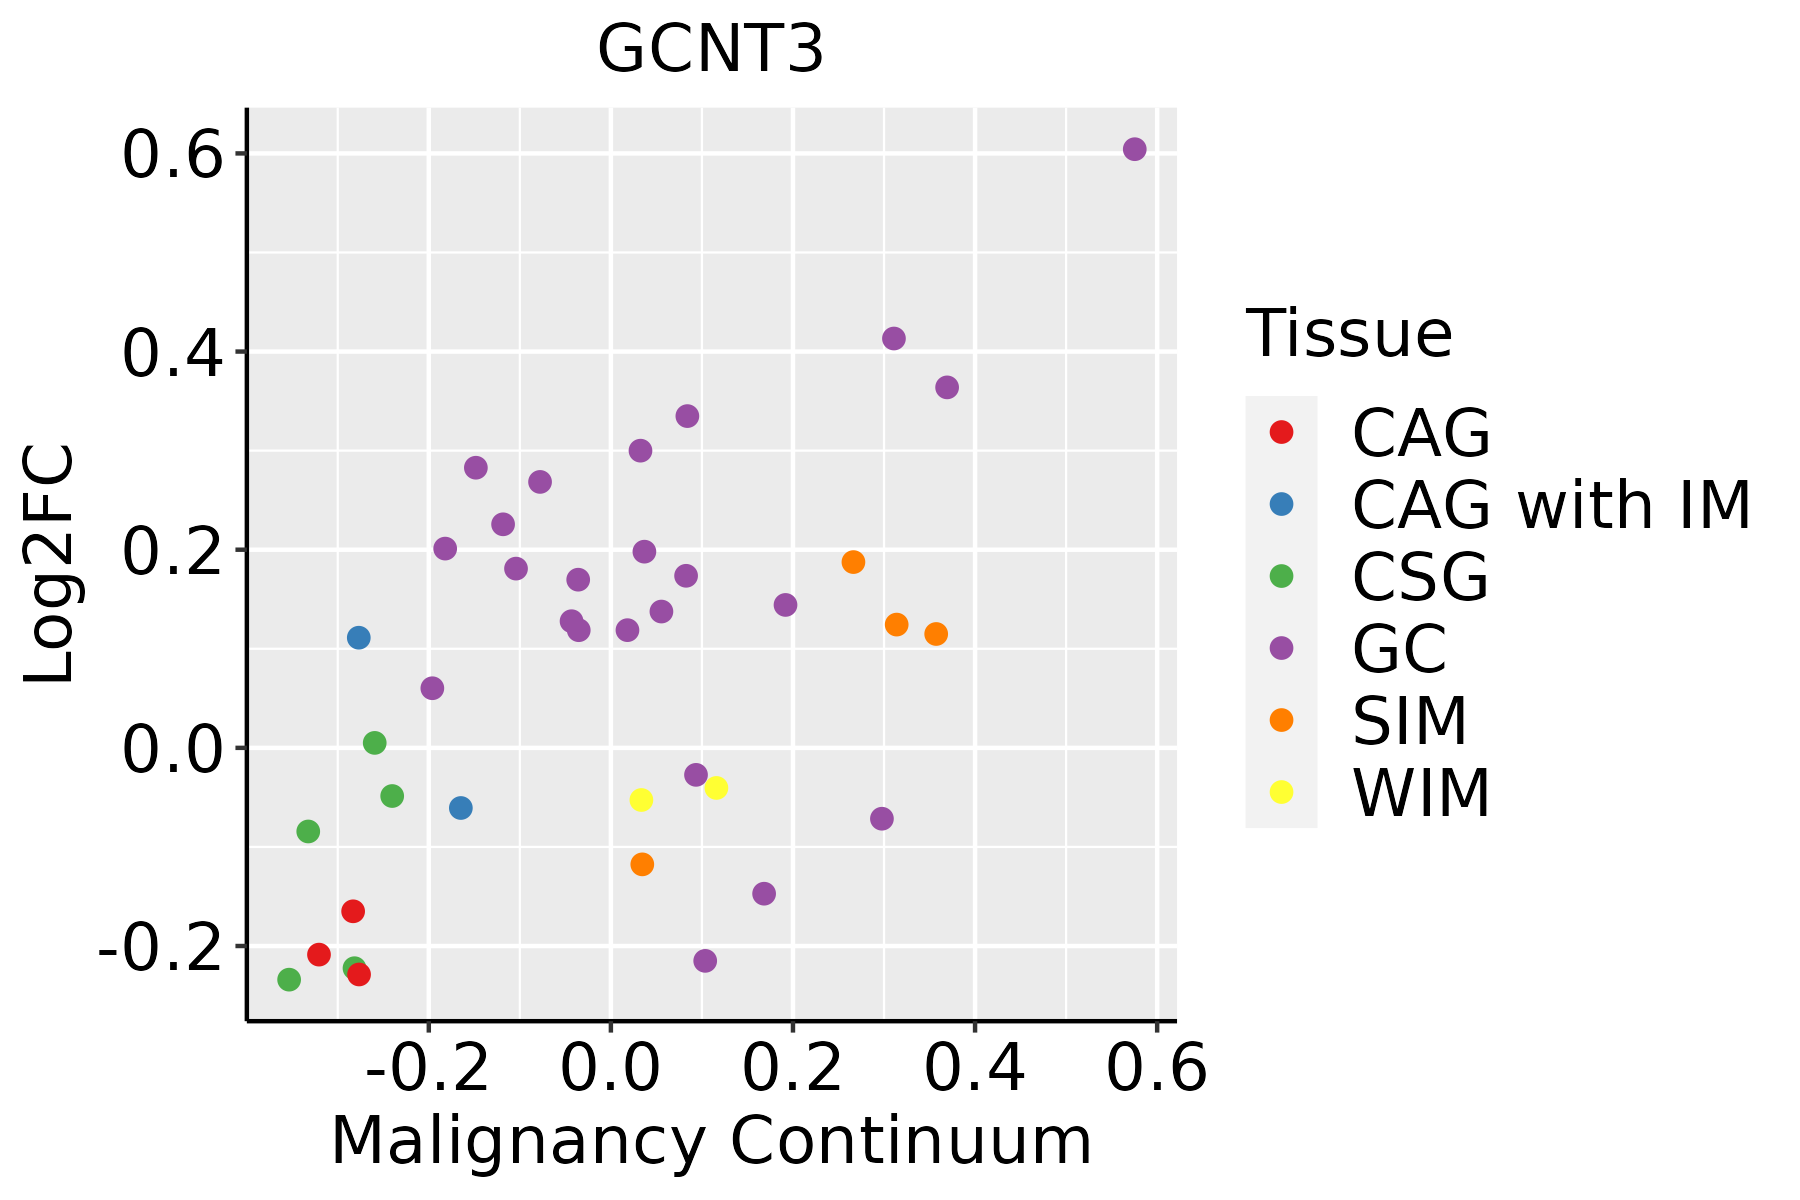 | CAG: Chronic atrophic gastritis |
| CAG with IM: Chronic atrophic gastritis with intestinal metaplasia | ||
| CSG: Chronic superficial gastritis | ||
| GC: Gastric cancer | ||
| SIM: Severe intestinal metaplasia | ||
| WIM: Wild intestinal metaplasia | ||
| Liver | 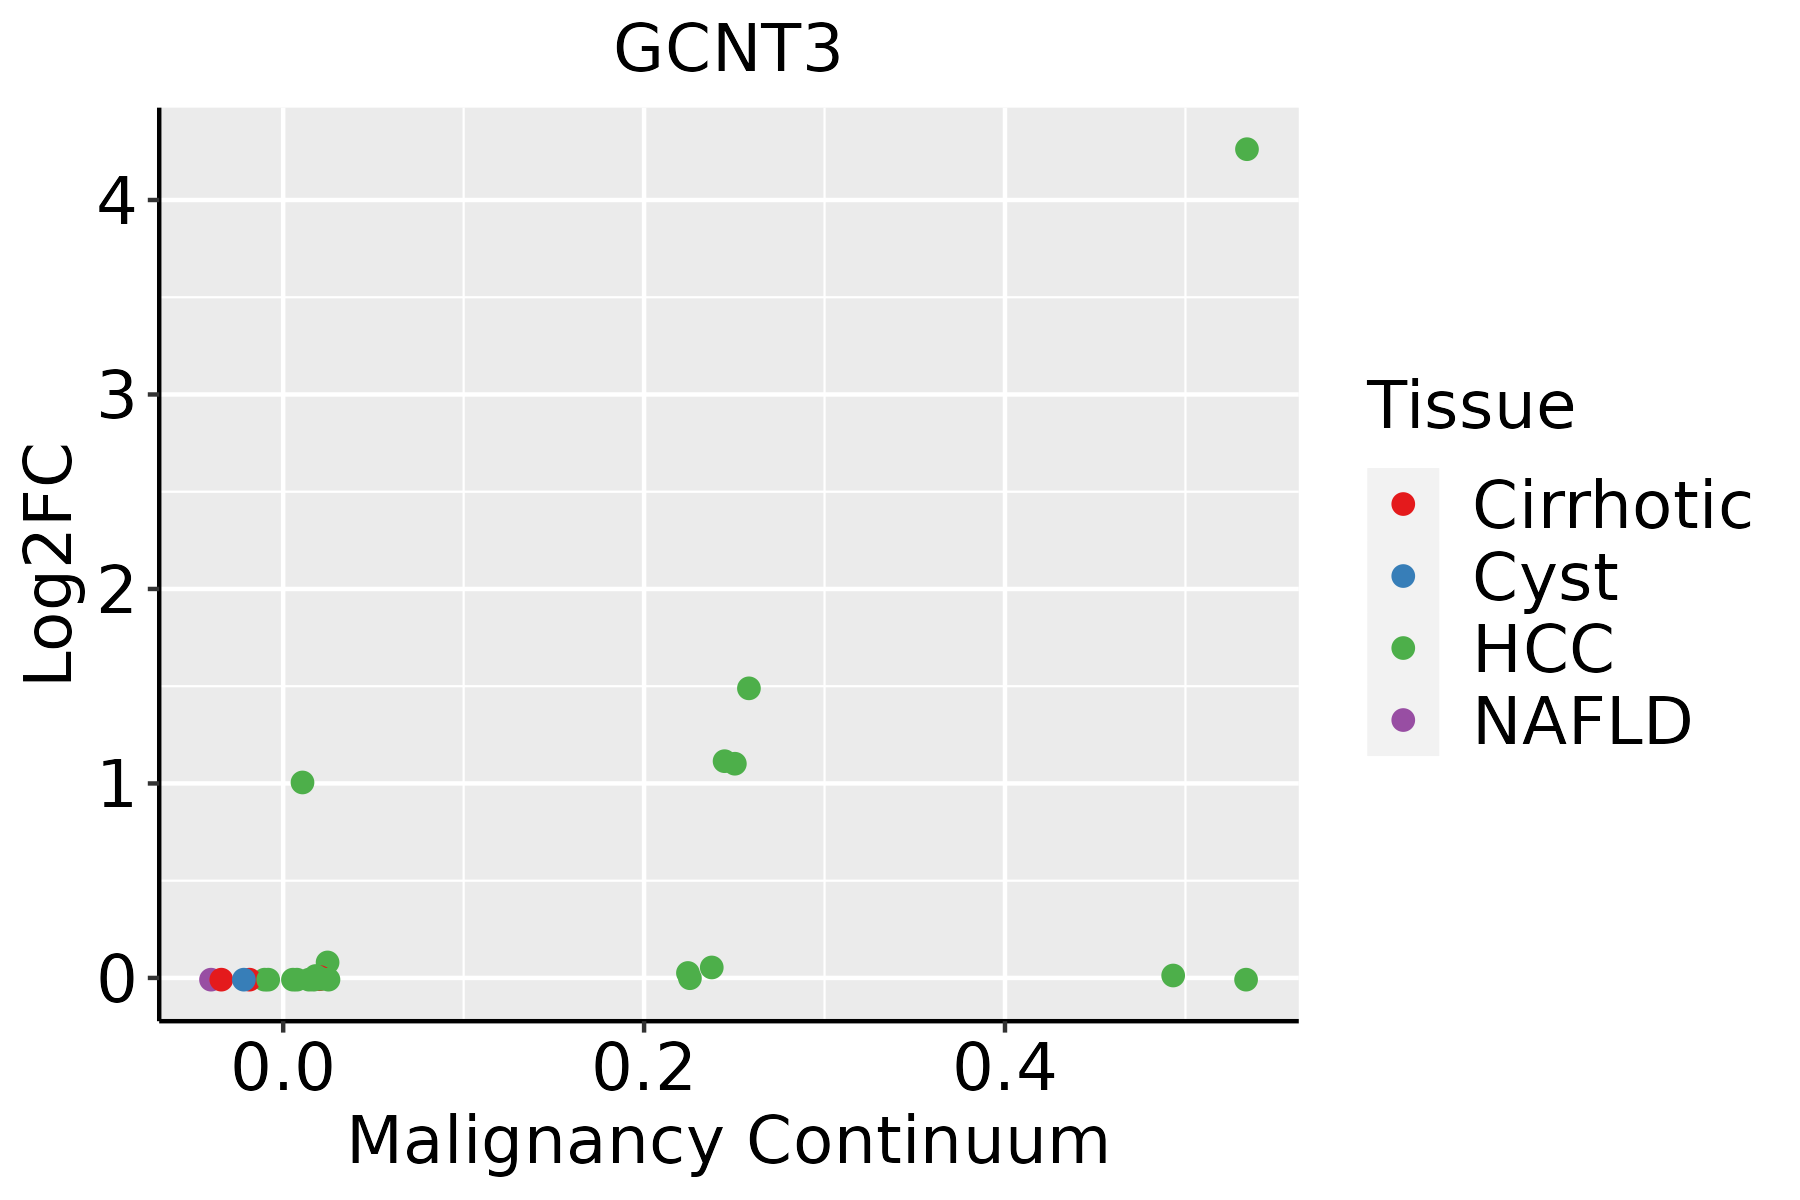 | HCC: Hepatocellular carcinoma |
| NAFLD: Non-alcoholic fatty liver disease |
| ∗log2FC in expression of this searched gene in stem-like cells from each diseased tissue sample relative to stem-like cells in normal samples in each tissue plotted against the malignancy continuum. Samples are colored based on if they are from different disease stage. |
Top |
Malignant transformation related pathway analysis |
| Find out the enriched GO biological processes and KEGG pathways involved in transition from healthy to precancer to cancer |
| Tissue | Disease Stage | Enriched GO biological Processes |
| Colorectum | AD |  |
| Colorectum | SER |  |
| Colorectum | MSS |  |
| Colorectum | MSI-H |  |
| Colorectum | FAP |  |
| ∗Top 15 enriched GO BP terms are showed in the bar plot of each disease state in each tissue. Each row represents a significant GO biological process which is colored according to the -log10(p.adjust). |
| Page: 1 2 3 4 5 6 7 8 9 |
| GO ID | Tissue | Disease Stage | Description | Gene Ratio | Bg Ratio | pvalue | p.adjust | Count |
| GO:0006486 | Colorectum | AD | protein glycosylation | 64/3918 | 226/18723 | 4.86e-03 | 3.27e-02 | 64 |
| GO:0043413 | Colorectum | AD | macromolecule glycosylation | 64/3918 | 226/18723 | 4.86e-03 | 3.27e-02 | 64 |
| GO:0070085 | Colorectum | AD | glycosylation | 67/3918 | 240/18723 | 5.78e-03 | 3.67e-02 | 67 |
| GO:0022600 | Colorectum | SER | digestive system process | 29/2897 | 104/18723 | 8.57e-04 | 1.05e-02 | 29 |
| GO:0050892 | Colorectum | SER | intestinal absorption | 14/2897 | 41/18723 | 2.45e-03 | 2.32e-02 | 14 |
| GO:00508921 | Colorectum | MSS | intestinal absorption | 17/3467 | 41/18723 | 5.48e-04 | 6.10e-03 | 17 |
| GO:00226001 | Colorectum | MSS | digestive system process | 31/3467 | 104/18723 | 3.46e-03 | 2.59e-02 | 31 |
| GO:0001655 | Colorectum | MSS | urogenital system development | 81/3467 | 338/18723 | 6.88e-03 | 4.43e-02 | 81 |
| GO:00016551 | Colorectum | FAP | urogenital system development | 70/2622 | 338/18723 | 4.26e-04 | 5.11e-03 | 70 |
| GO:0072001 | Colorectum | FAP | renal system development | 63/2622 | 302/18723 | 6.59e-04 | 7.19e-03 | 63 |
| GO:0001822 | Colorectum | FAP | kidney development | 61/2622 | 293/18723 | 8.38e-04 | 8.72e-03 | 61 |
| GO:00064861 | Colorectum | FAP | protein glycosylation | 48/2622 | 226/18723 | 1.85e-03 | 1.57e-02 | 48 |
| GO:00434131 | Colorectum | FAP | macromolecule glycosylation | 48/2622 | 226/18723 | 1.85e-03 | 1.57e-02 | 48 |
| GO:00700851 | Colorectum | FAP | glycosylation | 50/2622 | 240/18723 | 2.30e-03 | 1.85e-02 | 50 |
| GO:0009101 | Colorectum | FAP | glycoprotein biosynthetic process | 63/2622 | 317/18723 | 2.31e-03 | 1.86e-02 | 63 |
| GO:00226002 | Colorectum | FAP | digestive system process | 24/2622 | 104/18723 | 8.41e-03 | 4.89e-02 | 24 |
| GO:00508922 | Colorectum | FAP | intestinal absorption | 12/2622 | 41/18723 | 8.57e-03 | 4.96e-02 | 12 |
| GO:00016552 | Colorectum | CRC | urogenital system development | 62/2078 | 338/18723 | 4.67e-05 | 1.10e-03 | 62 |
| GO:00720011 | Colorectum | CRC | renal system development | 56/2078 | 302/18723 | 7.85e-05 | 1.63e-03 | 56 |
| GO:00018221 | Colorectum | CRC | kidney development | 54/2078 | 293/18723 | 1.23e-04 | 2.40e-03 | 54 |
| Page: 1 2 3 |
| Pathway ID | Tissue | Disease Stage | Description | Gene Ratio | Bg Ratio | pvalue | p.adjust | qvalue | Count |
| Page: 1 |
Top |
Cell-cell communication analysis |
| Identification of potential cell-cell interactions between two cell types and their ligand-receptor pairs for different disease states |
| Ligand | Receptor | LRpair | Pathway | Tissue | Disease Stage |
| Page: 1 |
Top |
Single-cell gene regulatory network inference analysis |
| Find out the significant the regulons (TFs) and the target genes of each regulon across cell types for different disease states |
| TF | Cell Type | Tissue | Disease Stage | Target Gene | RSS | Regulon Activity |
| ∗The dot plots of a searched regulon are shown for all cell subpopulations in each disease state of each tissue based on the regulon specific score inferred using pySCENIC and by calculating the average expression. |
| Page: 1 |
Top |
Somatic mutation of malignant transformation related genes |
| Annotation of somatic variants for genes involved in malignant transformation |
| Hugo Symbol | Variant Class | Variant Classification | dbSNP RS | HGVSc | HGVSp | HGVSp Short | SWISSPROT | BIOTYPE | SIFT | PolyPhen | Tumor Sample Barcode | Tissue | Histology | Sex | Age | Stage | Therapy Types | Drugs | Outcome |
| GCNT3 | SNV | Missense_Mutation | c.833T>C | p.Leu278Pro | p.L278P | O95395 | protein_coding | tolerated(0.29) | benign(0.001) | TCGA-A8-A09Z-01 | Breast | breast invasive carcinoma | Female | >=65 | I/II | Unknown | Unknown | SD | |
| GCNT3 | SNV | Missense_Mutation | novel | c.542C>A | p.Ser181Tyr | p.S181Y | O95395 | protein_coding | deleterious(0) | probably_damaging(0.977) | TCGA-EW-A1PC-01 | Breast | breast invasive carcinoma | Female | >=65 | I/II | Hormone Therapy | tamoxiphen | SD |
| GCNT3 | insertion | Frame_Shift_Ins | novel | c.397_398insCACCCACTACCTCTCCCTCACCAGAGACTGTGAGCAC | p.Ile133ThrfsTer21 | p.I133Tfs*21 | O95395 | protein_coding | TCGA-A8-A07U-01 | Breast | breast invasive carcinoma | Female | >=65 | III/IV | Chemotherapy | 5-fluorouracil | SD | ||
| GCNT3 | SNV | Missense_Mutation | novel | c.854C>A | p.Pro285His | p.P285H | O95395 | protein_coding | deleterious(0.03) | probably_damaging(1) | TCGA-EA-A410-01 | Cervix | cervical & endocervical cancer | Female | <65 | I/II | Unknown | Unknown | SD |
| GCNT3 | SNV | Missense_Mutation | c.1076N>G | p.Ser359Cys | p.S359C | O95395 | protein_coding | deleterious(0) | possibly_damaging(0.694) | TCGA-FU-A23L-01 | Cervix | cervical & endocervical cancer | Female | <65 | I/II | Chemotherapy | cisplatin | CR | |
| GCNT3 | SNV | Missense_Mutation | novel | c.911N>G | p.Asp304Gly | p.D304G | O95395 | protein_coding | tolerated(0.48) | benign(0) | TCGA-A6-5665-01 | Colorectum | colon adenocarcinoma | Female | >=65 | I/II | Unknown | Unknown | PD |
| GCNT3 | SNV | Missense_Mutation | novel | c.652N>C | p.Val218Leu | p.V218L | O95395 | protein_coding | deleterious(0.01) | possibly_damaging(0.832) | TCGA-AA-3845-01 | Colorectum | colon adenocarcinoma | Female | >=65 | I/II | Unknown | Unknown | PD |
| GCNT3 | SNV | Missense_Mutation | c.941N>C | p.Lys314Thr | p.K314T | O95395 | protein_coding | tolerated(0.54) | benign(0.054) | TCGA-AD-5900-01 | Colorectum | colon adenocarcinoma | Male | >=65 | I/II | Unknown | Unknown | SD | |
| GCNT3 | SNV | Missense_Mutation | c.933N>T | p.Lys311Asn | p.K311N | O95395 | protein_coding | tolerated(0.33) | benign(0) | TCGA-AG-A002-01 | Colorectum | rectum adenocarcinoma | Male | <65 | I/II | Unknown | Unknown | SD | |
| GCNT3 | SNV | Missense_Mutation | novel | c.117N>A | p.His39Gln | p.H39Q | O95395 | protein_coding | tolerated(0.32) | benign(0.047) | TCGA-AG-A00Y-01 | Colorectum | rectum adenocarcinoma | Male | >=65 | I/II | Unknown | Unknown | PD |
| Page: 1 2 3 4 |
Top |
Related drugs of malignant transformation related genes |
| Identification of chemicals and drugs interact with genes involved in malignant transfromation |
| (DGIdb 4.0) |
| Entrez ID | Symbol | Category | Interaction Types | Drug Claim Name | Drug Name | PMIDs |
| Page: 1 |

Copyright 2023-Present -The University of Texas Health Science Center at Houston |