
|
|||||
|
 | |
| |
| |
| |
| |
| |
|
Gene: GCNT2 |
Gene summary for GCNT2 |
| Gene information | Species | Human | Gene symbol | GCNT2 | Gene ID | 2651 |
| Gene name | glucosaminyl (N-acetyl) transferase 2 (I blood group) | |
| Gene Alias | CCAT | |
| Cytomap | 6p24.3-p24.2 | |
| Gene Type | protein-coding | GO ID | GO:0000165 | UniProtAcc | Q8N0V5 |
Top |
Malignant transformation analysis |
| Identification of the aberrant gene expression in precancerous and cancerous lesions by comparing the gene expression of stem-like cells in diseased tissues with normal stem cells |
| Entrez ID | Symbol | Replicates | Species | Organ | Tissue | Adj P-value | Log2FC | Malignancy |
| 2651 | GCNT2 | CCI_1 | Human | Cervix | CC | 8.02e-07 | 5.96e-01 | 0.528 |
| 2651 | GCNT2 | CCI_2 | Human | Cervix | CC | 3.18e-17 | 1.13e+00 | 0.5249 |
| 2651 | GCNT2 | H2 | Human | Cervix | HSIL_HPV | 1.12e-04 | 2.34e-01 | 0.0632 |
| 2651 | GCNT2 | T2 | Human | Cervix | CC | 1.12e-02 | 2.88e-01 | 0.0709 |
| 2651 | GCNT2 | HTA11_3410_2000001011 | Human | Colorectum | AD | 2.33e-07 | -4.02e-01 | 0.0155 |
| 2651 | GCNT2 | HTA11_347_2000001011 | Human | Colorectum | AD | 3.93e-10 | 5.13e-01 | -0.1954 |
| 2651 | GCNT2 | HTA11_83_2000001011 | Human | Colorectum | SER | 3.93e-05 | 8.41e-01 | -0.1526 |
| 2651 | GCNT2 | HTA11_866_3004761011 | Human | Colorectum | AD | 1.64e-08 | -4.23e-01 | 0.096 |
| 2651 | GCNT2 | HTA11_10711_2000001011 | Human | Colorectum | AD | 3.17e-03 | -4.08e-01 | 0.0338 |
| 2651 | GCNT2 | HTA11_7696_3000711011 | Human | Colorectum | AD | 1.06e-18 | -4.25e-01 | 0.0674 |
| 2651 | GCNT2 | HTA11_99999970781_79442 | Human | Colorectum | MSS | 1.09e-14 | -4.06e-01 | 0.294 |
| 2651 | GCNT2 | HTA11_99999971662_82457 | Human | Colorectum | MSS | 3.45e-02 | -2.21e-01 | 0.3859 |
| 2651 | GCNT2 | HTA11_99999973899_84307 | Human | Colorectum | MSS | 3.06e-03 | -4.29e-01 | 0.2585 |
| 2651 | GCNT2 | HTA11_99999974143_84620 | Human | Colorectum | MSS | 4.74e-12 | -3.68e-01 | 0.3005 |
| 2651 | GCNT2 | F007 | Human | Colorectum | FAP | 1.09e-06 | -4.29e-01 | 0.1176 |
| 2651 | GCNT2 | A002-C-010 | Human | Colorectum | FAP | 2.61e-19 | -4.25e-01 | 0.242 |
| 2651 | GCNT2 | A001-C-207 | Human | Colorectum | FAP | 8.79e-10 | -4.29e-01 | 0.1278 |
| 2651 | GCNT2 | A015-C-203 | Human | Colorectum | FAP | 5.00e-19 | -3.99e-01 | -0.1294 |
| 2651 | GCNT2 | A015-C-204 | Human | Colorectum | FAP | 5.56e-10 | -4.29e-01 | -0.0228 |
| 2651 | GCNT2 | A014-C-040 | Human | Colorectum | FAP | 1.99e-02 | -4.29e-01 | -0.1184 |
| Page: 1 2 3 4 5 6 |
| Tissue | Expression Dynamics | Abbreviation |
| Cervix |  | CC: Cervix cancer |
| HSIL_HPV: HPV-infected high-grade squamous intraepithelial lesions | ||
| N_HPV: HPV-infected normal cervix | ||
| Colorectum (GSE201348) |  | FAP: Familial adenomatous polyposis |
| CRC: Colorectal cancer | ||
| Colorectum (HTA11) | 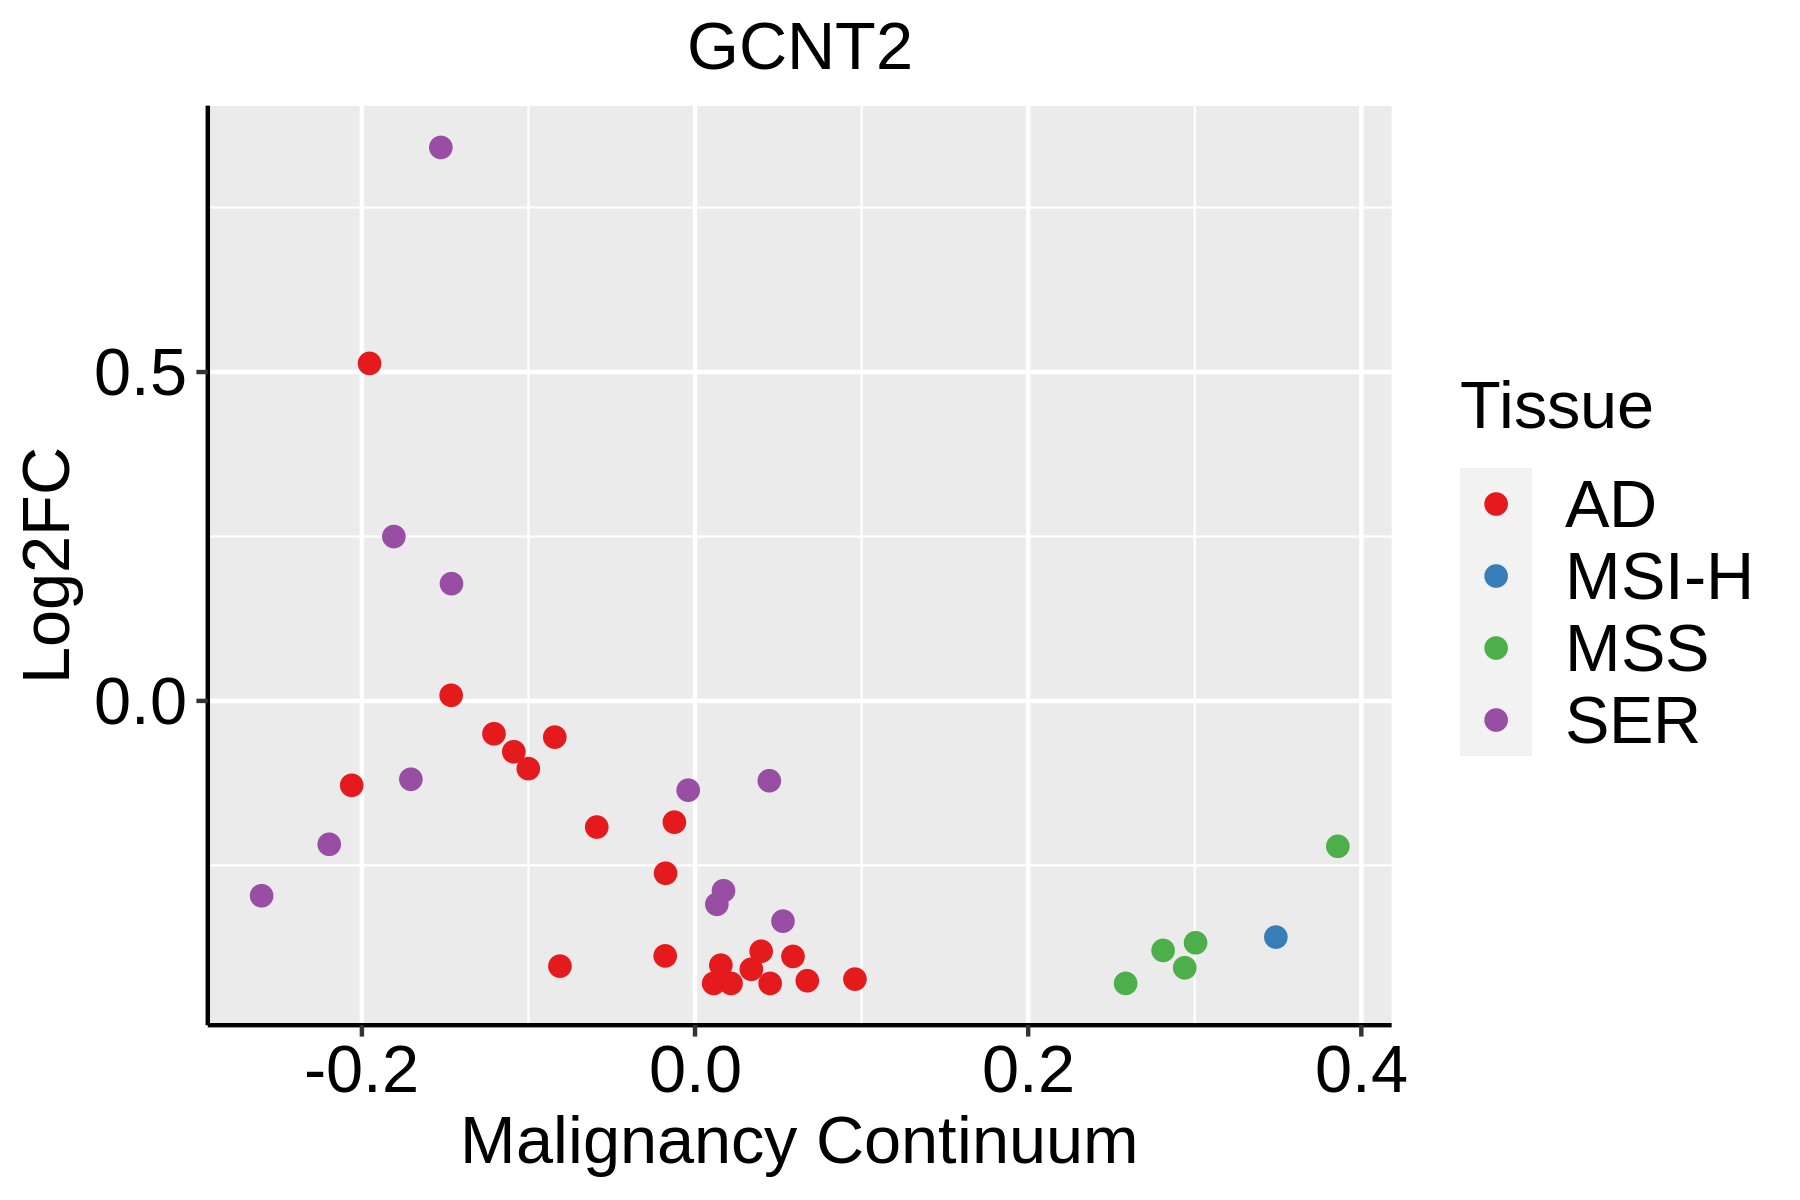 | AD: Adenomas |
| SER: Sessile serrated lesions | ||
| MSI-H: Microsatellite-high colorectal cancer | ||
| MSS: Microsatellite stable colorectal cancer | ||
| Endometrium | 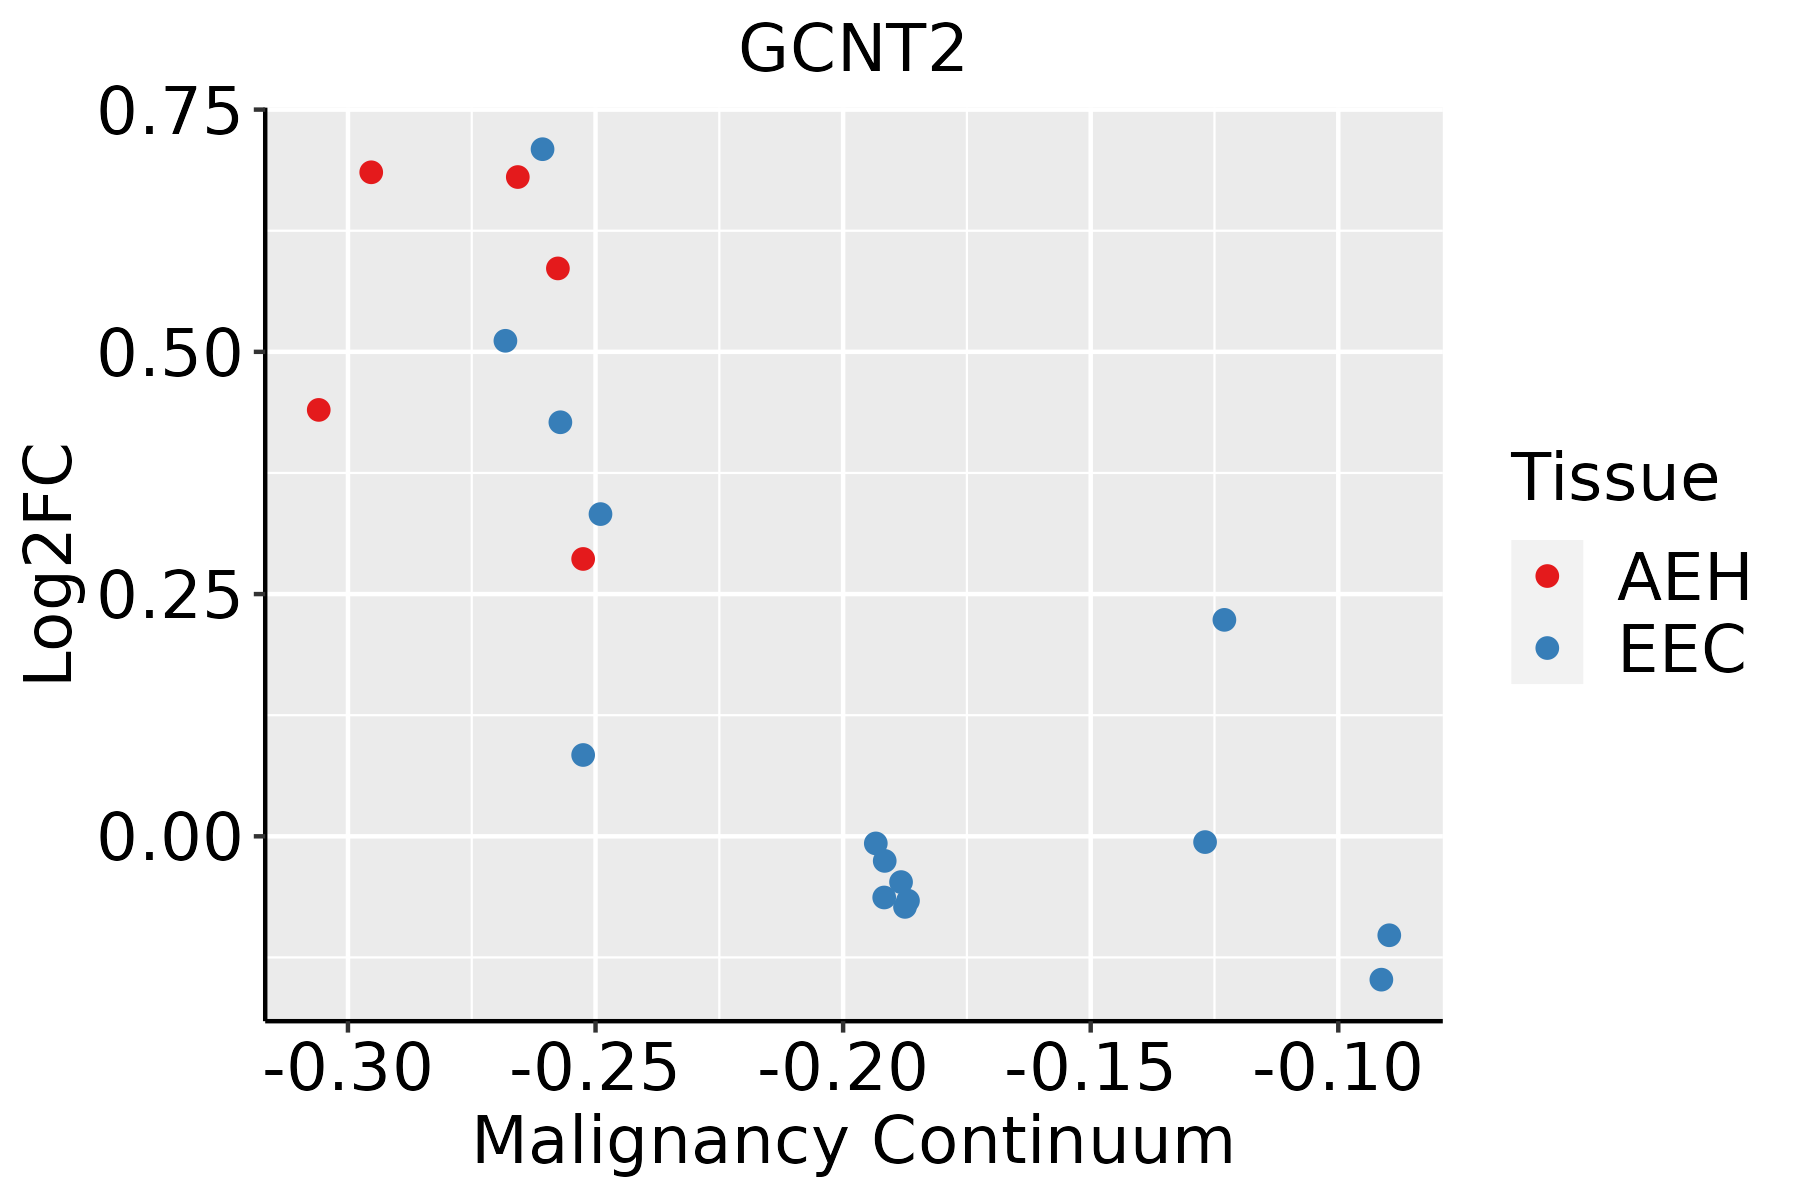 | AEH: Atypical endometrial hyperplasia |
| EEC: Endometrioid Cancer | ||
| Esophagus |  | ESCC: Esophageal squamous cell carcinoma |
| HGIN: High-grade intraepithelial neoplasias | ||
| LGIN: Low-grade intraepithelial neoplasias | ||
| Liver | 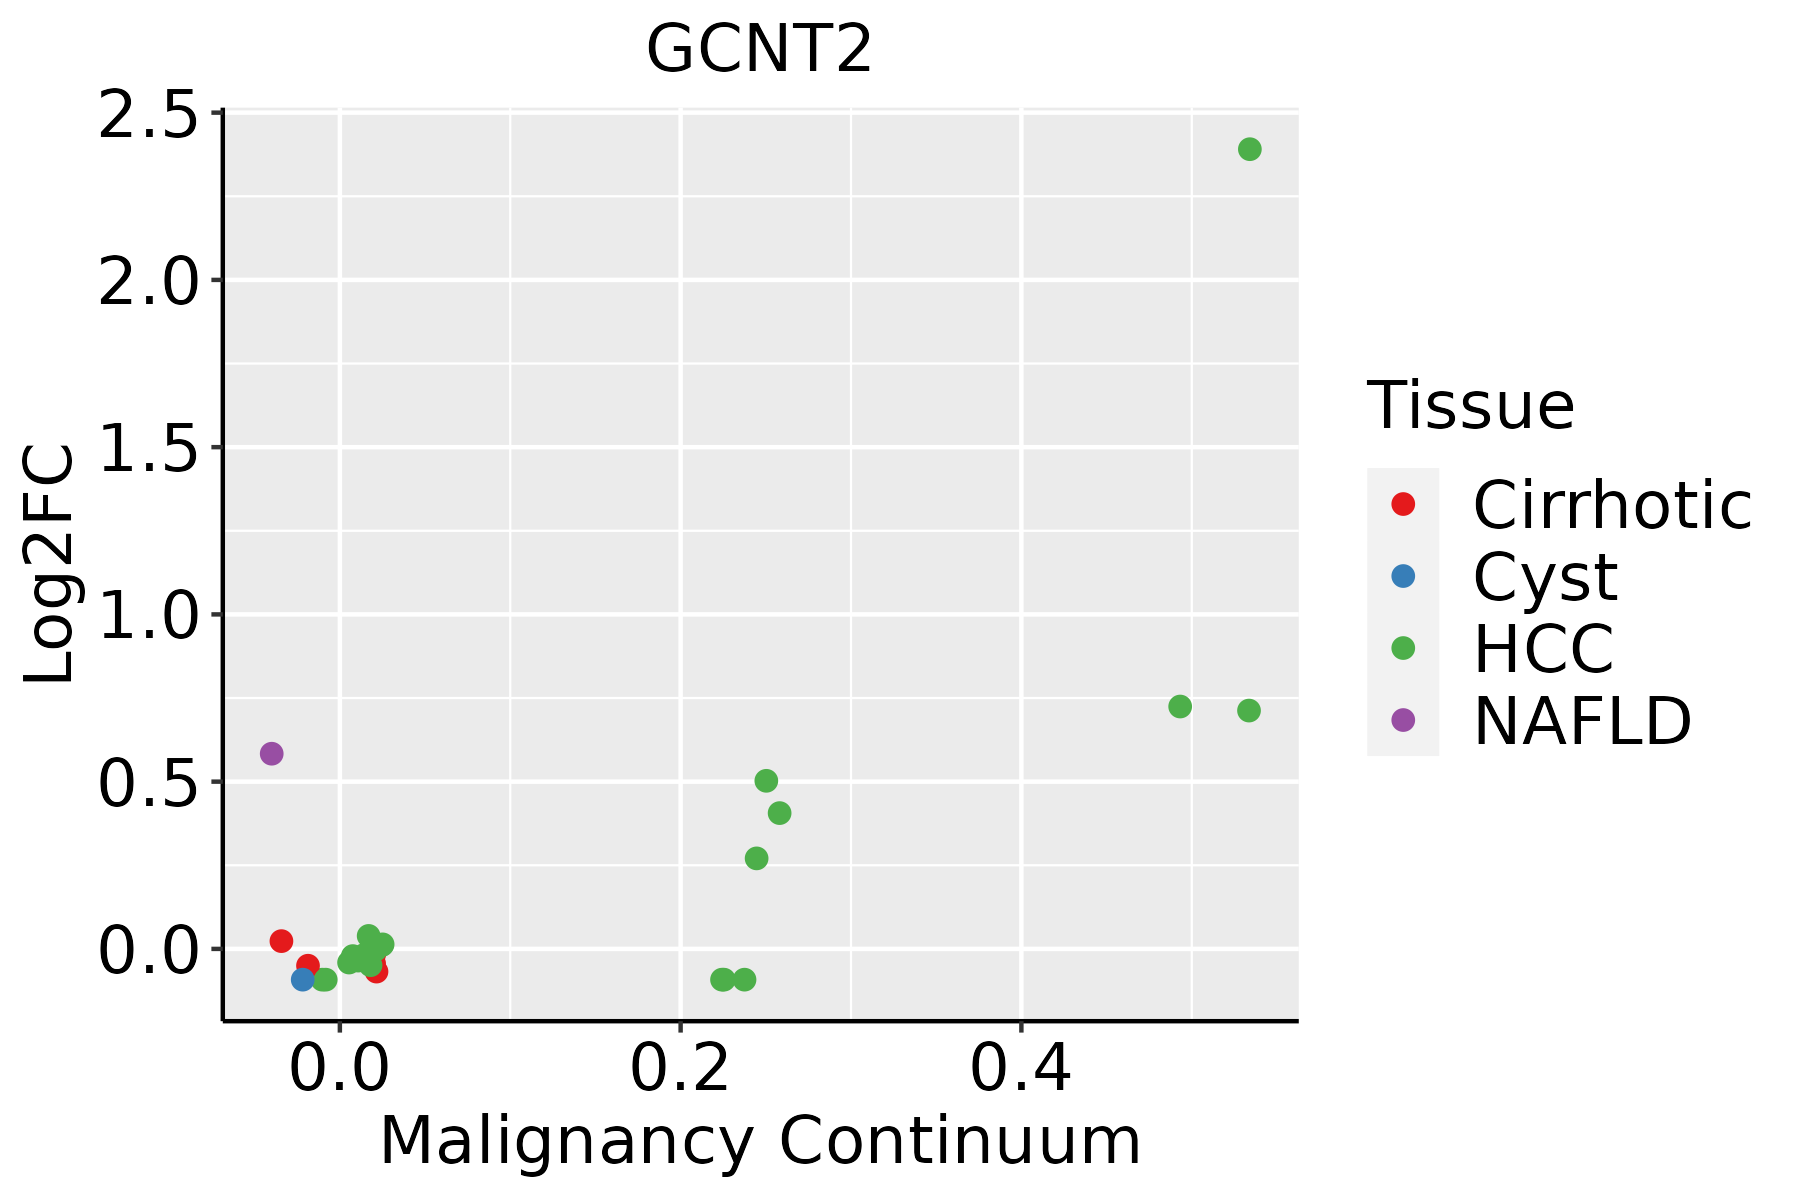 | HCC: Hepatocellular carcinoma |
| NAFLD: Non-alcoholic fatty liver disease | ||
| Lung | 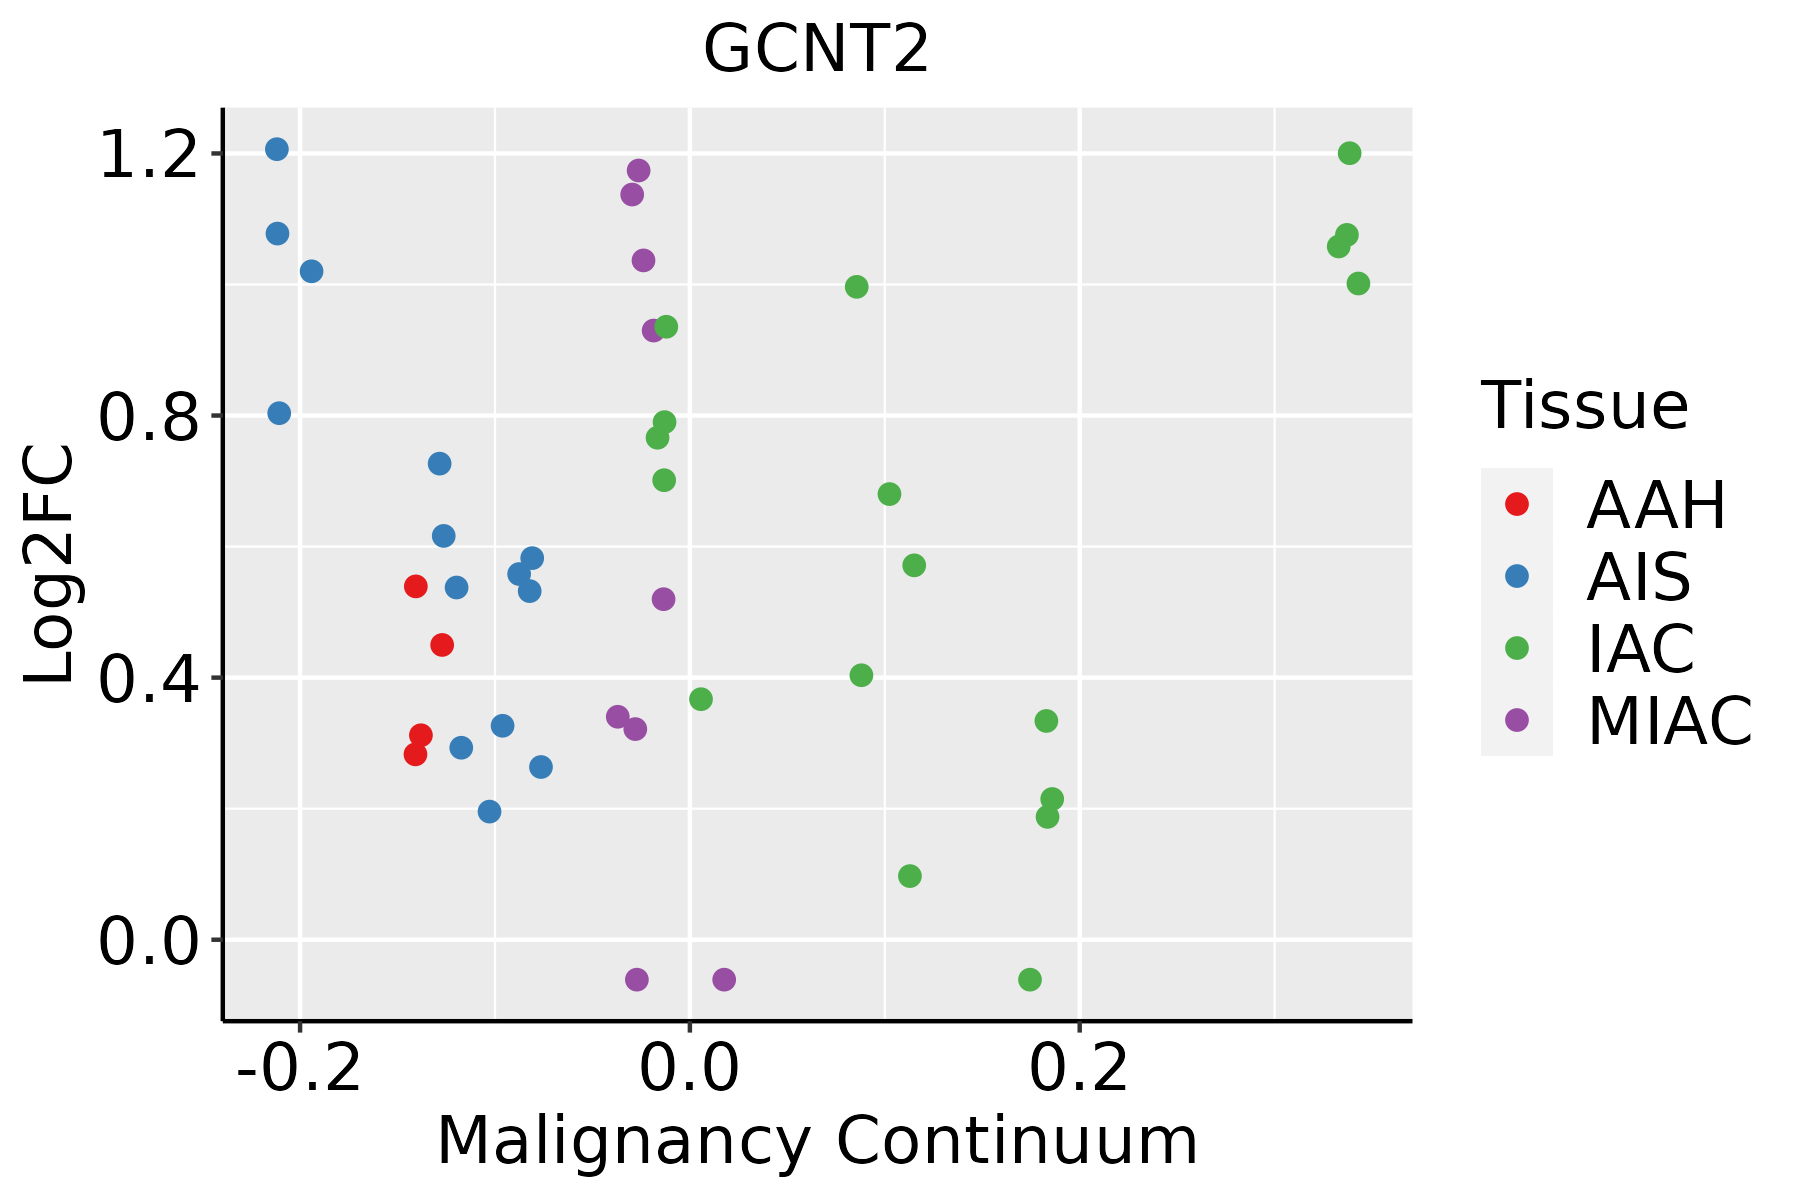 | AAH: Atypical adenomatous hyperplasia |
| AIS: Adenocarcinoma in situ | ||
| IAC: Invasive lung adenocarcinoma | ||
| MIA: Minimally invasive adenocarcinoma |
| ∗log2FC in expression of this searched gene in stem-like cells from each diseased tissue sample relative to stem-like cells in normal samples in each tissue plotted against the malignancy continuum. Samples are colored based on if they are from different disease stage. |
Top |
Malignant transformation related pathway analysis |
| Find out the enriched GO biological processes and KEGG pathways involved in transition from healthy to precancer to cancer |
| Tissue | Disease Stage | Enriched GO biological Processes |
| Colorectum | AD |  |
| Colorectum | SER |  |
| Colorectum | MSS |  |
| Colorectum | MSI-H |  |
| Colorectum | FAP |  |
| ∗Top 15 enriched GO BP terms are showed in the bar plot of each disease state in each tissue. Each row represents a significant GO biological process which is colored according to the -log10(p.adjust). |
| Page: 1 2 3 4 5 6 7 8 9 |
| GO ID | Tissue | Disease Stage | Description | Gene Ratio | Bg Ratio | pvalue | p.adjust | Count |
| GO:001081010 | Cervix | CC | regulation of cell-substrate adhesion | 69/2311 | 221/18723 | 8.57e-14 | 5.69e-11 | 69 |
| GO:00315898 | Cervix | CC | cell-substrate adhesion | 96/2311 | 363/18723 | 1.48e-13 | 8.85e-11 | 96 |
| GO:002240710 | Cervix | CC | regulation of cell-cell adhesion | 103/2311 | 448/18723 | 1.78e-10 | 2.87e-08 | 103 |
| GO:004578510 | Cervix | CC | positive regulation of cell adhesion | 101/2311 | 437/18723 | 1.96e-10 | 3.08e-08 | 101 |
| GO:00071626 | Cervix | CC | negative regulation of cell adhesion | 72/2311 | 303/18723 | 2.36e-08 | 1.70e-06 | 72 |
| GO:00224099 | Cervix | CC | positive regulation of cell-cell adhesion | 61/2311 | 284/18723 | 9.30e-06 | 2.11e-04 | 61 |
| GO:00018949 | Cervix | CC | tissue homeostasis | 57/2311 | 268/18723 | 2.43e-05 | 4.21e-04 | 57 |
| GO:00434104 | Cervix | CC | positive regulation of MAPK cascade | 90/2311 | 480/18723 | 2.92e-05 | 4.83e-04 | 90 |
| GO:00108122 | Cervix | CC | negative regulation of cell-substrate adhesion | 21/2311 | 68/18723 | 4.35e-05 | 6.66e-04 | 21 |
| GO:00602498 | Cervix | CC | anatomical structure homeostasis | 63/2311 | 314/18723 | 6.03e-05 | 8.68e-04 | 63 |
| GO:00071786 | Cervix | CC | transmembrane receptor protein serine/threonine kinase signaling pathway | 67/2311 | 355/18723 | 2.39e-04 | 2.67e-03 | 67 |
| GO:00518964 | Cervix | CC | regulation of protein kinase B signaling | 39/2311 | 185/18723 | 5.25e-04 | 5.10e-03 | 39 |
| GO:00518973 | Cervix | CC | positive regulation of protein kinase B signaling | 28/2311 | 120/18723 | 5.90e-04 | 5.59e-03 | 28 |
| GO:00434913 | Cervix | CC | protein kinase B signaling | 43/2311 | 211/18723 | 5.95e-04 | 5.60e-03 | 43 |
| GO:00715595 | Cervix | CC | response to transforming growth factor beta | 50/2311 | 256/18723 | 6.31e-04 | 5.91e-03 | 50 |
| GO:00715605 | Cervix | CC | cellular response to transforming growth factor beta stimulus | 49/2311 | 250/18723 | 6.55e-04 | 6.05e-03 | 49 |
| GO:00703714 | Cervix | CC | ERK1 and ERK2 cascade | 60/2311 | 330/18723 | 1.28e-03 | 1.02e-02 | 60 |
| GO:00071795 | Cervix | CC | transforming growth factor beta receptor signaling pathway | 38/2311 | 198/18723 | 3.62e-03 | 2.31e-02 | 38 |
| GO:00703723 | Cervix | CC | regulation of ERK1 and ERK2 cascade | 54/2311 | 309/18723 | 5.11e-03 | 3.02e-02 | 54 |
| GO:00018374 | Cervix | CC | epithelial to mesenchymal transition | 31/2311 | 157/18723 | 5.25e-03 | 3.08e-02 | 31 |
| Page: 1 2 3 4 5 6 7 8 9 10 11 |
| Pathway ID | Tissue | Disease Stage | Description | Gene Ratio | Bg Ratio | pvalue | p.adjust | qvalue | Count |
| Page: 1 |
Top |
Cell-cell communication analysis |
| Identification of potential cell-cell interactions between two cell types and their ligand-receptor pairs for different disease states |
| Ligand | Receptor | LRpair | Pathway | Tissue | Disease Stage |
| Page: 1 |
Top |
Single-cell gene regulatory network inference analysis |
| Find out the significant the regulons (TFs) and the target genes of each regulon across cell types for different disease states |
| TF | Cell Type | Tissue | Disease Stage | Target Gene | RSS | Regulon Activity |
| ∗The dot plots of a searched regulon are shown for all cell subpopulations in each disease state of each tissue based on the regulon specific score inferred using pySCENIC and by calculating the average expression. |
| Page: 1 |
Top |
Somatic mutation of malignant transformation related genes |
| Annotation of somatic variants for genes involved in malignant transformation |
| Hugo Symbol | Variant Class | Variant Classification | dbSNP RS | HGVSc | HGVSp | HGVSp Short | SWISSPROT | BIOTYPE | SIFT | PolyPhen | Tumor Sample Barcode | Tissue | Histology | Sex | Age | Stage | Therapy Types | Drugs | Outcome |
| GCNT2 | SNV | Missense_Mutation | novel | c.283N>G | p.Phe95Val | p.F95V | Q8N0V5 | protein_coding | deleterious(0) | probably_damaging(0.992) | TCGA-D8-A1Y3-01 | Breast | breast invasive carcinoma | Female | <65 | III/IV | Chemotherapy | doxorubicine+cyclophosphamide | SD |
| GCNT2 | insertion | Frame_Shift_Ins | novel | c.986_987insGTTTCTCAAATGGGGTGATTTTGCTCACCCACAGGACATTTGGCAA | p.Ser329ArgfsTer17 | p.S329Rfs*17 | Q8N0V5 | protein_coding | TCGA-A2-A0T2-01 | Breast | breast invasive carcinoma | Female | >=65 | III/IV | Chemotherapy | xeloda | PD | ||
| GCNT2 | deletion | Frame_Shift_Del | novel | c.812delN | p.Asp272ThrfsTer31 | p.D272Tfs*31 | Q8N0V5 | protein_coding | TCGA-EW-A2FV-01 | Breast | breast invasive carcinoma | Female | <65 | III/IV | Chemotherapy | docetaxel | SD | ||
| GCNT2 | SNV | Missense_Mutation | novel | c.541N>A | p.Glu181Lys | p.E181K | Q8N0V5 | protein_coding | tolerated(1) | benign(0.001) | TCGA-JW-A5VL-01 | Cervix | cervical & endocervical cancer | Female | <65 | I/II | Unknown | Unknown | SD |
| GCNT2 | SNV | Missense_Mutation | c.454N>A | p.Leu152Met | p.L152M | Q8N0V5 | protein_coding | deleterious(0.02) | possibly_damaging(0.61) | TCGA-AA-3510-01 | Colorectum | colon adenocarcinoma | Male | >=65 | I/II | Unknown | Unknown | SD | |
| GCNT2 | SNV | Missense_Mutation | novel | c.562N>G | p.Ile188Val | p.I188V | Q8N0V5 | protein_coding | tolerated(0.07) | possibly_damaging(0.517) | TCGA-AA-3947-01 | Colorectum | colon adenocarcinoma | Female | <65 | I/II | Unknown | Unknown | SD |
| GCNT2 | SNV | Missense_Mutation | c.1160G>T | p.Arg387Ile | p.R387I | Q8N0V5 | protein_coding | deleterious(0) | probably_damaging(0.99) | TCGA-AA-3977-01 | Colorectum | colon adenocarcinoma | Male | >=65 | I/II | Unknown | Unknown | SD | |
| GCNT2 | SNV | Missense_Mutation | rs368989684 | c.457N>A | p.Ala153Thr | p.A153T | Q8N0V5 | protein_coding | deleterious(0.03) | possibly_damaging(0.688) | TCGA-AA-3984-01 | Colorectum | colon adenocarcinoma | Female | <65 | I/II | Unknown | Unknown | SD |
| GCNT2 | SNV | Missense_Mutation | rs773968312 | c.694G>A | p.Val232Ile | p.V232I | Q8N0V5 | protein_coding | tolerated(0.13) | benign(0.059) | TCGA-AA-A03J-01 | Colorectum | colon adenocarcinoma | Female | >=65 | I/II | Unknown | Unknown | SD |
| GCNT2 | SNV | Missense_Mutation | c.143N>T | p.Ala48Val | p.A48V | Q8N0V5 | protein_coding | tolerated(1) | benign(0.007) | TCGA-AD-6964-01 | Colorectum | colon adenocarcinoma | Male | <65 | III/IV | Chemotherapy | folfox | PD |
| Page: 1 2 3 4 5 |
Top |
Related drugs of malignant transformation related genes |
| Identification of chemicals and drugs interact with genes involved in malignant transfromation |
| (DGIdb 4.0) |
| Entrez ID | Symbol | Category | Interaction Types | Drug Claim Name | Drug Name | PMIDs |
| Page: 1 |

Copyright 2023-Present -The University of Texas Health Science Center at Houston |