
|
|||||
|
 | |
| |
| |
| |
| |
| |
|
Gene: GCNT1 |
Gene summary for GCNT1 |
| Gene information | Species | Human | Gene symbol | GCNT1 | Gene ID | 2650 |
| Gene name | glucosaminyl (N-acetyl) transferase 1 | |
| Gene Alias | C2GNT | |
| Cytomap | 9q21.13 | |
| Gene Type | protein-coding | GO ID | GO:0001655 | UniProtAcc | Q02742 |
Top |
Malignant transformation analysis |
| Identification of the aberrant gene expression in precancerous and cancerous lesions by comparing the gene expression of stem-like cells in diseased tissues with normal stem cells |
| Entrez ID | Symbol | Replicates | Species | Organ | Tissue | Adj P-value | Log2FC | Malignancy |
| 2650 | GCNT1 | CCI_3 | Human | Cervix | CC | 1.91e-02 | 6.36e-01 | 0.516 |
| 2650 | GCNT1 | CCII_1 | Human | Cervix | CC | 8.39e-13 | 8.16e-01 | 0.3249 |
| 2650 | GCNT1 | AEH-subject1 | Human | Endometrium | AEH | 2.58e-45 | 9.37e-01 | -0.3059 |
| 2650 | GCNT1 | AEH-subject2 | Human | Endometrium | AEH | 4.44e-43 | 1.05e+00 | -0.2525 |
| 2650 | GCNT1 | AEH-subject3 | Human | Endometrium | AEH | 2.77e-19 | 6.34e-01 | -0.2576 |
| 2650 | GCNT1 | AEH-subject4 | Human | Endometrium | AEH | 2.01e-04 | 3.74e-01 | -0.2657 |
| 2650 | GCNT1 | EEC-subject1 | Human | Endometrium | EEC | 1.86e-14 | 5.85e-01 | -0.2682 |
| 2650 | GCNT1 | EEC-subject2 | Human | Endometrium | EEC | 4.79e-41 | 8.94e-01 | -0.2607 |
| 2650 | GCNT1 | EEC-subject5 | Human | Endometrium | EEC | 6.29e-03 | 3.20e-01 | -0.249 |
| 2650 | GCNT1 | GSM5276934 | Human | Endometrium | EEC | 5.67e-10 | -2.26e-01 | -0.0913 |
| 2650 | GCNT1 | GSM6177620_NYU_UCEC1_lib1_lib1 | Human | Endometrium | EEC | 1.39e-04 | -2.36e-02 | -0.1869 |
| 2650 | GCNT1 | GSM6177620_NYU_UCEC1_lib2_lib2 | Human | Endometrium | EEC | 2.26e-04 | -7.36e-02 | -0.1875 |
| 2650 | GCNT1 | GSM6177620_NYU_UCEC1_lib3_lib3 | Human | Endometrium | EEC | 9.23e-04 | -4.59e-02 | -0.1883 |
| 2650 | GCNT1 | GSM6177621_NYU_UCEC2_lib1_lib1 | Human | Endometrium | EEC | 9.59e-13 | 4.03e-01 | -0.1934 |
| 2650 | GCNT1 | GSM6177622_NYU_UCEC3_lib1_lib1 | Human | Endometrium | EEC | 1.23e-07 | -1.83e-01 | -0.1917 |
| 2650 | GCNT1 | GSM6177622_NYU_UCEC3_lib2_lib2 | Human | Endometrium | EEC | 2.20e-07 | -1.06e-01 | -0.1916 |
| 2650 | GCNT1 | LZE5T | Human | Esophagus | ESCC | 1.16e-04 | 5.63e-01 | 0.0514 |
| 2650 | GCNT1 | LZE20T | Human | Esophagus | ESCC | 6.27e-03 | 1.20e-01 | 0.0662 |
| 2650 | GCNT1 | P5T-E | Human | Esophagus | ESCC | 2.87e-06 | 1.08e-01 | 0.1327 |
| 2650 | GCNT1 | P8T-E | Human | Esophagus | ESCC | 1.89e-08 | 2.45e-01 | 0.0889 |
| Page: 1 2 3 4 5 |
| Tissue | Expression Dynamics | Abbreviation |
| Cervix | 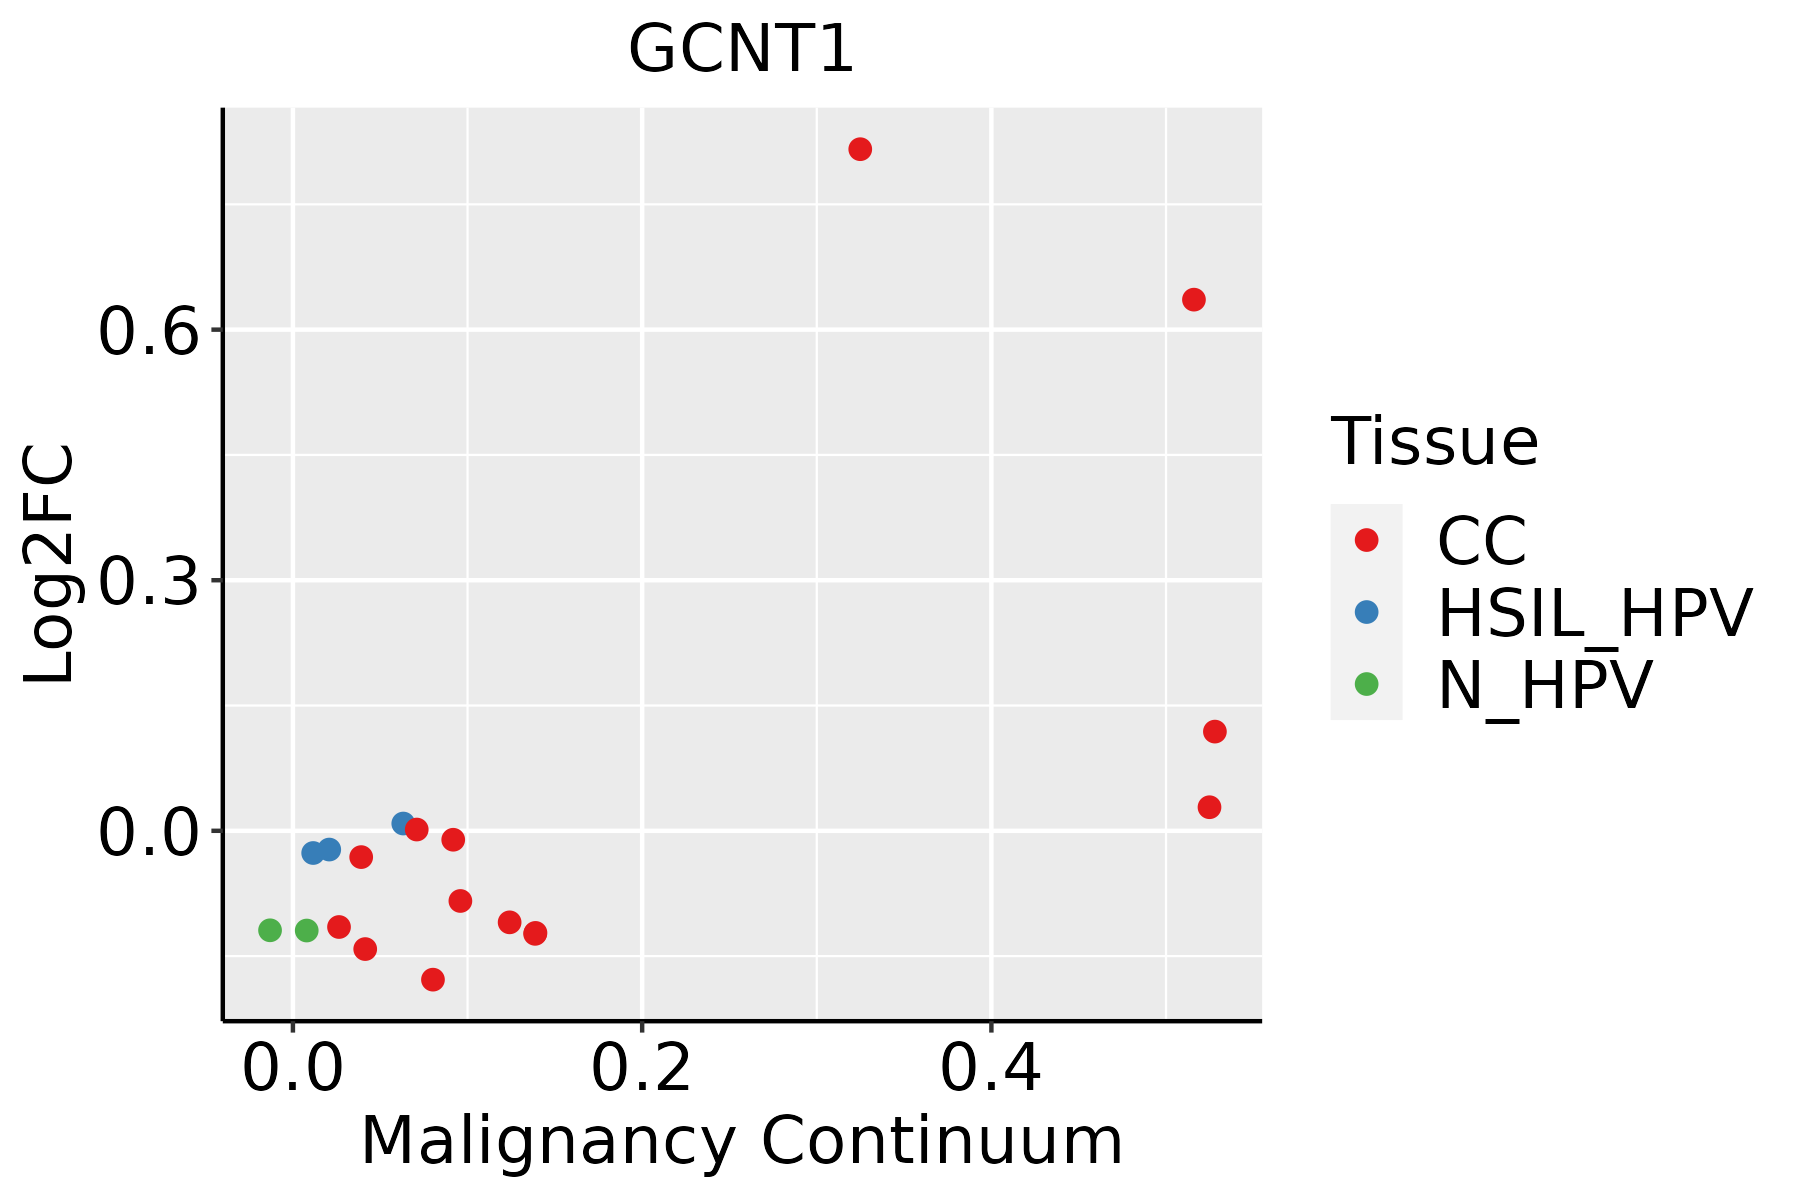 | CC: Cervix cancer |
| HSIL_HPV: HPV-infected high-grade squamous intraepithelial lesions | ||
| N_HPV: HPV-infected normal cervix | ||
| Endometrium |  | AEH: Atypical endometrial hyperplasia |
| EEC: Endometrioid Cancer | ||
| Esophagus |  | ESCC: Esophageal squamous cell carcinoma |
| HGIN: High-grade intraepithelial neoplasias | ||
| LGIN: Low-grade intraepithelial neoplasias | ||
| GC | 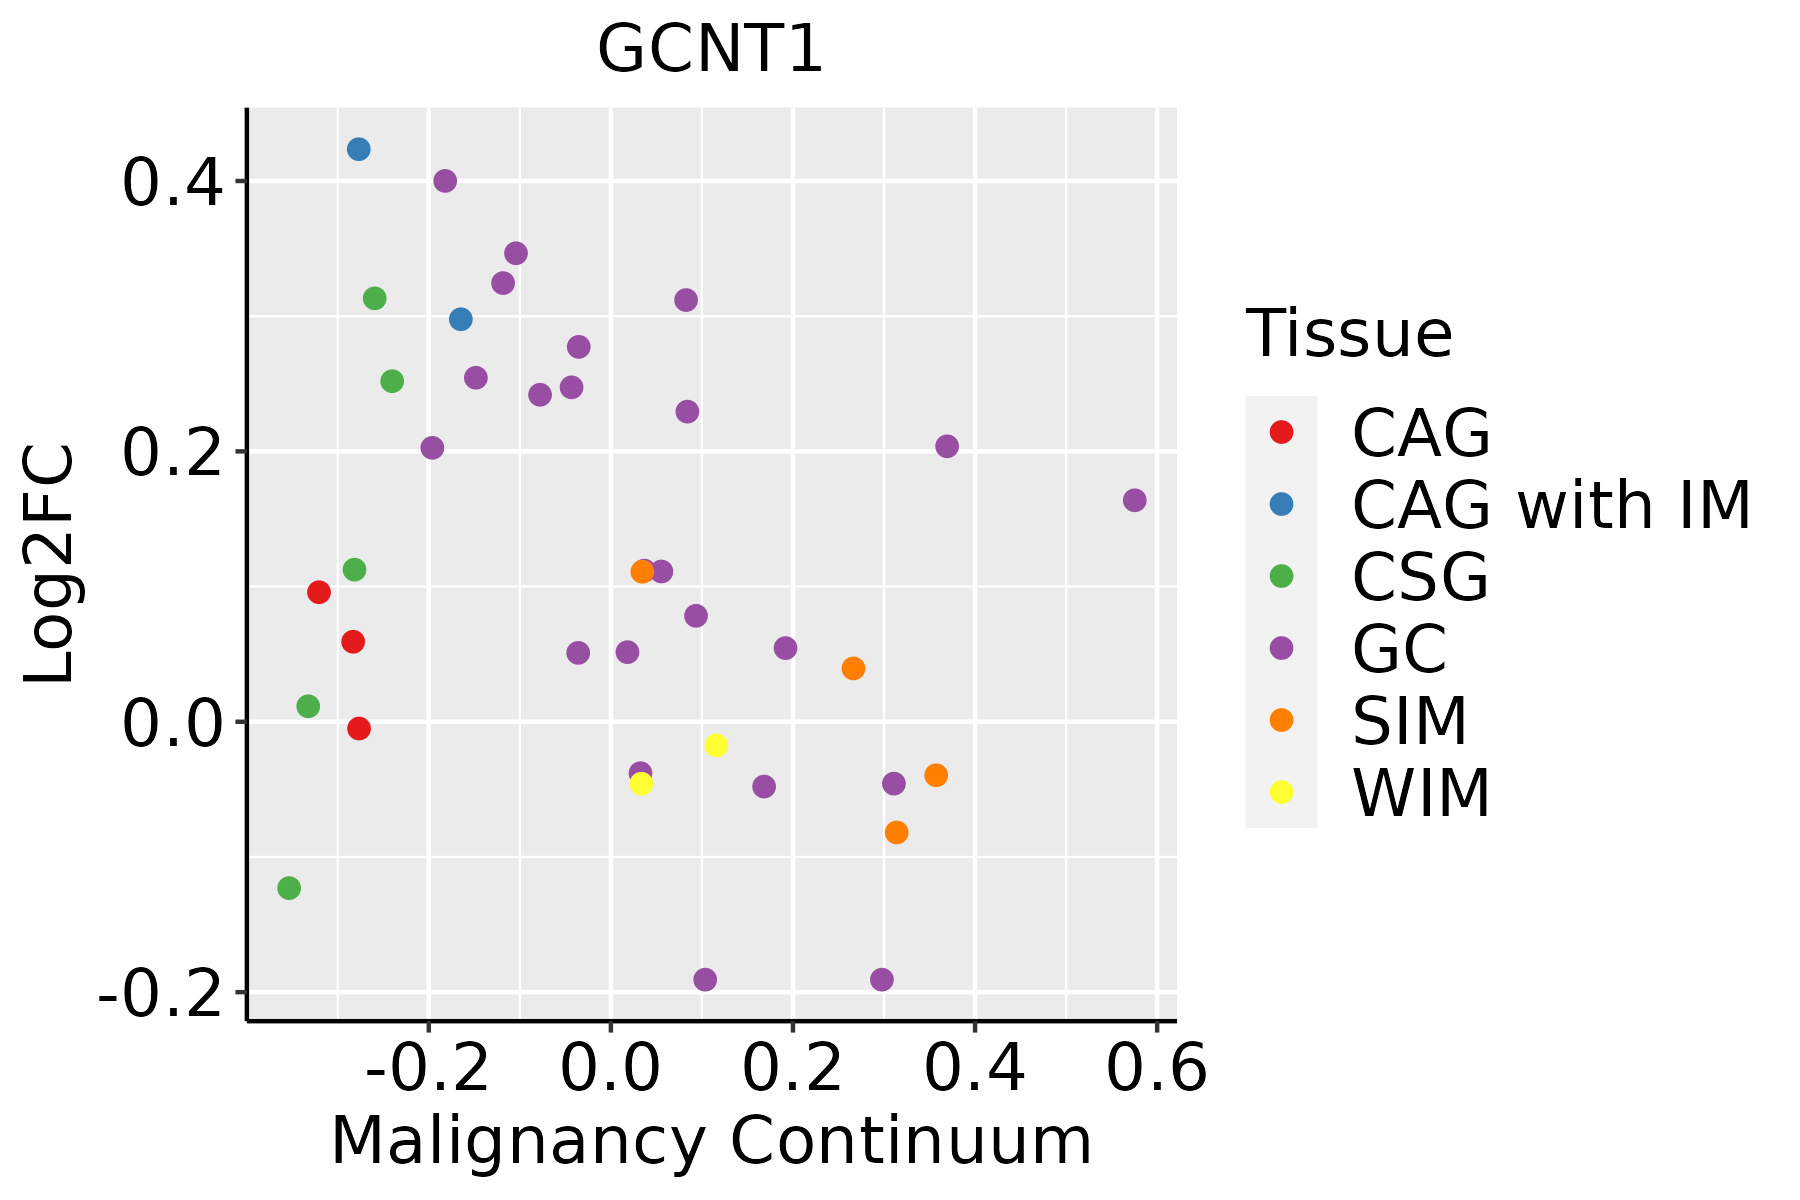 | CAG: Chronic atrophic gastritis |
| CAG with IM: Chronic atrophic gastritis with intestinal metaplasia | ||
| CSG: Chronic superficial gastritis | ||
| GC: Gastric cancer | ||
| SIM: Severe intestinal metaplasia | ||
| WIM: Wild intestinal metaplasia | ||
| Liver |  | HCC: Hepatocellular carcinoma |
| NAFLD: Non-alcoholic fatty liver disease | ||
| Lung | 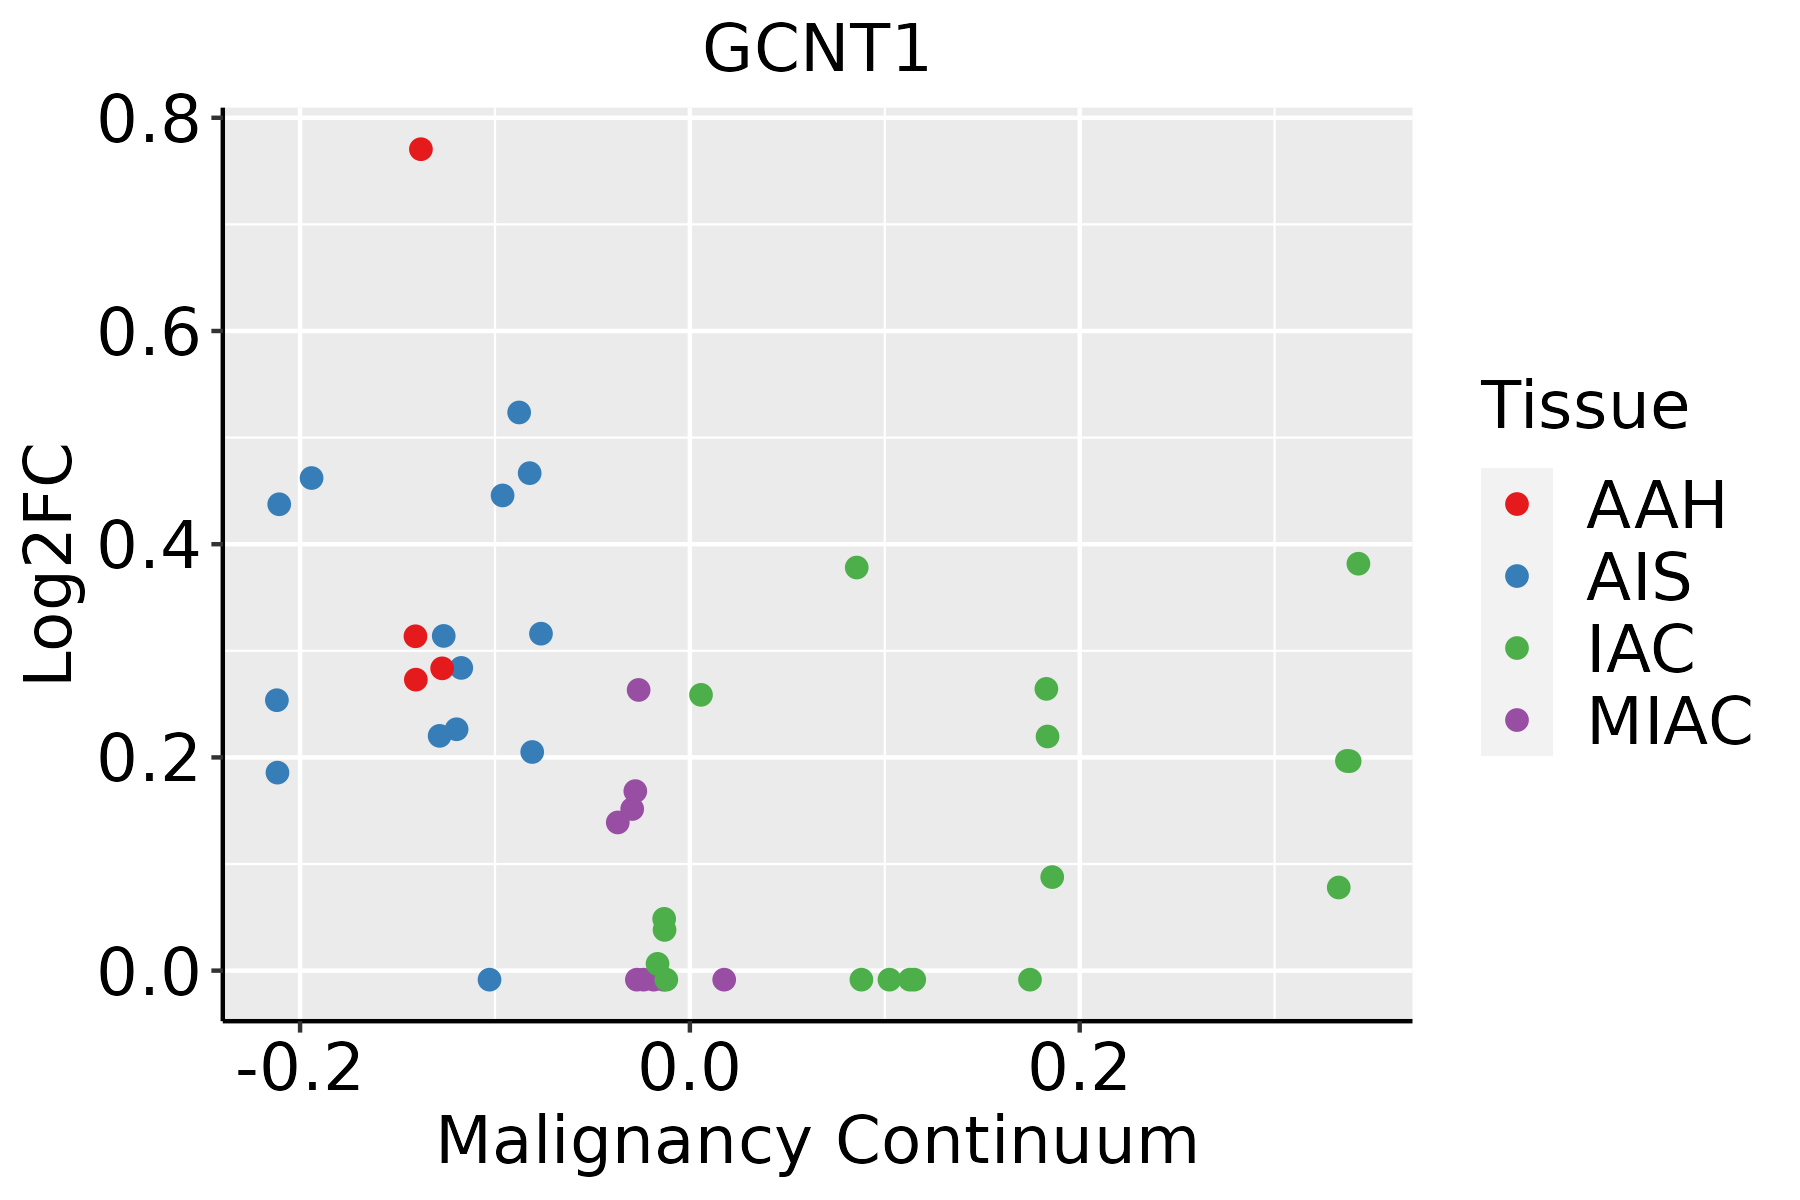 | AAH: Atypical adenomatous hyperplasia |
| AIS: Adenocarcinoma in situ | ||
| IAC: Invasive lung adenocarcinoma | ||
| MIA: Minimally invasive adenocarcinoma | ||
| Thyroid | 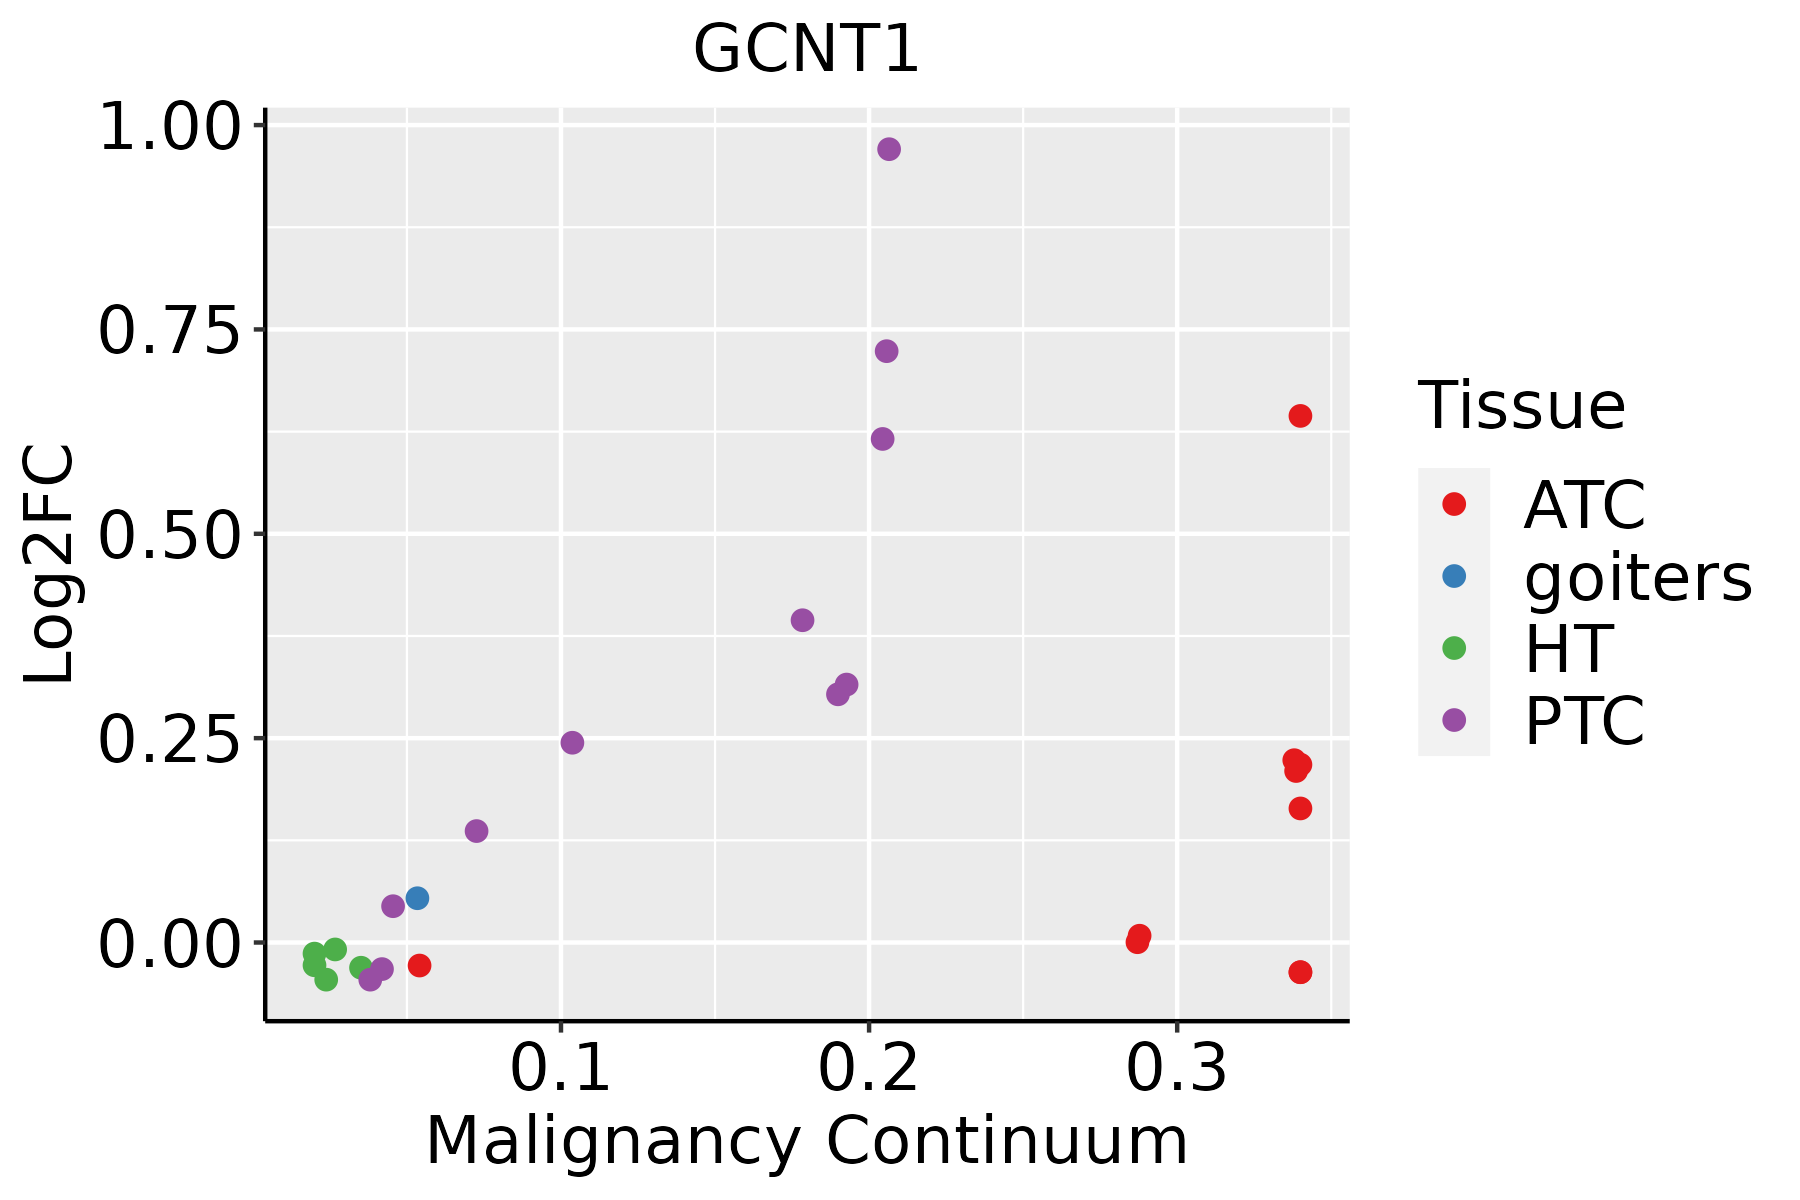 | ATC: Anaplastic thyroid cancer |
| HT: Hashimoto's thyroiditis | ||
| PTC: Papillary thyroid cancer |
| ∗log2FC in expression of this searched gene in stem-like cells from each diseased tissue sample relative to stem-like cells in normal samples in each tissue plotted against the malignancy continuum. Samples are colored based on if they are from different disease stage. |
Top |
Malignant transformation related pathway analysis |
| Find out the enriched GO biological processes and KEGG pathways involved in transition from healthy to precancer to cancer |
| Tissue | Disease Stage | Enriched GO biological Processes |
| Colorectum | AD |  |
| Colorectum | SER |  |
| Colorectum | MSS |  |
| Colorectum | MSI-H |  |
| Colorectum | FAP |  |
| ∗Top 15 enriched GO BP terms are showed in the bar plot of each disease state in each tissue. Each row represents a significant GO biological process which is colored according to the -log10(p.adjust). |
| Page: 1 2 3 4 5 6 7 8 9 |
| GO ID | Tissue | Disease Stage | Description | Gene Ratio | Bg Ratio | pvalue | p.adjust | Count |
| GO:00071598 | Cervix | CC | leukocyte cell-cell adhesion | 85/2311 | 371/18723 | 8.27e-09 | 7.07e-07 | 85 |
| GO:00509007 | Cervix | CC | leukocyte migration | 78/2311 | 369/18723 | 1.09e-06 | 3.80e-05 | 78 |
| GO:00434349 | Cervix | CC | response to peptide hormone | 77/2311 | 414/18723 | 1.40e-04 | 1.70e-03 | 77 |
| GO:00328688 | Cervix | CC | response to insulin | 50/2311 | 264/18723 | 1.28e-03 | 1.02e-02 | 50 |
| GO:00016556 | Endometrium | AEH | urogenital system development | 67/2100 | 338/18723 | 2.30e-06 | 6.76e-05 | 67 |
| GO:00720015 | Endometrium | AEH | renal system development | 61/2100 | 302/18723 | 3.43e-06 | 9.24e-05 | 61 |
| GO:00018224 | Endometrium | AEH | kidney development | 57/2100 | 293/18723 | 2.25e-05 | 4.35e-04 | 57 |
| GO:00609932 | Endometrium | AEH | kidney morphogenesis | 24/2100 | 93/18723 | 6.73e-05 | 1.04e-03 | 24 |
| GO:00509008 | Endometrium | AEH | leukocyte migration | 64/2100 | 369/18723 | 2.57e-04 | 3.04e-03 | 64 |
| GO:004343410 | Endometrium | AEH | response to peptide hormone | 70/2100 | 414/18723 | 2.93e-04 | 3.35e-03 | 70 |
| GO:00071599 | Endometrium | AEH | leukocyte cell-cell adhesion | 63/2100 | 371/18723 | 5.11e-04 | 5.21e-03 | 63 |
| GO:00328689 | Endometrium | AEH | response to insulin | 44/2100 | 264/18723 | 4.70e-03 | 3.00e-02 | 44 |
| GO:000165512 | Endometrium | EEC | urogenital system development | 69/2168 | 338/18723 | 1.70e-06 | 5.18e-05 | 69 |
| GO:007200112 | Endometrium | EEC | renal system development | 63/2168 | 302/18723 | 2.24e-06 | 6.59e-05 | 63 |
| GO:000182212 | Endometrium | EEC | kidney development | 59/2168 | 293/18723 | 1.44e-05 | 2.87e-04 | 59 |
| GO:004343416 | Endometrium | EEC | response to peptide hormone | 74/2168 | 414/18723 | 9.11e-05 | 1.28e-03 | 74 |
| GO:00609931 | Endometrium | EEC | kidney morphogenesis | 24/2168 | 93/18723 | 1.11e-04 | 1.52e-03 | 24 |
| GO:005090013 | Endometrium | EEC | leukocyte migration | 67/2168 | 369/18723 | 1.19e-04 | 1.59e-03 | 67 |
| GO:000715914 | Endometrium | EEC | leukocyte cell-cell adhesion | 67/2168 | 371/18723 | 1.41e-04 | 1.82e-03 | 67 |
| GO:003286814 | Endometrium | EEC | response to insulin | 46/2168 | 264/18723 | 3.01e-03 | 2.10e-02 | 46 |
| Page: 1 2 3 4 |
| Pathway ID | Tissue | Disease Stage | Description | Gene Ratio | Bg Ratio | pvalue | p.adjust | qvalue | Count |
| Page: 1 |
Top |
Cell-cell communication analysis |
| Identification of potential cell-cell interactions between two cell types and their ligand-receptor pairs for different disease states |
| Ligand | Receptor | LRpair | Pathway | Tissue | Disease Stage |
| Page: 1 |
Top |
Single-cell gene regulatory network inference analysis |
| Find out the significant the regulons (TFs) and the target genes of each regulon across cell types for different disease states |
| TF | Cell Type | Tissue | Disease Stage | Target Gene | RSS | Regulon Activity |
| ∗The dot plots of a searched regulon are shown for all cell subpopulations in each disease state of each tissue based on the regulon specific score inferred using pySCENIC and by calculating the average expression. |
| Page: 1 |
Top |
Somatic mutation of malignant transformation related genes |
| Annotation of somatic variants for genes involved in malignant transformation |
| Hugo Symbol | Variant Class | Variant Classification | dbSNP RS | HGVSc | HGVSp | HGVSp Short | SWISSPROT | BIOTYPE | SIFT | PolyPhen | Tumor Sample Barcode | Tissue | Histology | Sex | Age | Stage | Therapy Types | Drugs | Outcome |
| GCNT1 | SNV | Missense_Mutation | novel | c.1195G>T | p.Ala399Ser | p.A399S | Q02742 | protein_coding | deleterious(0) | probably_damaging(0.948) | TCGA-A2-A25C-01 | Breast | breast invasive carcinoma | Female | <65 | I/II | Chemotherapy | taxotere | SD |
| GCNT1 | insertion | Frame_Shift_Ins | novel | c.805_806insATAAT | p.Thr269AsnfsTer42 | p.T269Nfs*42 | Q02742 | protein_coding | TCGA-AR-A0U0-01 | Breast | breast invasive carcinoma | Female | >=65 | I/II | Unknown | Unknown | SD | ||
| GCNT1 | insertion | Nonsense_Mutation | novel | c.1210_1211insCTGTCTAGAATCTTTTCATTTCTGCC | p.Val404AlafsTer3 | p.V404Afs*3 | Q02742 | protein_coding | TCGA-BH-A0HK-01 | Breast | breast invasive carcinoma | Female | >=65 | I/II | Hormone Therapy | arimidex | SD | ||
| GCNT1 | SNV | Missense_Mutation | rs142199715 | c.320G>A | p.Arg107His | p.R107H | Q02742 | protein_coding | deleterious(0.01) | benign(0.211) | TCGA-EA-A3HS-01 | Cervix | cervical & endocervical cancer | Female | <65 | I/II | Unknown | Unknown | SD |
| GCNT1 | SNV | Missense_Mutation | c.355N>A | p.Ala119Thr | p.A119T | Q02742 | protein_coding | tolerated(0.43) | benign(0.104) | TCGA-AA-3672-01 | Colorectum | colon adenocarcinoma | Female | >=65 | III/IV | Unknown | Unknown | SD | |
| GCNT1 | SNV | Missense_Mutation | c.594N>A | p.Asn198Lys | p.N198K | Q02742 | protein_coding | deleterious(0) | probably_damaging(1) | TCGA-AA-3672-01 | Colorectum | colon adenocarcinoma | Female | >=65 | III/IV | Unknown | Unknown | SD | |
| GCNT1 | SNV | Missense_Mutation | rs369681886 | c.91N>A | p.Val31Ile | p.V31I | Q02742 | protein_coding | tolerated(0.4) | benign(0.003) | TCGA-AA-A02Y-01 | Colorectum | colon adenocarcinoma | Male | >=65 | I/II | Unknown | Unknown | SD |
| GCNT1 | SNV | Missense_Mutation | novel | c.851N>A | p.Ser284Tyr | p.S284Y | Q02742 | protein_coding | deleterious(0) | probably_damaging(0.998) | TCGA-AM-5820-01 | Colorectum | colon adenocarcinoma | Female | <65 | I/II | Unknown | Unknown | SD |
| GCNT1 | SNV | Missense_Mutation | c.536N>T | p.Ala179Val | p.A179V | Q02742 | protein_coding | tolerated(0.14) | possibly_damaging(0.498) | TCGA-AY-6197-01 | Colorectum | colon adenocarcinoma | Male | <65 | I/II | Unknown | Unknown | SD | |
| GCNT1 | SNV | Missense_Mutation | rs656106 | c.835N>A | p.Glu279Lys | p.E279K | Q02742 | protein_coding | tolerated(0.22) | benign(0.005) | TCGA-CA-6718-01 | Colorectum | colon adenocarcinoma | Male | <65 | I/II | Unknown | Unknown | PD |
| Page: 1 2 3 4 5 |
Top |
Related drugs of malignant transformation related genes |
| Identification of chemicals and drugs interact with genes involved in malignant transfromation |
| (DGIdb 4.0) |
| Entrez ID | Symbol | Category | Interaction Types | Drug Claim Name | Drug Name | PMIDs |
| Page: 1 |

Copyright 2023-Present -The University of Texas Health Science Center at Houston |