
|
|||||
|
 | |
| |
| |
| |
| |
| |
|
Gene: GCLM |
Gene summary for GCLM |
| Gene information | Species | Human | Gene symbol | GCLM | Gene ID | 2730 |
| Gene name | glutamate-cysteine ligase modifier subunit | |
| Gene Alias | GLCLR | |
| Cytomap | 1p22.1 | |
| Gene Type | protein-coding | GO ID | GO:0000096 | UniProtAcc | P48507 |
Top |
Malignant transformation analysis |
| Identification of the aberrant gene expression in precancerous and cancerous lesions by comparing the gene expression of stem-like cells in diseased tissues with normal stem cells |
| Entrez ID | Symbol | Replicates | Species | Organ | Tissue | Adj P-value | Log2FC | Malignancy |
| 2730 | GCLM | GSM4909281 | Human | Breast | IDC | 6.28e-12 | -5.20e-01 | 0.21 |
| 2730 | GCLM | GSM4909285 | Human | Breast | IDC | 2.17e-12 | -5.02e-01 | 0.21 |
| 2730 | GCLM | GSM4909286 | Human | Breast | IDC | 1.61e-15 | -5.37e-01 | 0.1081 |
| 2730 | GCLM | GSM4909287 | Human | Breast | IDC | 4.14e-05 | -4.09e-01 | 0.2057 |
| 2730 | GCLM | GSM4909288 | Human | Breast | IDC | 2.46e-02 | -5.55e-01 | 0.0988 |
| 2730 | GCLM | GSM4909290 | Human | Breast | IDC | 3.29e-06 | -4.88e-01 | 0.2096 |
| 2730 | GCLM | GSM4909291 | Human | Breast | IDC | 2.57e-04 | -4.88e-01 | 0.1753 |
| 2730 | GCLM | GSM4909293 | Human | Breast | IDC | 2.44e-12 | -5.56e-01 | 0.1581 |
| 2730 | GCLM | GSM4909294 | Human | Breast | IDC | 2.07e-17 | -5.70e-01 | 0.2022 |
| 2730 | GCLM | GSM4909295 | Human | Breast | IDC | 2.04e-02 | -4.71e-01 | 0.0898 |
| 2730 | GCLM | GSM4909296 | Human | Breast | IDC | 5.36e-19 | -5.83e-01 | 0.1524 |
| 2730 | GCLM | GSM4909297 | Human | Breast | IDC | 2.22e-16 | -5.50e-01 | 0.1517 |
| 2730 | GCLM | GSM4909298 | Human | Breast | IDC | 4.62e-14 | -5.55e-01 | 0.1551 |
| 2730 | GCLM | GSM4909299 | Human | Breast | IDC | 4.85e-12 | -5.26e-01 | 0.035 |
| 2730 | GCLM | GSM4909301 | Human | Breast | IDC | 5.27e-18 | -5.57e-01 | 0.1577 |
| 2730 | GCLM | GSM4909302 | Human | Breast | IDC | 9.30e-14 | -5.54e-01 | 0.1545 |
| 2730 | GCLM | GSM4909304 | Human | Breast | IDC | 6.83e-07 | -4.09e-01 | 0.1636 |
| 2730 | GCLM | GSM4909305 | Human | Breast | IDC | 1.23e-07 | -5.27e-01 | 0.0436 |
| 2730 | GCLM | GSM4909306 | Human | Breast | IDC | 4.92e-15 | -5.43e-01 | 0.1564 |
| 2730 | GCLM | GSM4909307 | Human | Breast | IDC | 1.35e-08 | -4.65e-01 | 0.1569 |
| Page: 1 2 3 4 5 6 7 8 9 |
| Tissue | Expression Dynamics | Abbreviation |
| Breast | 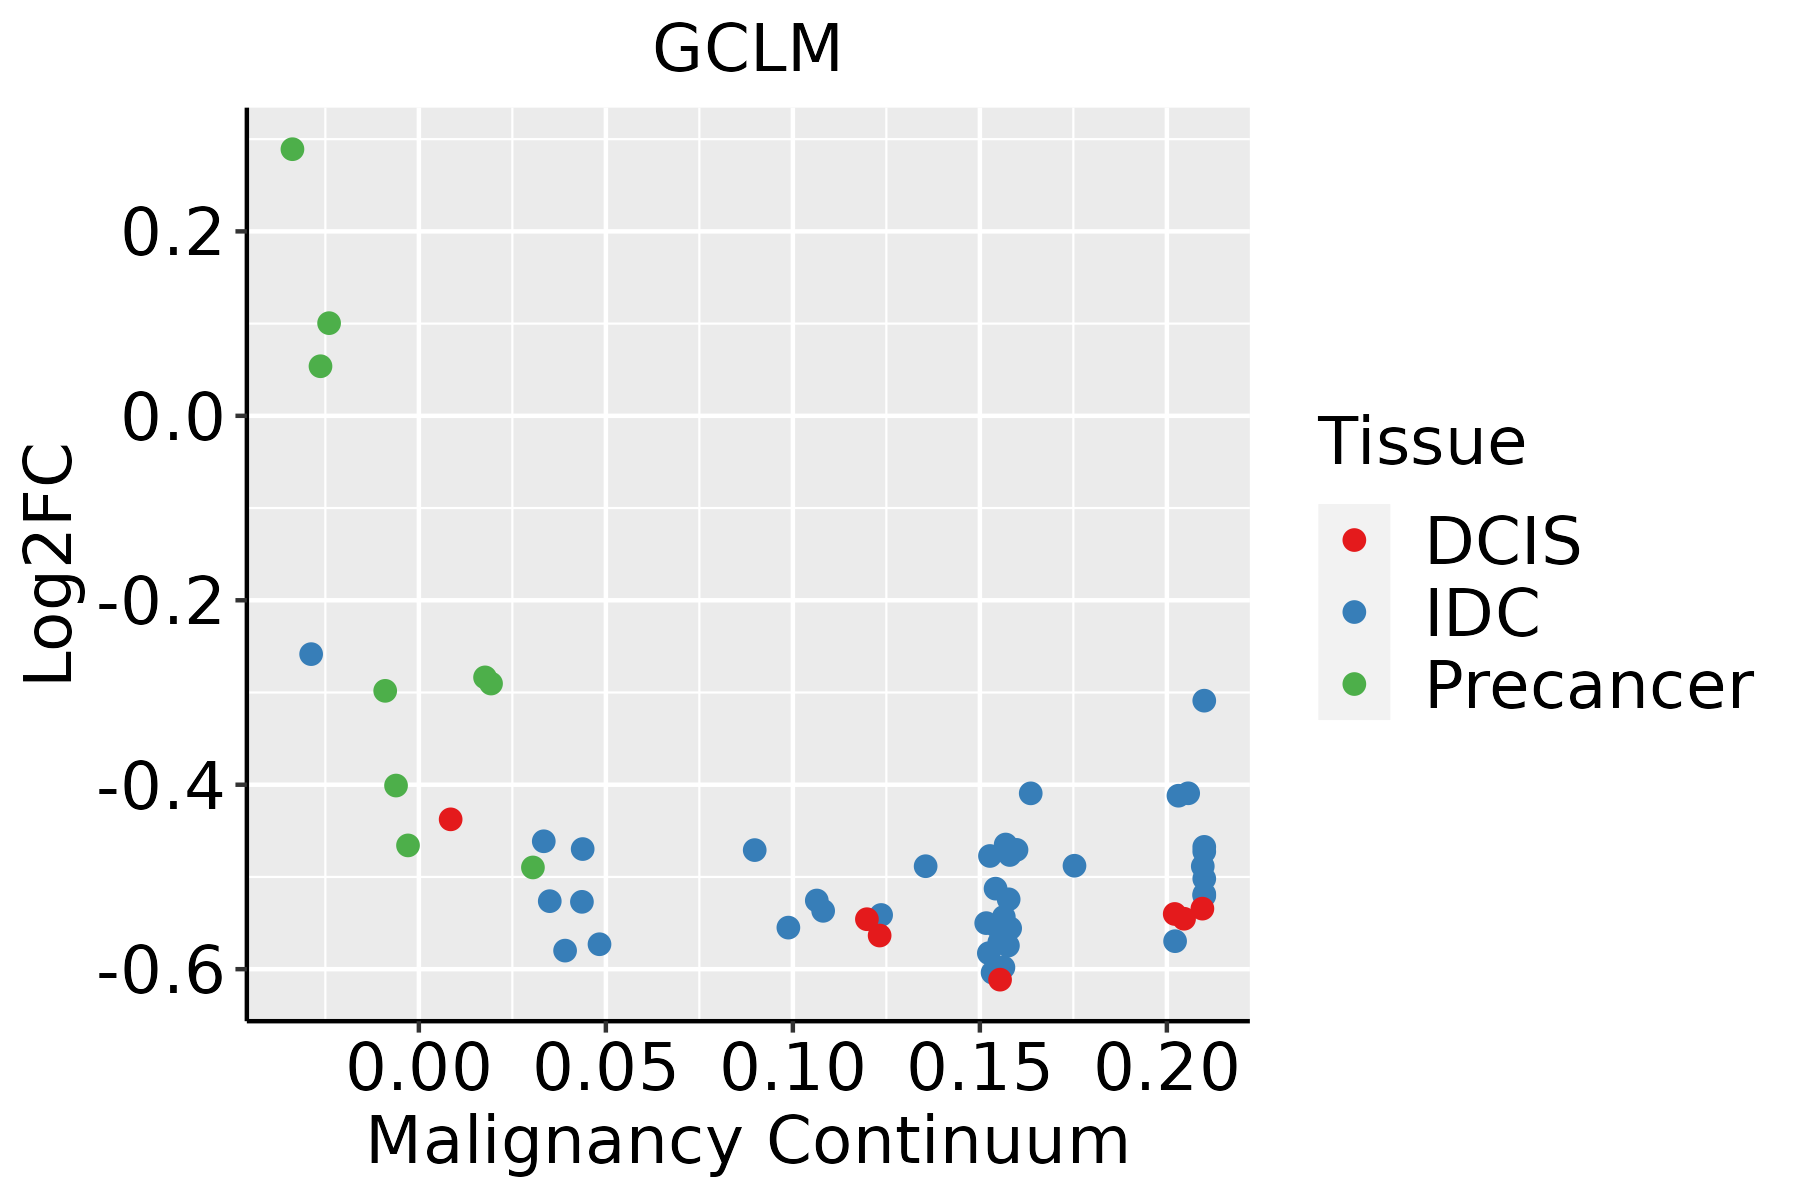 | IDC: Invasive ductal carcinoma |
| DCIS: Ductal carcinoma in situ | ||
| Precancer(BRCA1-mut): Precancerous lesion from BRCA1 mutation carriers | ||
| Endometrium | 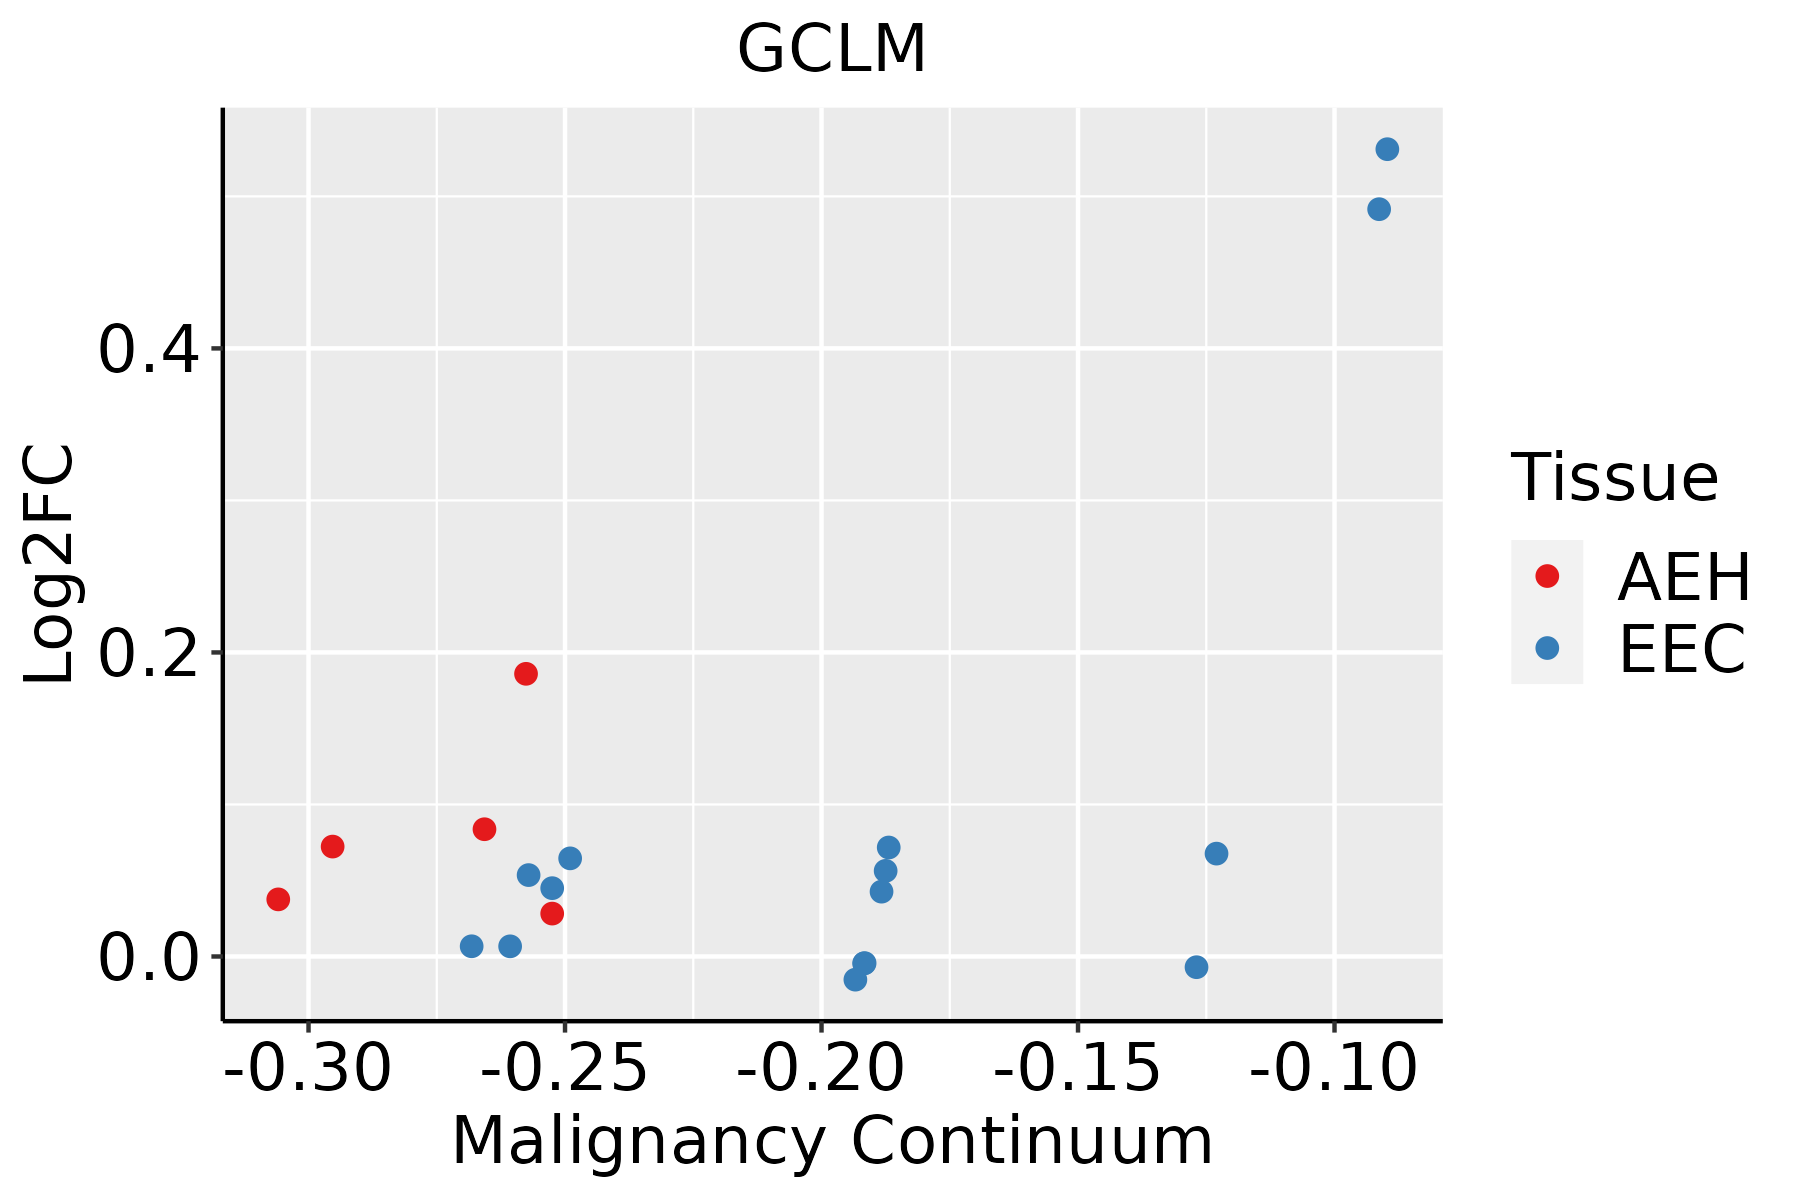 | AEH: Atypical endometrial hyperplasia |
| EEC: Endometrioid Cancer | ||
| Esophagus | 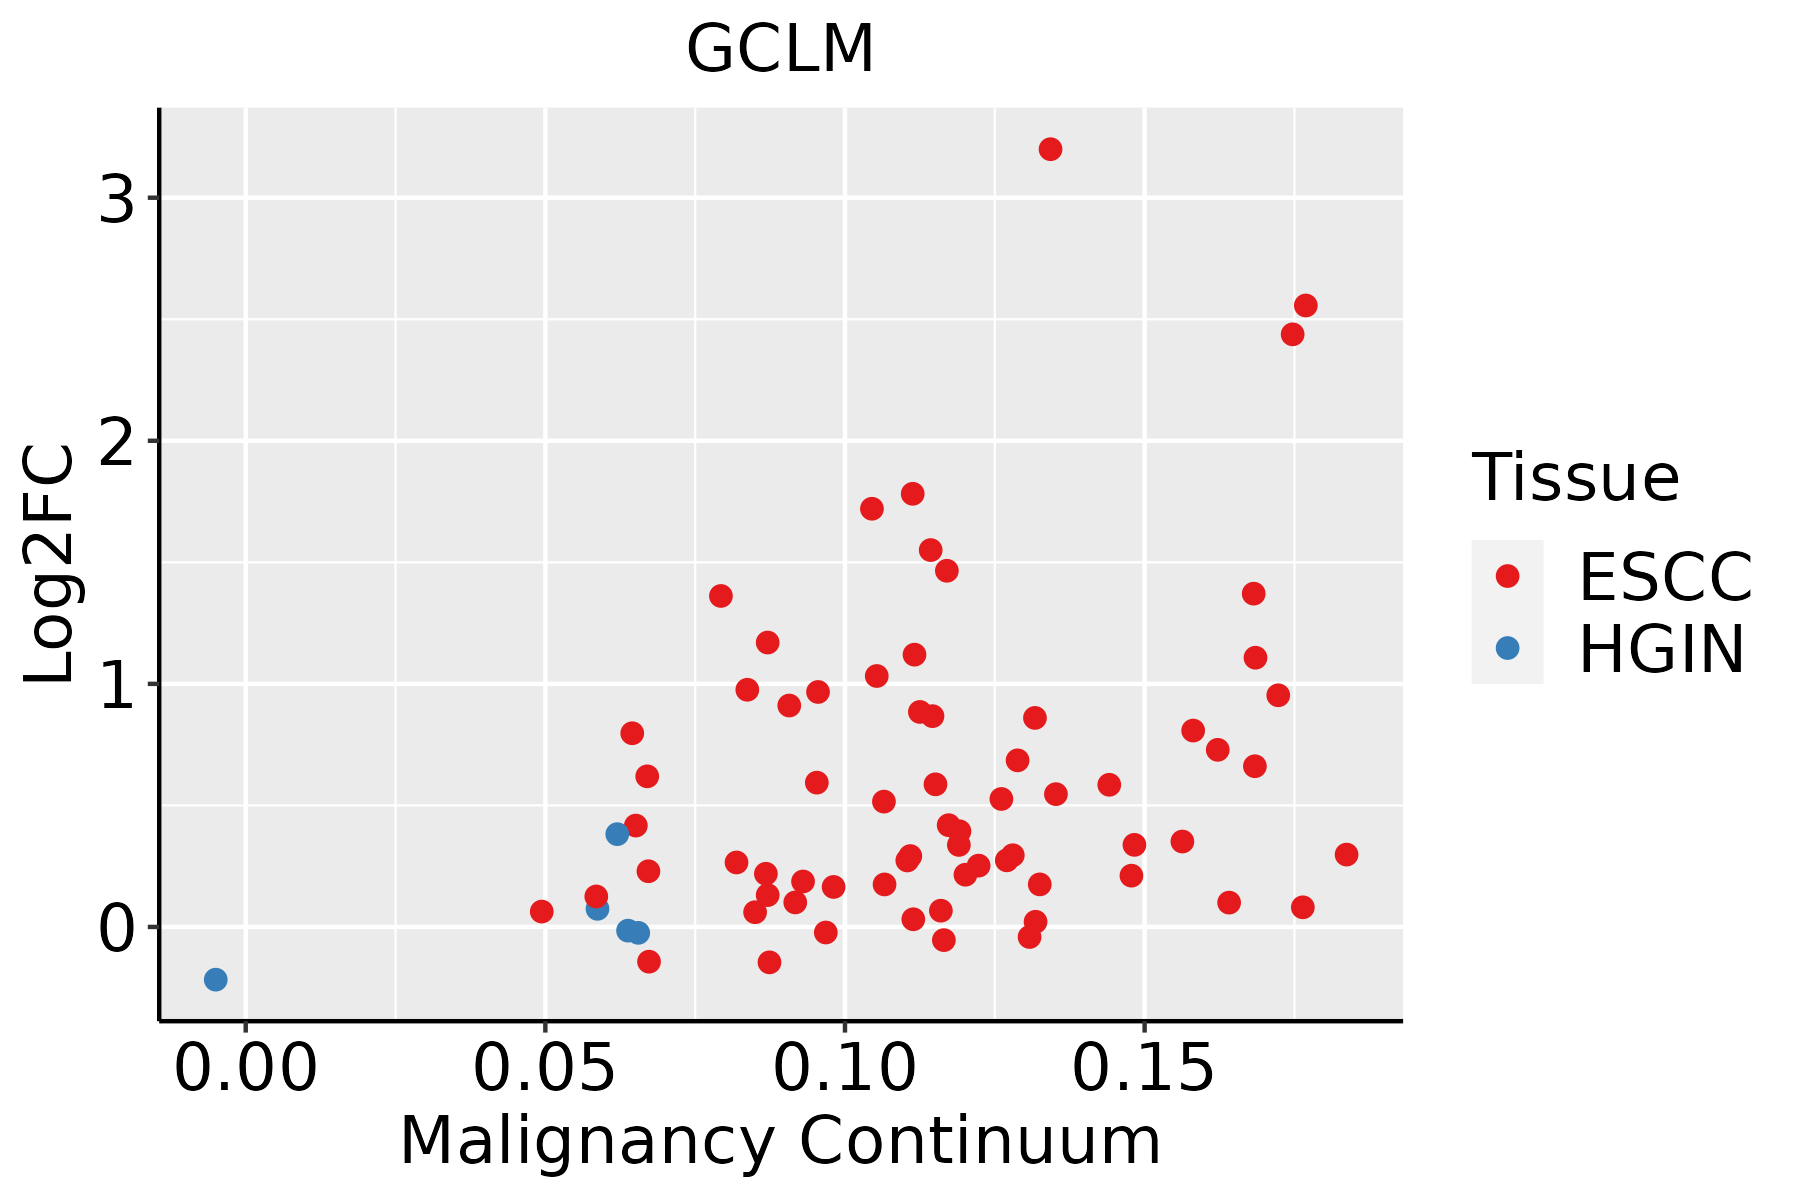 | ESCC: Esophageal squamous cell carcinoma |
| HGIN: High-grade intraepithelial neoplasias | ||
| LGIN: Low-grade intraepithelial neoplasias | ||
| Liver | 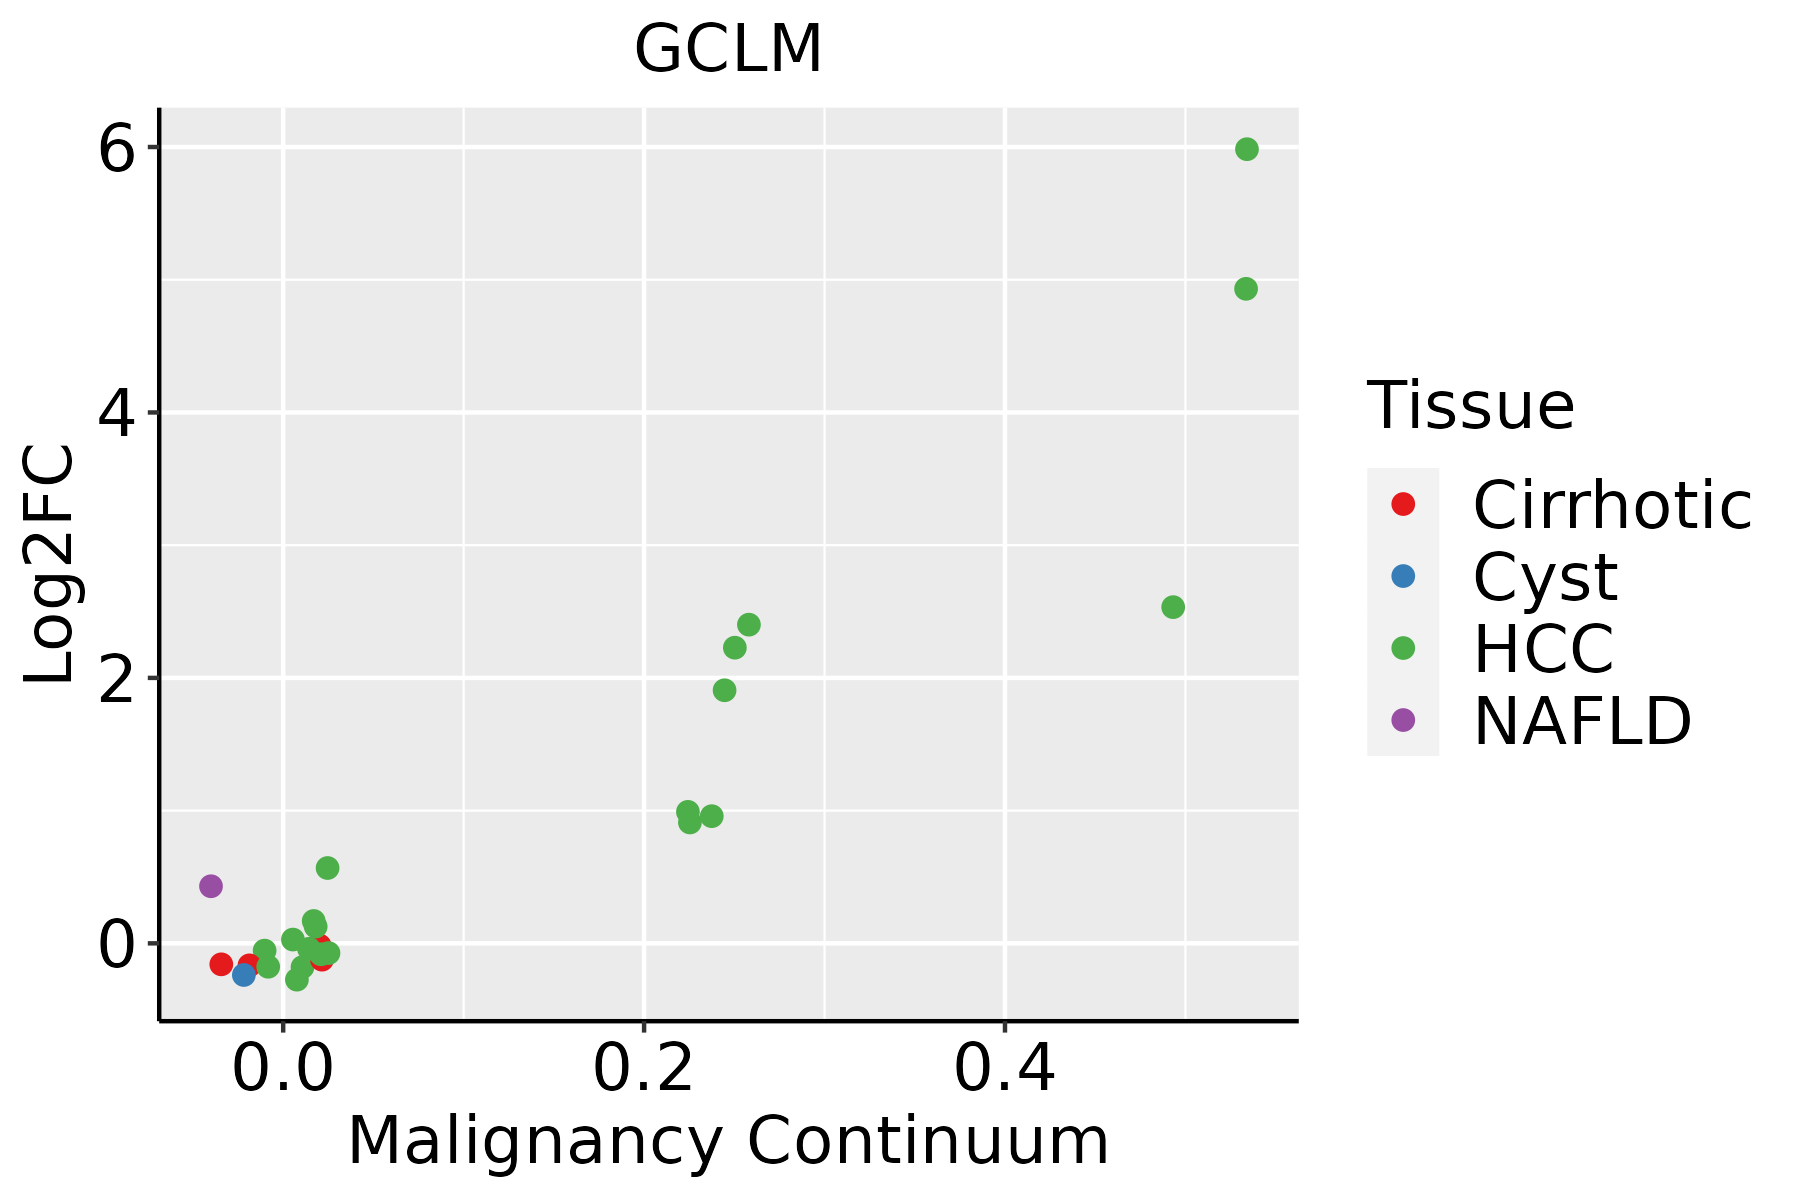 | HCC: Hepatocellular carcinoma |
| NAFLD: Non-alcoholic fatty liver disease | ||
| Oral Cavity | 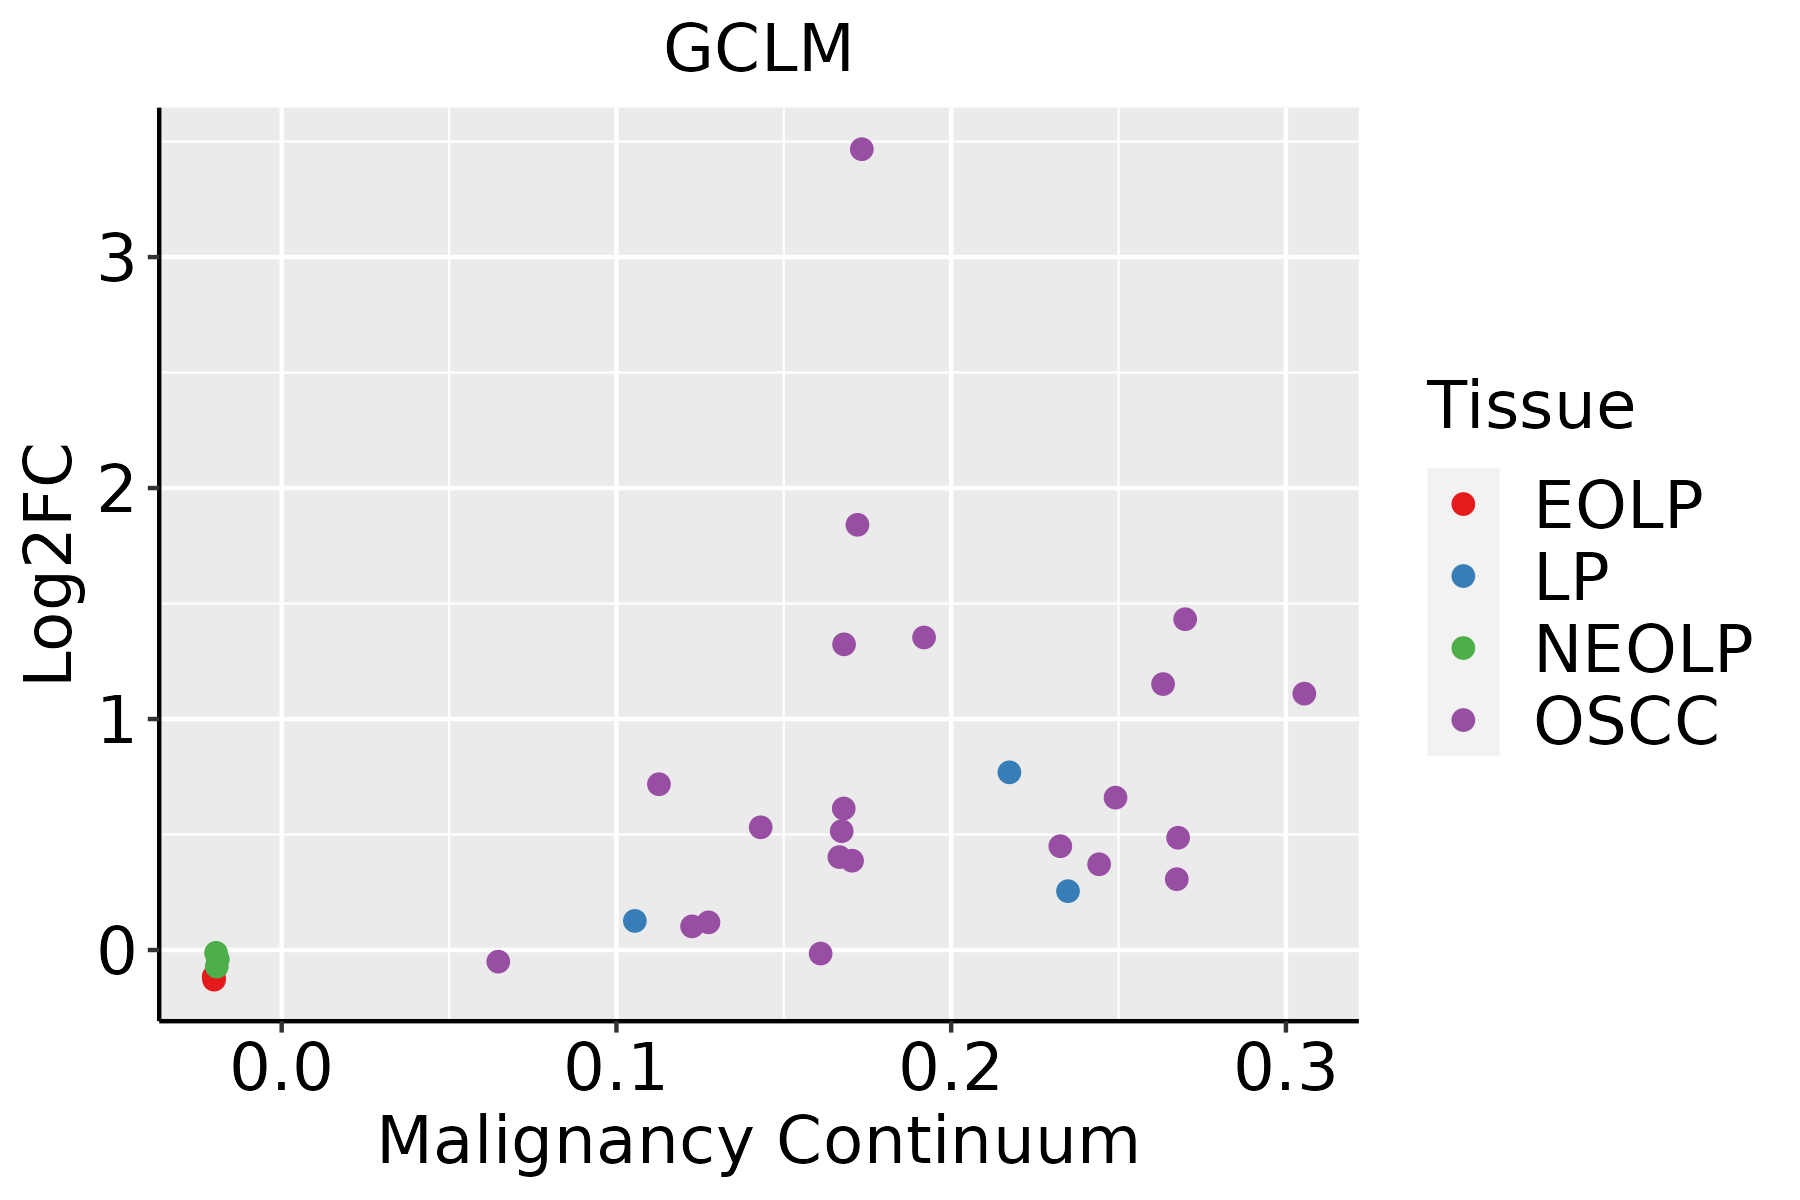 | EOLP: Erosive Oral lichen planus |
| LP: leukoplakia | ||
| NEOLP: Non-erosive oral lichen planus | ||
| OSCC: Oral squamous cell carcinoma | ||
| Prostate |  | BPH: Benign Prostatic Hyperplasia |
| Skin | 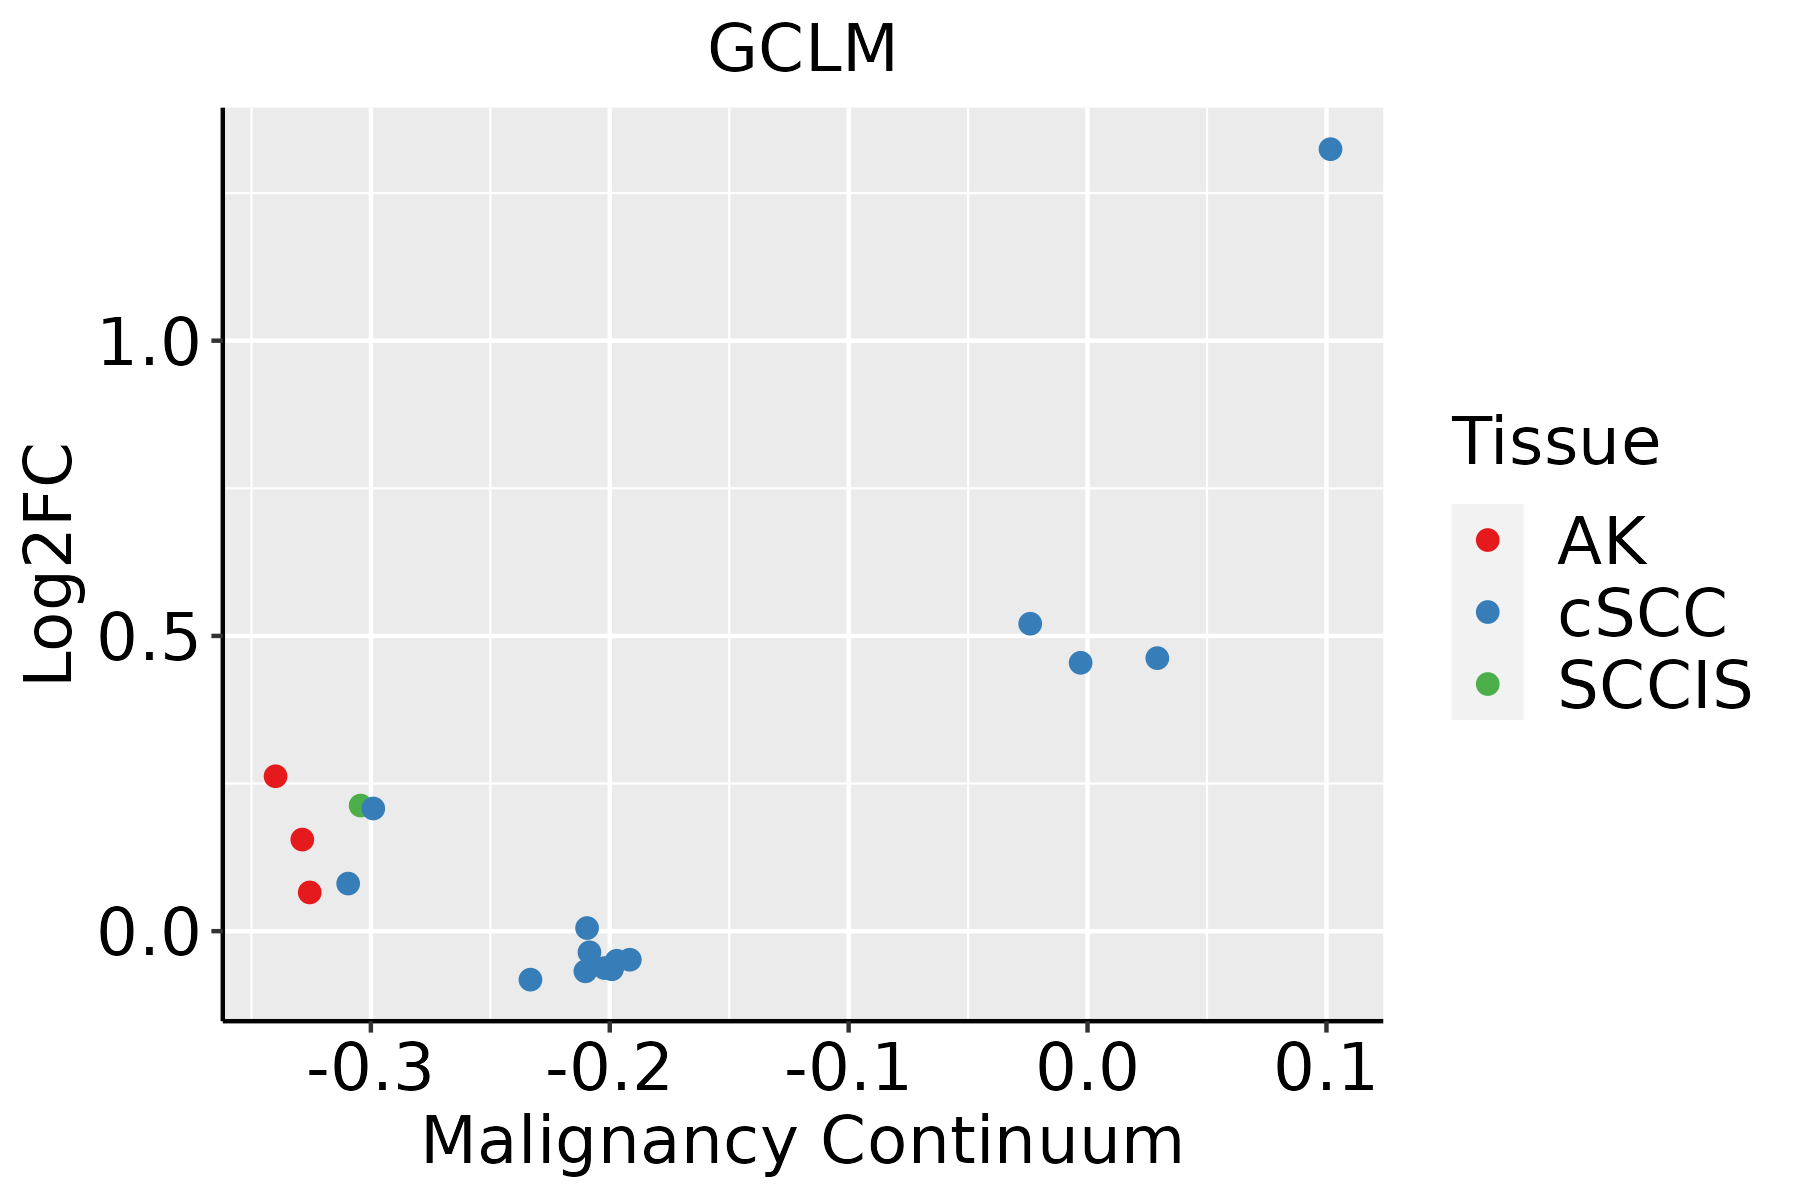 | AK: Actinic keratosis |
| cSCC: Cutaneous squamous cell carcinoma | ||
| SCCIS:squamous cell carcinoma in situ | ||
| Thyroid |  | ATC: Anaplastic thyroid cancer |
| HT: Hashimoto's thyroiditis | ||
| PTC: Papillary thyroid cancer |
| ∗log2FC in expression of this searched gene in stem-like cells from each diseased tissue sample relative to stem-like cells in normal samples in each tissue plotted against the malignancy continuum. Samples are colored based on if they are from different disease stage. |
Top |
Malignant transformation related pathway analysis |
| Find out the enriched GO biological processes and KEGG pathways involved in transition from healthy to precancer to cancer |
| Tissue | Disease Stage | Enriched GO biological Processes |
| Colorectum | AD |  |
| Colorectum | SER |  |
| Colorectum | MSS |  |
| Colorectum | MSI-H |  |
| Colorectum | FAP |  |
| ∗Top 15 enriched GO BP terms are showed in the bar plot of each disease state in each tissue. Each row represents a significant GO biological process which is colored according to the -log10(p.adjust). |
| Page: 1 2 3 4 5 6 7 8 9 |
| GO ID | Tissue | Disease Stage | Description | Gene Ratio | Bg Ratio | pvalue | p.adjust | Count |
| GO:20012339 | Breast | Precancer | regulation of apoptotic signaling pathway | 65/1080 | 356/18723 | 7.70e-17 | 3.17e-14 | 65 |
| GO:00069799 | Breast | Precancer | response to oxidative stress | 70/1080 | 446/18723 | 1.59e-14 | 4.26e-12 | 70 |
| GO:20012349 | Breast | Precancer | negative regulation of apoptotic signaling pathway | 39/1080 | 224/18723 | 5.35e-10 | 4.77e-08 | 39 |
| GO:00709979 | Breast | Precancer | neuron death | 50/1080 | 361/18723 | 7.75e-09 | 5.70e-07 | 50 |
| GO:00514029 | Breast | Precancer | neuron apoptotic process | 38/1080 | 246/18723 | 2.68e-08 | 1.75e-06 | 38 |
| GO:00086378 | Breast | Precancer | apoptotic mitochondrial changes | 23/1080 | 107/18723 | 3.44e-08 | 2.12e-06 | 23 |
| GO:00518816 | Breast | Precancer | regulation of mitochondrial membrane potential | 18/1080 | 74/18723 | 1.45e-07 | 7.82e-06 | 18 |
| GO:19012149 | Breast | Precancer | regulation of neuron death | 41/1080 | 319/18723 | 1.27e-06 | 4.80e-05 | 41 |
| GO:00435237 | Breast | Precancer | regulation of neuron apoptotic process | 31/1080 | 212/18723 | 1.69e-06 | 6.08e-05 | 31 |
| GO:20012369 | Breast | Precancer | regulation of extrinsic apoptotic signaling pathway | 24/1080 | 151/18723 | 5.78e-06 | 1.70e-04 | 24 |
| GO:00075688 | Breast | Precancer | aging | 41/1080 | 339/18723 | 5.95e-06 | 1.71e-04 | 41 |
| GO:00971919 | Breast | Precancer | extrinsic apoptotic signaling pathway | 30/1080 | 219/18723 | 9.42e-06 | 2.50e-04 | 30 |
| GO:00342849 | Breast | Precancer | response to monosaccharide | 29/1080 | 225/18723 | 4.19e-05 | 9.00e-04 | 29 |
| GO:00097439 | Breast | Precancer | response to carbohydrate | 31/1080 | 253/18723 | 6.15e-05 | 1.25e-03 | 31 |
| GO:00425938 | Breast | Precancer | glucose homeostasis | 31/1080 | 258/18723 | 8.89e-05 | 1.69e-03 | 31 |
| GO:00335008 | Breast | Precancer | carbohydrate homeostasis | 31/1080 | 259/18723 | 9.56e-05 | 1.79e-03 | 31 |
| GO:20012379 | Breast | Precancer | negative regulation of extrinsic apoptotic signaling pathway | 16/1080 | 97/18723 | 1.29e-04 | 2.24e-03 | 16 |
| GO:00097469 | Breast | Precancer | response to hexose | 27/1080 | 219/18723 | 1.61e-04 | 2.69e-03 | 27 |
| GO:00316679 | Breast | Precancer | response to nutrient levels | 47/1080 | 474/18723 | 2.09e-04 | 3.27e-03 | 47 |
| GO:00094108 | Breast | Precancer | response to xenobiotic stimulus | 45/1080 | 462/18723 | 4.17e-04 | 5.56e-03 | 45 |
| Page: 1 2 3 4 5 6 7 8 9 10 11 12 13 14 15 16 17 18 19 20 21 22 23 24 25 26 27 28 29 30 |
| Pathway ID | Tissue | Disease Stage | Description | Gene Ratio | Bg Ratio | pvalue | p.adjust | qvalue | Count |
| hsa0421610 | Breast | Precancer | Ferroptosis | 11/684 | 41/8465 | 2.95e-04 | 2.45e-03 | 1.88e-03 | 11 |
| hsa0048010 | Breast | Precancer | Glutathione metabolism | 12/684 | 57/8465 | 1.68e-03 | 1.08e-02 | 8.30e-03 | 12 |
| hsa0421613 | Breast | Precancer | Ferroptosis | 11/684 | 41/8465 | 2.95e-04 | 2.45e-03 | 1.88e-03 | 11 |
| hsa0048013 | Breast | Precancer | Glutathione metabolism | 12/684 | 57/8465 | 1.68e-03 | 1.08e-02 | 8.30e-03 | 12 |
| hsa0421623 | Breast | IDC | Ferroptosis | 12/867 | 41/8465 | 5.87e-04 | 4.89e-03 | 3.66e-03 | 12 |
| hsa0421633 | Breast | IDC | Ferroptosis | 12/867 | 41/8465 | 5.87e-04 | 4.89e-03 | 3.66e-03 | 12 |
| hsa0421642 | Breast | DCIS | Ferroptosis | 12/846 | 41/8465 | 4.69e-04 | 3.69e-03 | 2.72e-03 | 12 |
| hsa0048041 | Breast | DCIS | Glutathione metabolism | 13/846 | 57/8465 | 3.44e-03 | 1.98e-02 | 1.46e-02 | 13 |
| hsa0421652 | Breast | DCIS | Ferroptosis | 12/846 | 41/8465 | 4.69e-04 | 3.69e-03 | 2.72e-03 | 12 |
| hsa0048051 | Breast | DCIS | Glutathione metabolism | 13/846 | 57/8465 | 3.44e-03 | 1.98e-02 | 1.46e-02 | 13 |
| hsa0421628 | Esophagus | HGIN | Ferroptosis | 15/1383 | 41/8465 | 1.35e-03 | 1.26e-02 | 1.00e-02 | 15 |
| hsa04216111 | Esophagus | HGIN | Ferroptosis | 15/1383 | 41/8465 | 1.35e-03 | 1.26e-02 | 1.00e-02 | 15 |
| hsa0048018 | Esophagus | ESCC | Glutathione metabolism | 44/4205 | 57/8465 | 1.81e-05 | 9.03e-05 | 4.63e-05 | 44 |
| hsa0421629 | Esophagus | ESCC | Ferroptosis | 33/4205 | 41/8465 | 4.58e-05 | 1.99e-04 | 1.02e-04 | 33 |
| hsa012405 | Esophagus | ESCC | Biosynthesis of cofactors | 97/4205 | 153/8465 | 3.88e-04 | 1.35e-03 | 6.94e-04 | 97 |
| hsa0048019 | Esophagus | ESCC | Glutathione metabolism | 44/4205 | 57/8465 | 1.81e-05 | 9.03e-05 | 4.63e-05 | 44 |
| hsa0421638 | Esophagus | ESCC | Ferroptosis | 33/4205 | 41/8465 | 4.58e-05 | 1.99e-04 | 1.02e-04 | 33 |
| hsa0124012 | Esophagus | ESCC | Biosynthesis of cofactors | 97/4205 | 153/8465 | 3.88e-04 | 1.35e-03 | 6.94e-04 | 97 |
| hsa004809 | Liver | Cirrhotic | Glutathione metabolism | 30/2530 | 57/8465 | 2.63e-04 | 1.72e-03 | 1.06e-03 | 30 |
| hsa01240 | Liver | Cirrhotic | Biosynthesis of cofactors | 66/2530 | 153/8465 | 3.11e-04 | 1.99e-03 | 1.23e-03 | 66 |
| Page: 1 2 3 |
Top |
Cell-cell communication analysis |
| Identification of potential cell-cell interactions between two cell types and their ligand-receptor pairs for different disease states |
| Ligand | Receptor | LRpair | Pathway | Tissue | Disease Stage |
| Page: 1 |
Top |
Single-cell gene regulatory network inference analysis |
| Find out the significant the regulons (TFs) and the target genes of each regulon across cell types for different disease states |
| TF | Cell Type | Tissue | Disease Stage | Target Gene | RSS | Regulon Activity |
| ∗The dot plots of a searched regulon are shown for all cell subpopulations in each disease state of each tissue based on the regulon specific score inferred using pySCENIC and by calculating the average expression. |
| Page: 1 |
Top |
Somatic mutation of malignant transformation related genes |
| Annotation of somatic variants for genes involved in malignant transformation |
| Hugo Symbol | Variant Class | Variant Classification | dbSNP RS | HGVSc | HGVSp | HGVSp Short | SWISSPROT | BIOTYPE | SIFT | PolyPhen | Tumor Sample Barcode | Tissue | Histology | Sex | Age | Stage | Therapy Types | Drugs | Outcome |
| GCLM | SNV | Missense_Mutation | novel | c.295N>C | p.Glu99Gln | p.E99Q | P48507 | protein_coding | tolerated(0.47) | benign(0.072) | TCGA-OL-A5RZ-01 | Breast | breast invasive carcinoma | Female | <65 | I/II | Chemotherapy | doxorubicin | CR |
| GCLM | insertion | Nonsense_Mutation | novel | c.502_503insTAAACTTTAATCACTGTGGATTGTGATTTTTC | p.Asp168ValfsTer9 | p.D168Vfs*9 | P48507 | protein_coding | TCGA-AN-A049-01 | Breast | breast invasive carcinoma | Female | <65 | I/II | Unknown | Unknown | SD | ||
| GCLM | SNV | Missense_Mutation | c.226C>T | p.His76Tyr | p.H76Y | P48507 | protein_coding | deleterious(0.01) | benign(0.278) | TCGA-IR-A3LL-01 | Cervix | cervical & endocervical cancer | Female | <65 | I/II | Chemotherapy | cisplatin | CR | |
| GCLM | SNV | Missense_Mutation | novel | c.133G>A | p.Asp45Asn | p.D45N | P48507 | protein_coding | deleterious(0) | benign(0.273) | TCGA-AA-A00N-01 | Colorectum | colon adenocarcinoma | Male | >=65 | I/II | Unknown | Unknown | PD |
| GCLM | SNV | Missense_Mutation | rs773867359 | c.383N>T | p.Ala128Val | p.A128V | P48507 | protein_coding | deleterious(0.01) | probably_damaging(0.971) | TCGA-AA-A010-01 | Colorectum | colon adenocarcinoma | Female | <65 | I/II | Chemotherapy | folinic | CR |
| GCLM | SNV | Missense_Mutation | c.635T>C | p.Leu212Ser | p.L212S | P48507 | protein_coding | deleterious(0) | probably_damaging(0.997) | TCGA-AM-5821-01 | Colorectum | colon adenocarcinoma | Female | >=65 | I/II | Unknown | Unknown | SD | |
| GCLM | SNV | Missense_Mutation | rs761296185 | c.716N>T | p.Ala239Val | p.A239V | P48507 | protein_coding | tolerated(0.27) | benign(0) | TCGA-EI-6917-01 | Colorectum | rectum adenocarcinoma | Male | <65 | III/IV | Chemotherapy | 5fluorouracil+oxaciplatina+l-folinian | SD |
| GCLM | SNV | Missense_Mutation | novel | c.820T>C | p.Ser274Pro | p.S274P | P48507 | protein_coding | deleterious_low_confidence(0) | benign(0) | TCGA-A5-A1OF-01 | Endometrium | uterine corpus endometrioid carcinoma | Female | <65 | I/II | Unknown | Unknown | SD |
| GCLM | SNV | Missense_Mutation | novel | c.815G>T | p.Arg272Met | p.R272M | P48507 | protein_coding | tolerated_low_confidence(0.06) | benign(0.044) | TCGA-AJ-A3BH-01 | Endometrium | uterine corpus endometrioid carcinoma | Female | Unknown | I/II | Unknown | Unknown | SD |
| GCLM | SNV | Missense_Mutation | c.523C>A | p.Leu175Met | p.L175M | P48507 | protein_coding | deleterious(0.01) | probably_damaging(0.997) | TCGA-AP-A051-01 | Endometrium | uterine corpus endometrioid carcinoma | Female | >=65 | I/II | Unknown | Unknown | SD |
| Page: 1 2 3 |
Top |
Related drugs of malignant transformation related genes |
| Identification of chemicals and drugs interact with genes involved in malignant transfromation |
| (DGIdb 4.0) |
| Entrez ID | Symbol | Category | Interaction Types | Drug Claim Name | Drug Name | PMIDs |
| 2730 | GCLM | ENZYME | PMSG | 11780957 | ||
| 2730 | GCLM | ENZYME | ANTIOXIDANT | 12637989 | ||
| 2730 | GCLM | ENZYME | H2O2 | 7615092 | ||
| 2730 | GCLM | ENZYME | CAROTENOID | 15657364 | ||
| 2730 | GCLM | ENZYME | CISPLATIN | CISPLATIN | 10399958 | |
| 2730 | GCLM | ENZYME | SULFORAPHANE | SULFORAPHANE | 11535546 | |
| 2730 | GCLM | ENZYME | MELATONIN | MELATONIN | 10515588 |
| Page: 1 |

Copyright 2023-Present -The University of Texas Health Science Center at Houston |