
|
|||||
|
 | |
| |
| |
| |
| |
| |
|
Gene: GCKR |
Gene summary for GCKR |
| Gene information | Species | Human | Gene symbol | GCKR | Gene ID | 2646 |
| Gene name | glucokinase regulator | |
| Gene Alias | FGQTL5 | |
| Cytomap | 2p23.3 | |
| Gene Type | protein-coding | GO ID | GO:0005975 | UniProtAcc | A0A0C4DFN2 |
Top |
Malignant transformation analysis |
| Identification of the aberrant gene expression in precancerous and cancerous lesions by comparing the gene expression of stem-like cells in diseased tissues with normal stem cells |
| Entrez ID | Symbol | Replicates | Species | Organ | Tissue | Adj P-value | Log2FC | Malignancy |
| 2646 | GCKR | NAFLD1 | Human | Liver | NAFLD | 8.19e-07 | 5.83e-01 | -0.04 |
| 2646 | GCKR | S43 | Human | Liver | Cirrhotic | 2.78e-05 | -1.65e-01 | -0.0187 |
| 2646 | GCKR | HCC1_Meng | Human | Liver | HCC | 4.57e-12 | -1.76e-01 | 0.0246 |
| 2646 | GCKR | HCC2_Meng | Human | Liver | HCC | 2.36e-06 | -1.89e-01 | 0.0107 |
| 2646 | GCKR | cirrhotic1 | Human | Liver | Cirrhotic | 2.12e-04 | -1.75e-01 | 0.0202 |
| 2646 | GCKR | HCC1 | Human | Liver | HCC | 1.05e-24 | 4.76e-01 | 0.5336 |
| 2646 | GCKR | HCC2 | Human | Liver | HCC | 2.20e-12 | 2.70e+00 | 0.5341 |
| 2646 | GCKR | Pt13.a | Human | Liver | HCC | 7.97e-05 | -1.70e-01 | 0.021 |
| 2646 | GCKR | Pt14.d | Human | Liver | HCC | 1.55e-03 | -1.74e-01 | 0.0143 |
| 2646 | GCKR | S027 | Human | Liver | HCC | 1.76e-02 | 4.74e-01 | 0.2446 |
| 2646 | GCKR | S028 | Human | Liver | HCC | 1.82e-04 | 3.74e-01 | 0.2503 |
| 2646 | GCKR | S029 | Human | Liver | HCC | 1.67e-06 | 5.40e-01 | 0.2581 |
| Page: 1 |
| Tissue | Expression Dynamics | Abbreviation |
| Liver | 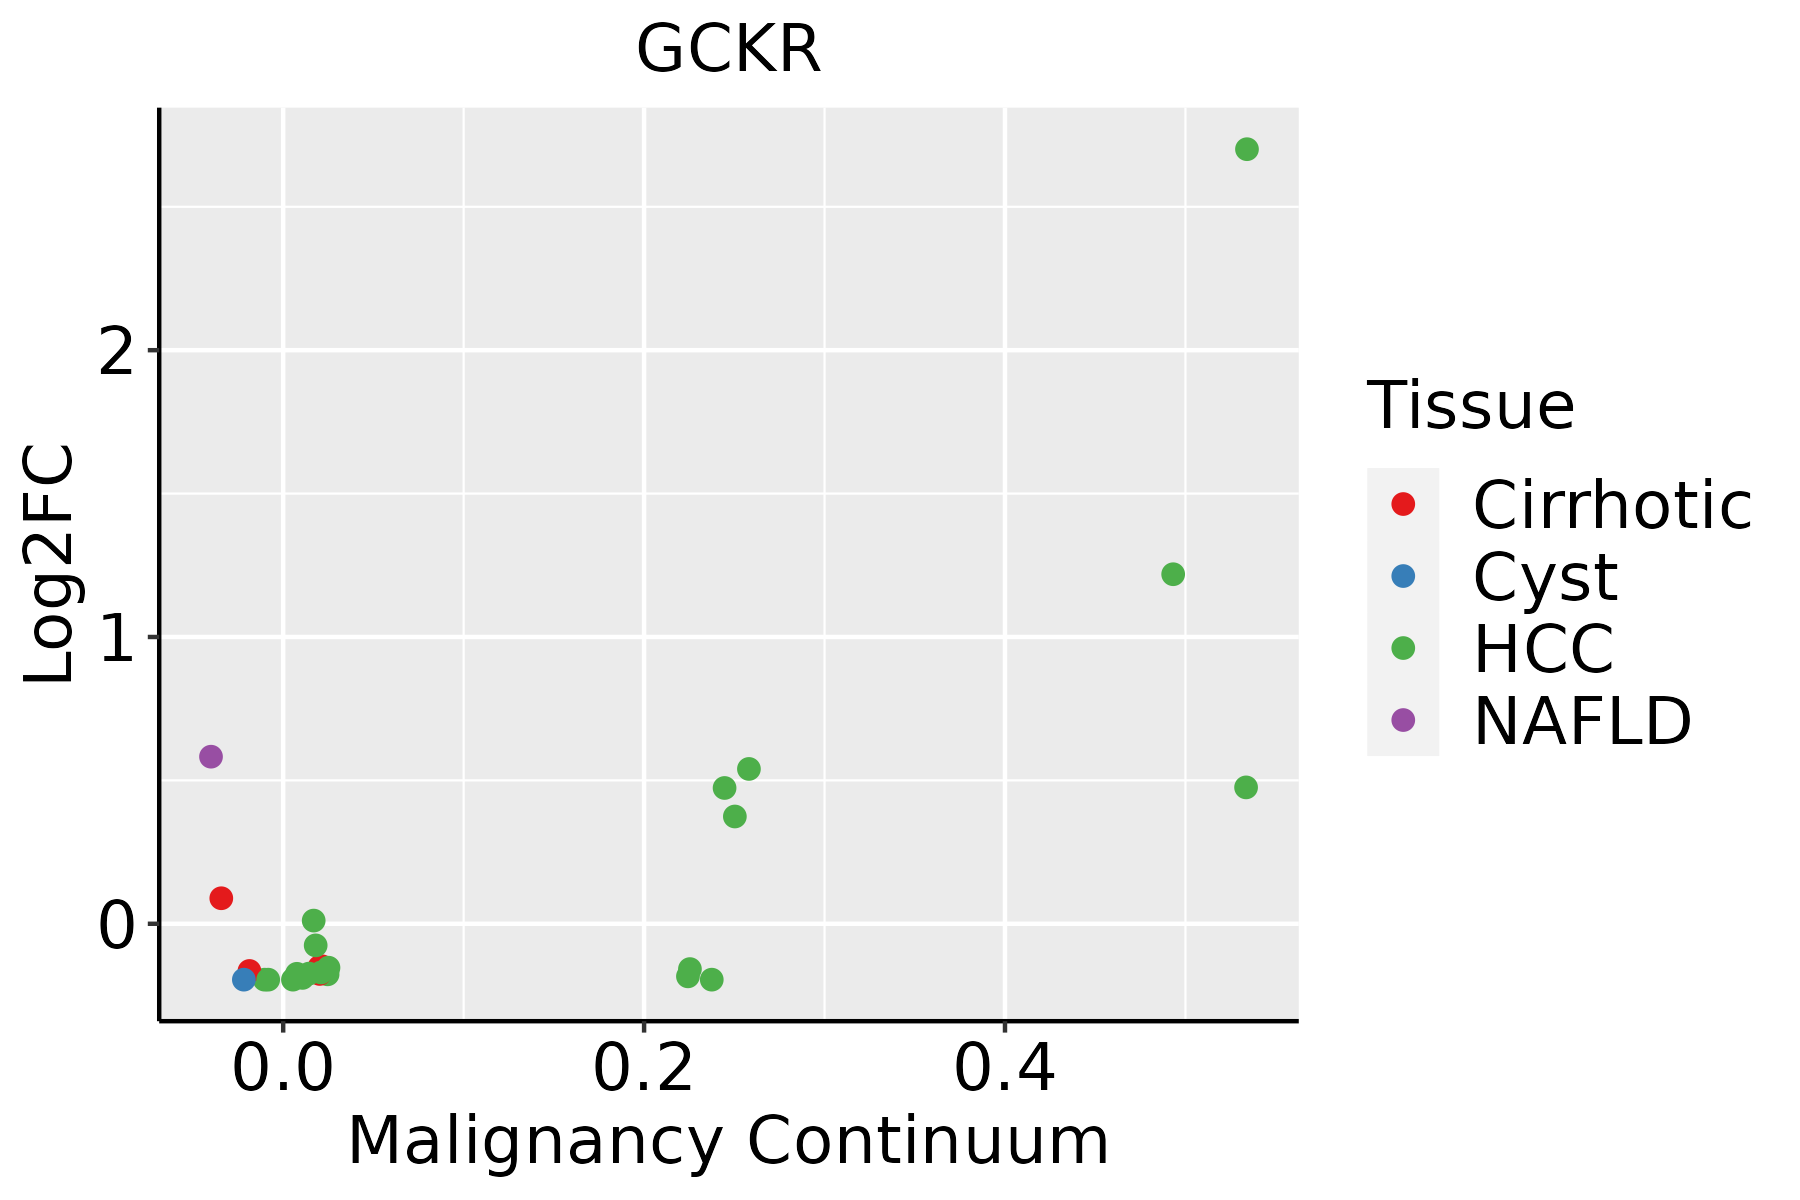 | HCC: Hepatocellular carcinoma |
| NAFLD: Non-alcoholic fatty liver disease |
| ∗log2FC in expression of this searched gene in stem-like cells from each diseased tissue sample relative to stem-like cells in normal samples in each tissue plotted against the malignancy continuum. Samples are colored based on if they are from different disease stage. |
Top |
Malignant transformation related pathway analysis |
| Find out the enriched GO biological processes and KEGG pathways involved in transition from healthy to precancer to cancer |
| Tissue | Disease Stage | Enriched GO biological Processes |
| Colorectum | AD |  |
| Colorectum | SER |  |
| Colorectum | MSS |  |
| Colorectum | MSI-H |  |
| Colorectum | FAP |  |
| ∗Top 15 enriched GO BP terms are showed in the bar plot of each disease state in each tissue. Each row represents a significant GO biological process which is colored according to the -log10(p.adjust). |
| Page: 1 2 3 4 5 6 7 8 9 |
| GO ID | Tissue | Disease Stage | Description | Gene Ratio | Bg Ratio | pvalue | p.adjust | Count |
| GO:00550883 | Liver | NAFLD | lipid homeostasis | 44/1882 | 167/18723 | 1.48e-09 | 2.54e-07 | 44 |
| GO:0055090 | Liver | NAFLD | acylglycerol homeostasis | 17/1882 | 42/18723 | 2.22e-07 | 1.53e-05 | 17 |
| GO:0070328 | Liver | NAFLD | triglyceride homeostasis | 17/1882 | 42/18723 | 2.22e-07 | 1.53e-05 | 17 |
| GO:00059965 | Liver | NAFLD | monosaccharide metabolic process | 53/1882 | 257/18723 | 2.89e-07 | 1.92e-05 | 53 |
| GO:00620125 | Liver | NAFLD | regulation of small molecule metabolic process | 63/1882 | 334/18723 | 6.55e-07 | 3.79e-05 | 63 |
| GO:00193185 | Liver | NAFLD | hexose metabolic process | 49/1882 | 237/18723 | 7.41e-07 | 4.12e-05 | 49 |
| GO:00442623 | Liver | NAFLD | cellular carbohydrate metabolic process | 55/1882 | 283/18723 | 1.27e-06 | 6.01e-05 | 55 |
| GO:00060065 | Liver | NAFLD | glucose metabolic process | 42/1882 | 196/18723 | 1.70e-06 | 7.47e-05 | 42 |
| GO:00423267 | Liver | NAFLD | negative regulation of phosphorylation | 67/1882 | 385/18723 | 5.49e-06 | 1.98e-04 | 67 |
| GO:00061093 | Liver | NAFLD | regulation of carbohydrate metabolic process | 38/1882 | 178/18723 | 5.71e-06 | 2.04e-04 | 38 |
| GO:00459367 | Liver | NAFLD | negative regulation of phosphate metabolic process | 73/1882 | 441/18723 | 1.31e-05 | 3.93e-04 | 73 |
| GO:00105637 | Liver | NAFLD | negative regulation of phosphorus metabolic process | 73/1882 | 442/18723 | 1.42e-05 | 4.17e-04 | 73 |
| GO:00513487 | Liver | NAFLD | negative regulation of transferase activity | 49/1882 | 268/18723 | 2.61e-05 | 7.03e-04 | 49 |
| GO:00106753 | Liver | NAFLD | regulation of cellular carbohydrate metabolic process | 31/1882 | 146/18723 | 4.47e-05 | 1.08e-03 | 31 |
| GO:00097437 | Liver | NAFLD | response to carbohydrate | 45/1882 | 253/18723 | 1.07e-04 | 2.11e-03 | 45 |
| GO:00109063 | Liver | NAFLD | regulation of glucose metabolic process | 26/1882 | 119/18723 | 1.09e-04 | 2.13e-03 | 26 |
| GO:00069137 | Liver | NAFLD | nucleocytoplasmic transport | 51/1882 | 301/18723 | 1.39e-04 | 2.62e-03 | 51 |
| GO:00511697 | Liver | NAFLD | nuclear transport | 51/1882 | 301/18723 | 1.39e-04 | 2.62e-03 | 51 |
| GO:00425936 | Liver | NAFLD | glucose homeostasis | 45/1882 | 258/18723 | 1.71e-04 | 3.08e-03 | 45 |
| GO:00335006 | Liver | NAFLD | carbohydrate homeostasis | 45/1882 | 259/18723 | 1.87e-04 | 3.29e-03 | 45 |
| Page: 1 2 3 4 5 |
| Pathway ID | Tissue | Disease Stage | Description | Gene Ratio | Bg Ratio | pvalue | p.adjust | qvalue | Count |
| Page: 1 |
Top |
Cell-cell communication analysis |
| Identification of potential cell-cell interactions between two cell types and their ligand-receptor pairs for different disease states |
| Ligand | Receptor | LRpair | Pathway | Tissue | Disease Stage |
| Page: 1 |
Top |
Single-cell gene regulatory network inference analysis |
| Find out the significant the regulons (TFs) and the target genes of each regulon across cell types for different disease states |
| TF | Cell Type | Tissue | Disease Stage | Target Gene | RSS | Regulon Activity |
| ∗The dot plots of a searched regulon are shown for all cell subpopulations in each disease state of each tissue based on the regulon specific score inferred using pySCENIC and by calculating the average expression. |
| Page: 1 |
Top |
Somatic mutation of malignant transformation related genes |
| Annotation of somatic variants for genes involved in malignant transformation |
| Hugo Symbol | Variant Class | Variant Classification | dbSNP RS | HGVSc | HGVSp | HGVSp Short | SWISSPROT | BIOTYPE | SIFT | PolyPhen | Tumor Sample Barcode | Tissue | Histology | Sex | Age | Stage | Therapy Types | Drugs | Outcome |
| GCKR | SNV | Missense_Mutation | rs779171513 | c.1823N>T | p.Pro608Leu | p.P608L | protein_coding | tolerated_low_confidence(0.08) | benign(0.041) | TCGA-A2-A0CX-01 | Breast | breast invasive carcinoma | Female | <65 | I/II | Chemotherapy | adriamycin | SD | |
| GCKR | insertion | Frame_Shift_Ins | novel | c.186_187insATTGAGAACCTGGGTGTGAGTCCCAATTTGTCCAGCTGTGT | p.Glu63IlefsTer32 | p.E63Ifs*32 | protein_coding | TCGA-A8-A0A4-01 | Breast | breast invasive carcinoma | Female | >=65 | I/II | Hormone Therapy | tamoxiphen | CR | |||
| GCKR | insertion | Frame_Shift_Ins | novel | c.597_598insTCTCCGTTTCAAACGCACAAGCA | p.Val200SerfsTer20 | p.V200Sfs*20 | protein_coding | TCGA-BH-A0B3-01 | Breast | breast invasive carcinoma | Female | <65 | I/II | Chemotherapy | cyclophosphamide | SD | |||
| GCKR | deletion | Frame_Shift_Del | novel | c.1068delN | p.Phe357SerfsTer37 | p.F357Sfs*37 | protein_coding | TCGA-EW-A2FV-01 | Breast | breast invasive carcinoma | Female | <65 | III/IV | Chemotherapy | docetaxel | SD | |||
| GCKR | SNV | Missense_Mutation | c.661N>C | p.Asp221His | p.D221H | protein_coding | deleterious(0.03) | possibly_damaging(0.906) | TCGA-EK-A2PL-01 | Cervix | cervical & endocervical cancer | Female | <65 | III/IV | Unknown | Unknown | SD | ||
| GCKR | SNV | Missense_Mutation | c.1399G>C | p.Glu467Gln | p.E467Q | protein_coding | tolerated(0.07) | possibly_damaging(0.682) | TCGA-R2-A69V-01 | Cervix | cervical & endocervical cancer | Female | <65 | I/II | Chemotherapy | cisplatin | SD | ||
| GCKR | SNV | Missense_Mutation | rs374489109 | c.748G>A | p.Gly250Arg | p.G250R | protein_coding | deleterious(0.02) | benign(0.216) | TCGA-AA-3864-01 | Colorectum | colon adenocarcinoma | Male | >=65 | I/II | Unknown | Unknown | SD | |
| GCKR | SNV | Missense_Mutation | rs761397252 | c.1720G>A | p.Ala574Thr | p.A574T | protein_coding | deleterious(0) | possibly_damaging(0.793) | TCGA-AA-3949-01 | Colorectum | colon adenocarcinoma | Female | >=65 | III/IV | Unknown | Unknown | SD | |
| GCKR | SNV | Missense_Mutation | rs146168012 | c.776N>A | p.Arg259Gln | p.R259Q | protein_coding | tolerated(0.17) | benign(0.013) | TCGA-AA-A010-01 | Colorectum | colon adenocarcinoma | Female | <65 | I/II | Chemotherapy | folinic | CR | |
| GCKR | SNV | Missense_Mutation | rs761397252 | c.1720N>A | p.Ala574Thr | p.A574T | protein_coding | deleterious(0) | possibly_damaging(0.793) | TCGA-AA-A010-01 | Colorectum | colon adenocarcinoma | Female | <65 | I/II | Chemotherapy | folinic | CR |
| Page: 1 2 3 4 5 6 |
Top |
Related drugs of malignant transformation related genes |
| Identification of chemicals and drugs interact with genes involved in malignant transfromation |
| (DGIdb 4.0) |
| Entrez ID | Symbol | Category | Interaction Types | Drug Claim Name | Drug Name | PMIDs |
| 2646 | GCKR | ENZYME | ethanol | ALCOHOL | 32451486 |
| Page: 1 |

Copyright 2023-Present -The University of Texas Health Science Center at Houston |