
|
|||||
|
 | |
| |
| |
| |
| |
| |
|
Gene: GCH1 |
Gene summary for GCH1 |
| Gene information | Species | Human | Gene symbol | GCH1 | Gene ID | 2643 |
| Gene name | GTP cyclohydrolase 1 | |
| Gene Alias | DYT14 | |
| Cytomap | 14q22.2 | |
| Gene Type | protein-coding | GO ID | GO:0000302 | UniProtAcc | A0A024R642 |
Top |
Malignant transformation analysis |
| Identification of the aberrant gene expression in precancerous and cancerous lesions by comparing the gene expression of stem-like cells in diseased tissues with normal stem cells |
| Entrez ID | Symbol | Replicates | Species | Organ | Tissue | Adj P-value | Log2FC | Malignancy |
| 2643 | GCH1 | LZE4T | Human | Esophagus | ESCC | 6.12e-03 | -4.10e-02 | 0.0811 |
| 2643 | GCH1 | LZE8T | Human | Esophagus | ESCC | 4.89e-05 | 6.04e-02 | 0.067 |
| 2643 | GCH1 | LZE20T | Human | Esophagus | ESCC | 2.94e-08 | 3.40e-01 | 0.0662 |
| 2643 | GCH1 | LZE24T | Human | Esophagus | ESCC | 1.04e-08 | 4.93e-01 | 0.0596 |
| 2643 | GCH1 | P1T-E | Human | Esophagus | ESCC | 3.27e-12 | 6.75e-01 | 0.0875 |
| 2643 | GCH1 | P2T-E | Human | Esophagus | ESCC | 5.53e-12 | 1.60e-01 | 0.1177 |
| 2643 | GCH1 | P4T-E | Human | Esophagus | ESCC | 1.16e-20 | 3.46e-01 | 0.1323 |
| 2643 | GCH1 | P5T-E | Human | Esophagus | ESCC | 1.08e-04 | 5.22e-02 | 0.1327 |
| 2643 | GCH1 | P8T-E | Human | Esophagus | ESCC | 6.26e-20 | 3.52e-01 | 0.0889 |
| 2643 | GCH1 | P9T-E | Human | Esophagus | ESCC | 4.01e-07 | 5.73e-02 | 0.1131 |
| 2643 | GCH1 | P10T-E | Human | Esophagus | ESCC | 6.76e-09 | -9.29e-03 | 0.116 |
| 2643 | GCH1 | P11T-E | Human | Esophagus | ESCC | 8.27e-05 | 5.86e-01 | 0.1426 |
| 2643 | GCH1 | P12T-E | Human | Esophagus | ESCC | 9.34e-22 | 3.87e-01 | 0.1122 |
| 2643 | GCH1 | P15T-E | Human | Esophagus | ESCC | 5.26e-22 | 3.97e-01 | 0.1149 |
| 2643 | GCH1 | P16T-E | Human | Esophagus | ESCC | 2.51e-13 | 1.94e-03 | 0.1153 |
| 2643 | GCH1 | P20T-E | Human | Esophagus | ESCC | 4.14e-05 | 1.68e-01 | 0.1124 |
| 2643 | GCH1 | P21T-E | Human | Esophagus | ESCC | 3.25e-08 | -1.24e-02 | 0.1617 |
| 2643 | GCH1 | P22T-E | Human | Esophagus | ESCC | 1.12e-05 | 3.46e-02 | 0.1236 |
| 2643 | GCH1 | P23T-E | Human | Esophagus | ESCC | 1.20e-09 | 3.86e-01 | 0.108 |
| 2643 | GCH1 | P24T-E | Human | Esophagus | ESCC | 1.14e-07 | 1.93e-01 | 0.1287 |
| Page: 1 2 3 4 |
| Tissue | Expression Dynamics | Abbreviation |
| Esophagus | 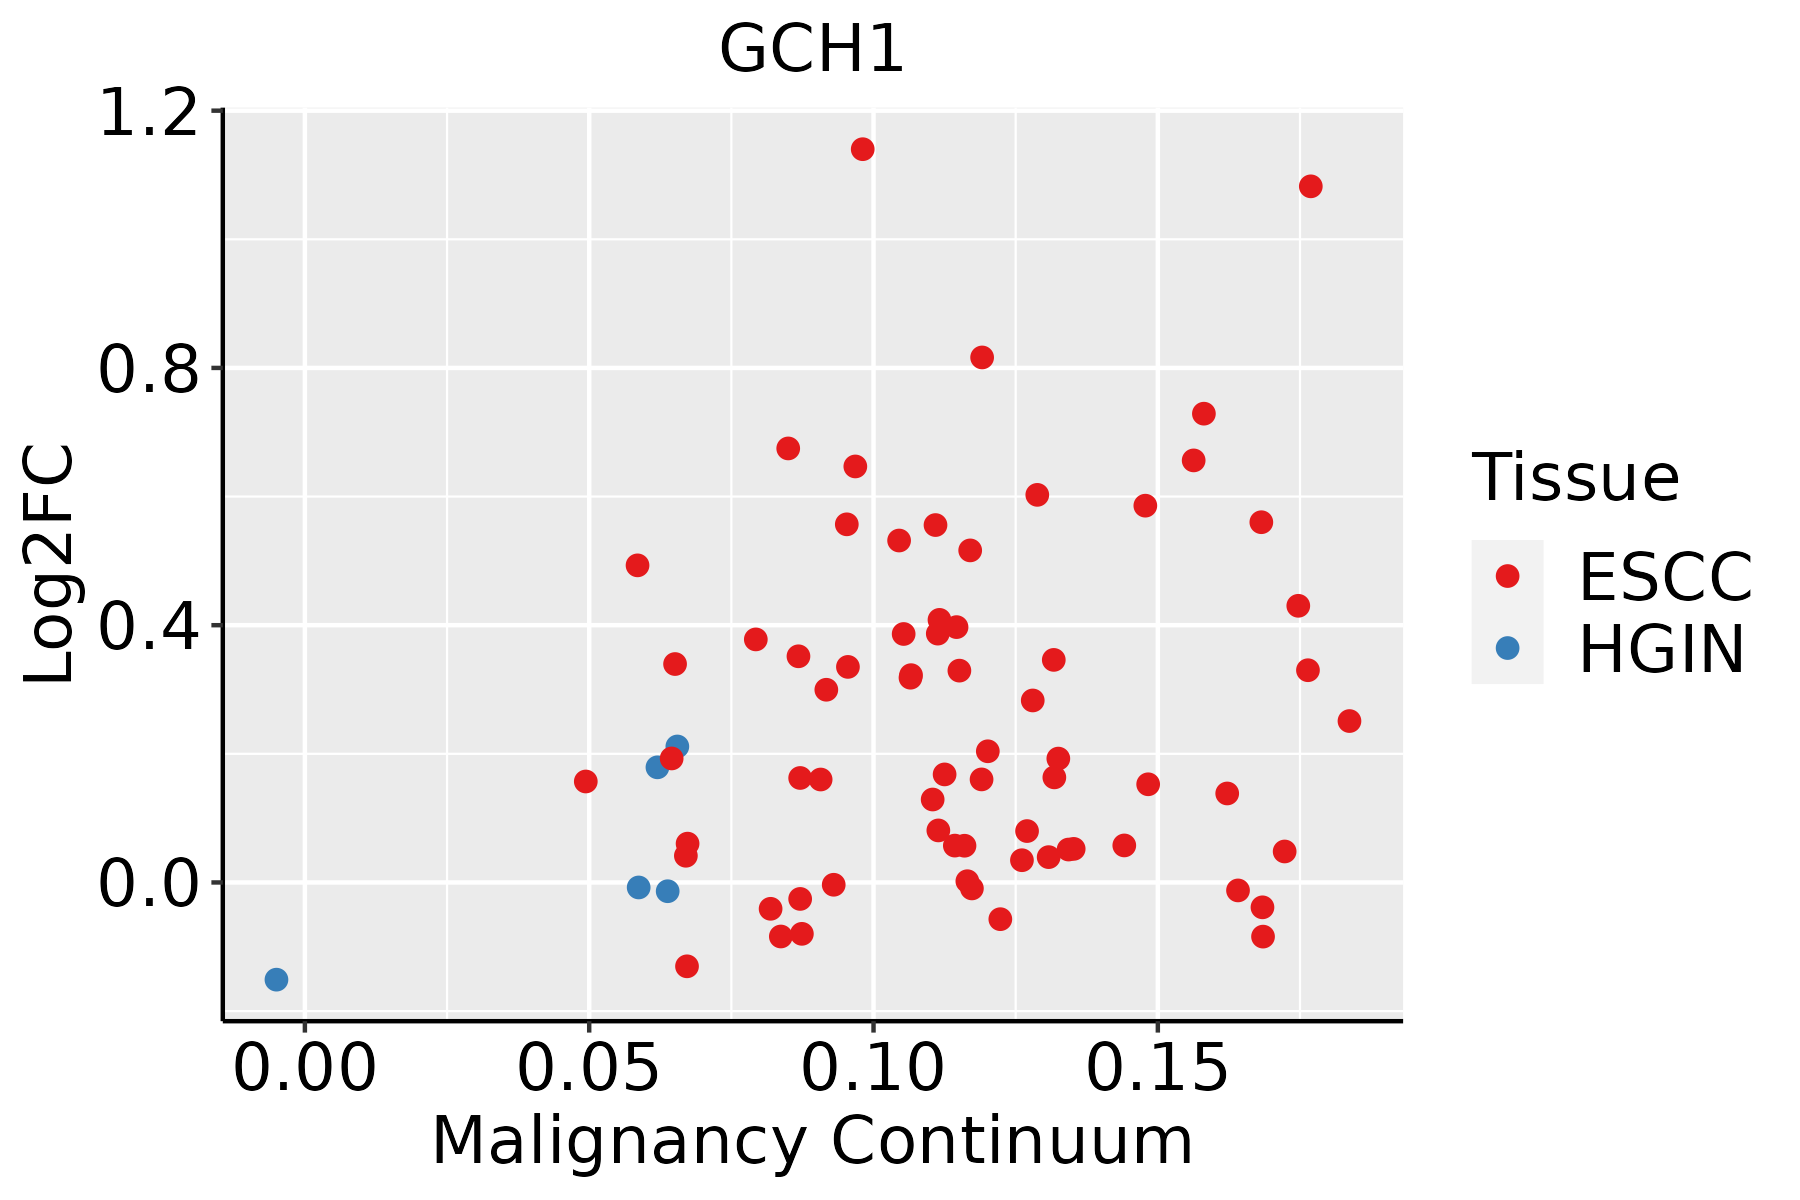 | ESCC: Esophageal squamous cell carcinoma |
| HGIN: High-grade intraepithelial neoplasias | ||
| LGIN: Low-grade intraepithelial neoplasias | ||
| Lung | 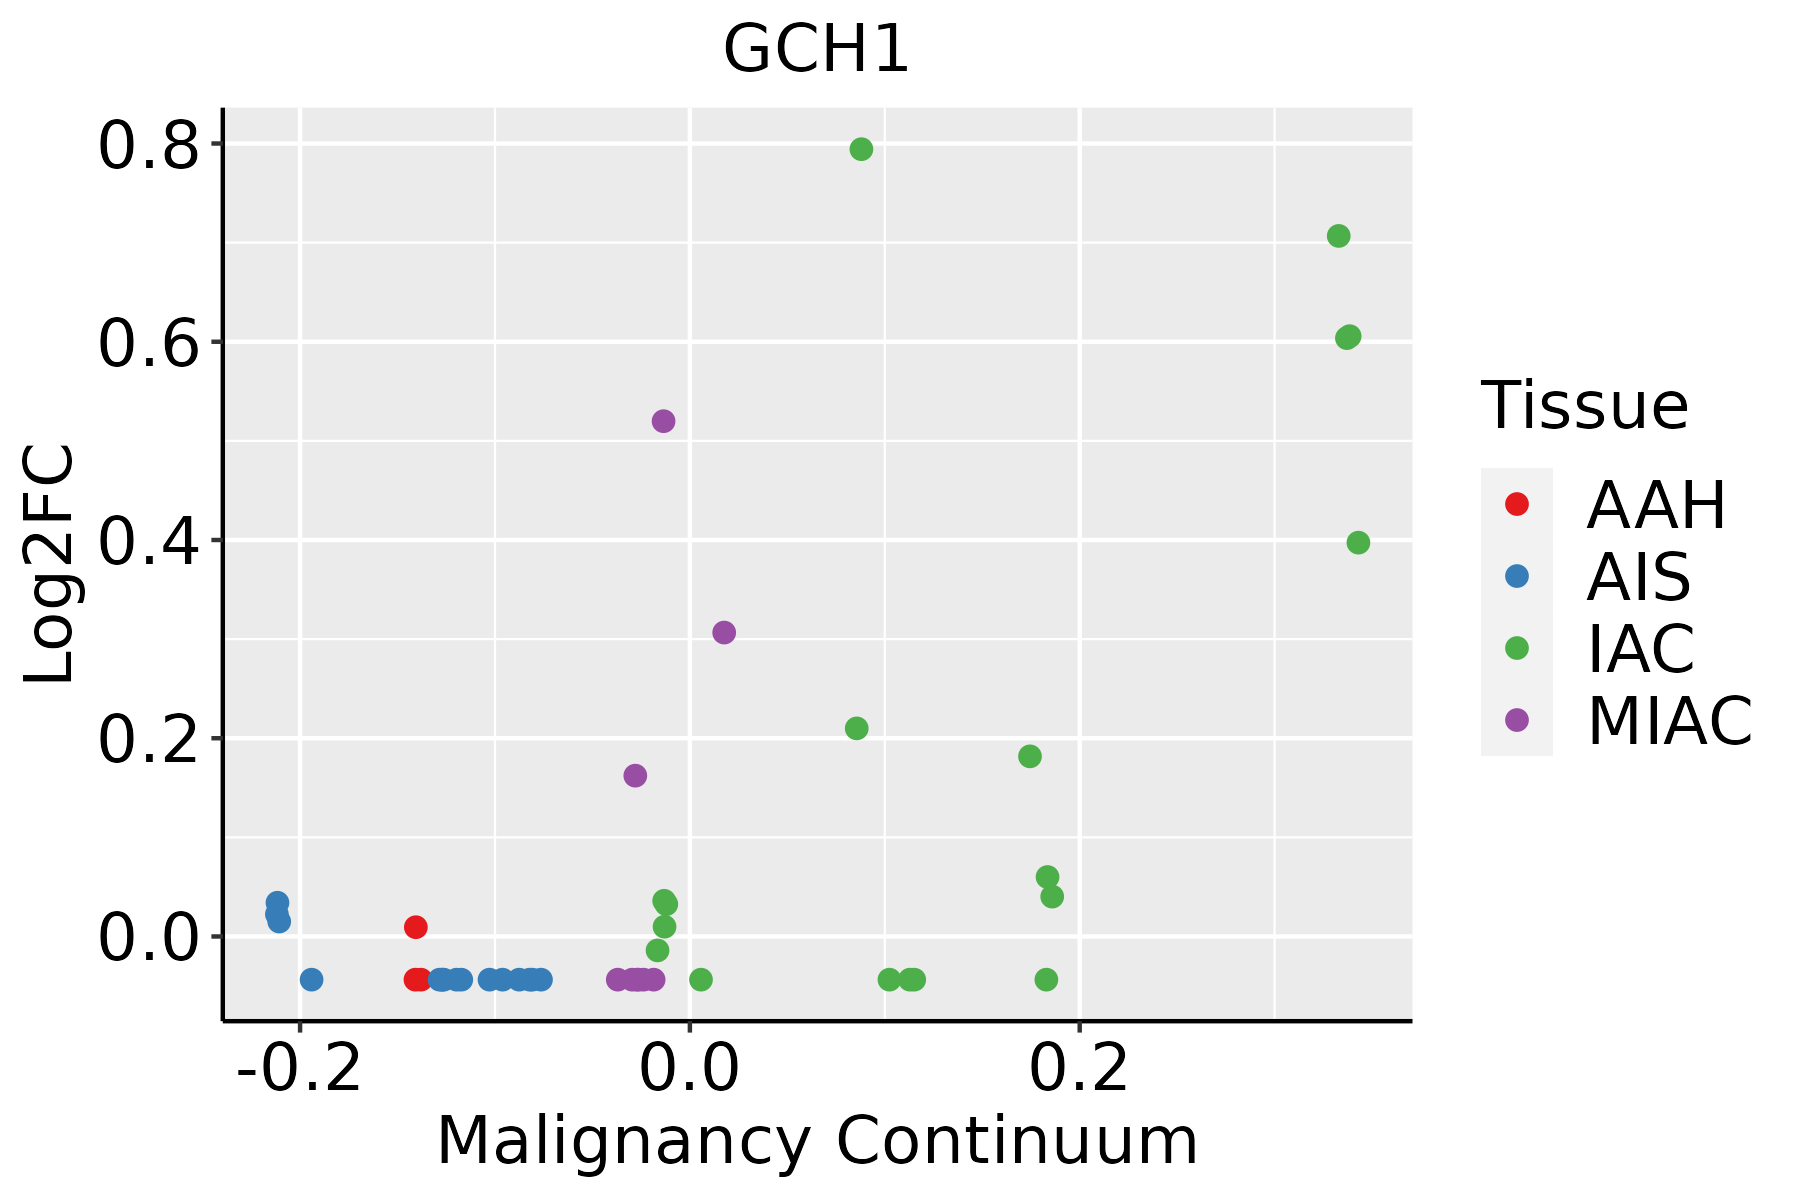 | AAH: Atypical adenomatous hyperplasia |
| AIS: Adenocarcinoma in situ | ||
| IAC: Invasive lung adenocarcinoma | ||
| MIA: Minimally invasive adenocarcinoma | ||
| Oral Cavity | 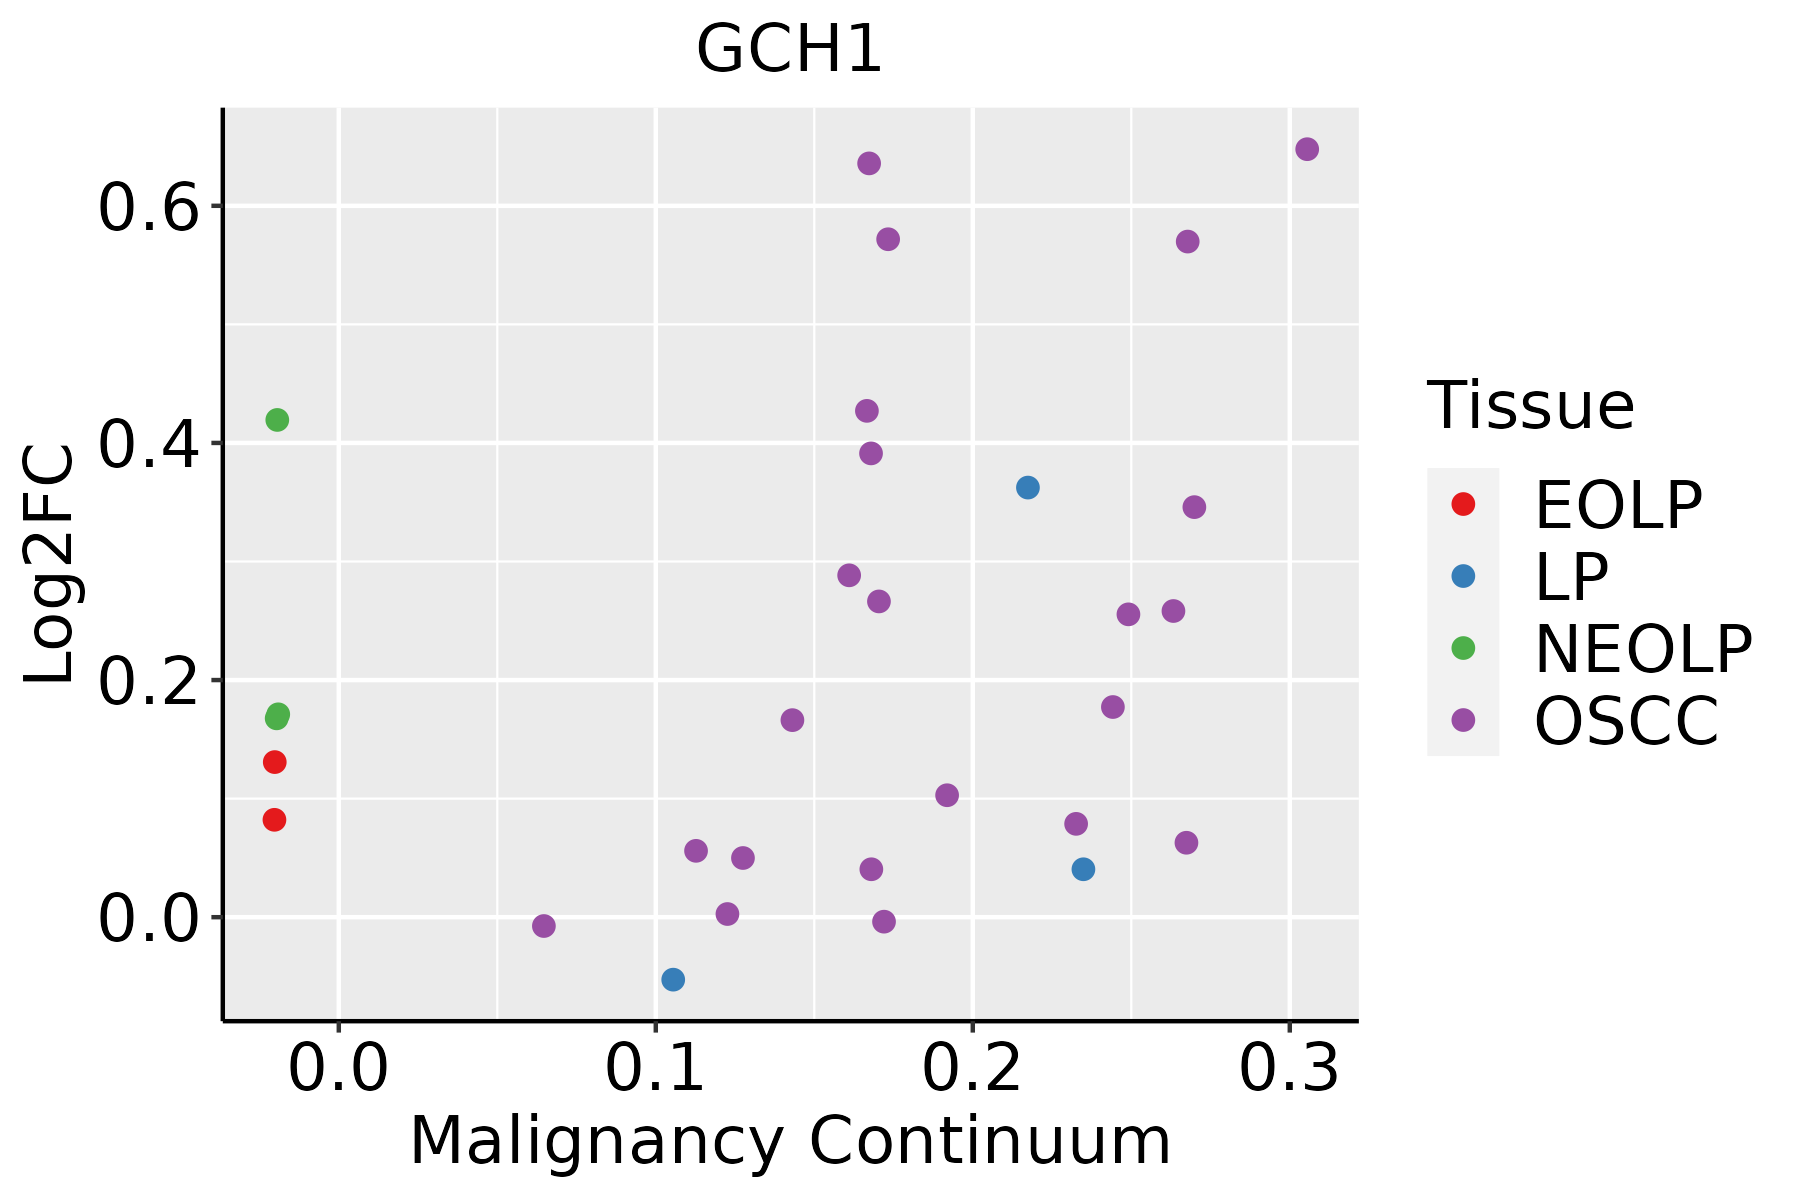 | EOLP: Erosive Oral lichen planus |
| LP: leukoplakia | ||
| NEOLP: Non-erosive oral lichen planus | ||
| OSCC: Oral squamous cell carcinoma |
| ∗log2FC in expression of this searched gene in stem-like cells from each diseased tissue sample relative to stem-like cells in normal samples in each tissue plotted against the malignancy continuum. Samples are colored based on if they are from different disease stage. |
Top |
Malignant transformation related pathway analysis |
| Find out the enriched GO biological processes and KEGG pathways involved in transition from healthy to precancer to cancer |
| Tissue | Disease Stage | Enriched GO biological Processes |
| Colorectum | AD |  |
| Colorectum | SER |  |
| Colorectum | MSS |  |
| Colorectum | MSI-H |  |
| Colorectum | FAP |  |
| ∗Top 15 enriched GO BP terms are showed in the bar plot of each disease state in each tissue. Each row represents a significant GO biological process which is colored according to the -log10(p.adjust). |
| Page: 1 2 3 4 5 6 7 8 9 |
| GO ID | Tissue | Disease Stage | Description | Gene Ratio | Bg Ratio | pvalue | p.adjust | Count |
| GO:0006979111 | Esophagus | ESCC | response to oxidative stress | 303/8552 | 446/18723 | 7.15e-22 | 1.30e-19 | 303 |
| GO:0062197111 | Esophagus | ESCC | cellular response to chemical stress | 234/8552 | 337/18723 | 5.37e-19 | 5.97e-17 | 234 |
| GO:0034599111 | Esophagus | ESCC | cellular response to oxidative stress | 197/8552 | 288/18723 | 3.76e-15 | 2.15e-13 | 197 |
| GO:0000302111 | Esophagus | ESCC | response to reactive oxygen species | 150/8552 | 222/18723 | 3.06e-11 | 1.02e-09 | 150 |
| GO:003461420 | Esophagus | ESCC | cellular response to reactive oxygen species | 103/8552 | 155/18723 | 1.34e-07 | 2.17e-06 | 103 |
| GO:200037718 | Esophagus | ESCC | regulation of reactive oxygen species metabolic process | 100/8552 | 157/18723 | 3.87e-06 | 4.17e-05 | 100 |
| GO:00060668 | Esophagus | ESCC | alcohol metabolic process | 202/8552 | 353/18723 | 7.32e-06 | 7.26e-05 | 202 |
| GO:003461220 | Esophagus | ESCC | response to tumor necrosis factor | 149/8552 | 253/18723 | 1.47e-05 | 1.33e-04 | 149 |
| GO:00065757 | Esophagus | ESCC | cellular modified amino acid metabolic process | 112/8552 | 188/18723 | 8.31e-05 | 6.06e-04 | 112 |
| GO:00423986 | Esophagus | ESCC | cellular modified amino acid biosynthetic process | 34/8552 | 46/18723 | 9.39e-05 | 6.70e-04 | 34 |
| GO:000963620 | Esophagus | ESCC | response to toxic substance | 150/8552 | 262/18723 | 1.00e-04 | 7.12e-04 | 150 |
| GO:003249619 | Esophagus | ESCC | response to lipopolysaccharide | 191/8552 | 343/18723 | 1.11e-04 | 7.73e-04 | 191 |
| GO:00343418 | Esophagus | ESCC | response to interferon-gamma | 86/8552 | 141/18723 | 1.74e-04 | 1.14e-03 | 86 |
| GO:007259318 | Esophagus | ESCC | reactive oxygen species metabolic process | 137/8552 | 239/18723 | 1.82e-04 | 1.16e-03 | 137 |
| GO:00425584 | Esophagus | ESCC | pteridine-containing compound metabolic process | 25/8552 | 33/18723 | 4.30e-04 | 2.43e-03 | 25 |
| GO:00461653 | Esophagus | ESCC | alcohol biosynthetic process | 83/8552 | 140/18723 | 8.04e-04 | 4.16e-03 | 83 |
| GO:1990748110 | Esophagus | ESCC | cellular detoxification | 70/8552 | 116/18723 | 1.02e-03 | 5.17e-03 | 70 |
| GO:00425595 | Esophagus | ESCC | pteridine-containing compound biosynthetic process | 13/8552 | 15/18723 | 1.31e-03 | 6.26e-03 | 13 |
| GO:000223719 | Esophagus | ESCC | response to molecule of bacterial origin | 194/8552 | 363/18723 | 1.64e-03 | 7.61e-03 | 194 |
| GO:000680917 | Esophagus | ESCC | nitric oxide biosynthetic process | 47/8552 | 76/18723 | 3.29e-03 | 1.35e-02 | 47 |
| Page: 1 2 3 4 5 |
| Pathway ID | Tissue | Disease Stage | Description | Gene Ratio | Bg Ratio | pvalue | p.adjust | qvalue | Count |
| hsa012405 | Esophagus | ESCC | Biosynthesis of cofactors | 97/4205 | 153/8465 | 3.88e-04 | 1.35e-03 | 6.94e-04 | 97 |
| hsa0124012 | Esophagus | ESCC | Biosynthesis of cofactors | 97/4205 | 153/8465 | 3.88e-04 | 1.35e-03 | 6.94e-04 | 97 |
| hsa012404 | Oral cavity | OSCC | Biosynthesis of cofactors | 88/3704 | 153/8465 | 3.84e-04 | 1.20e-03 | 6.12e-04 | 88 |
| hsa0124011 | Oral cavity | OSCC | Biosynthesis of cofactors | 88/3704 | 153/8465 | 3.84e-04 | 1.20e-03 | 6.12e-04 | 88 |
| Page: 1 |
Top |
Cell-cell communication analysis |
| Identification of potential cell-cell interactions between two cell types and their ligand-receptor pairs for different disease states |
| Ligand | Receptor | LRpair | Pathway | Tissue | Disease Stage |
| Page: 1 |
Top |
Single-cell gene regulatory network inference analysis |
| Find out the significant the regulons (TFs) and the target genes of each regulon across cell types for different disease states |
| TF | Cell Type | Tissue | Disease Stage | Target Gene | RSS | Regulon Activity |
| ∗The dot plots of a searched regulon are shown for all cell subpopulations in each disease state of each tissue based on the regulon specific score inferred using pySCENIC and by calculating the average expression. |
| Page: 1 |
Top |
Somatic mutation of malignant transformation related genes |
| Annotation of somatic variants for genes involved in malignant transformation |
| Hugo Symbol | Variant Class | Variant Classification | dbSNP RS | HGVSc | HGVSp | HGVSp Short | SWISSPROT | BIOTYPE | SIFT | PolyPhen | Tumor Sample Barcode | Tissue | Histology | Sex | Age | Stage | Therapy Types | Drugs | Outcome |
| GCH1 | SNV | Missense_Mutation | c.166N>A | p.Glu56Lys | p.E56K | P30793 | protein_coding | tolerated(0.18) | benign(0.007) | TCGA-E2-A15R-01 | Breast | breast invasive carcinoma | Female | <65 | I/II | Chemotherapy | cyclophosphamide | SD | |
| GCH1 | SNV | Missense_Mutation | novel | c.561N>C | p.Lys187Asn | p.K187N | P30793 | protein_coding | deleterious(0.01) | probably_damaging(0.983) | TCGA-2W-A8YY-01 | Cervix | cervical & endocervical cancer | Female | <65 | I/II | Chemotherapy | cisplatin | CR |
| GCH1 | SNV | Missense_Mutation | novel | c.111N>T | p.Glu37Asp | p.E37D | P30793 | protein_coding | tolerated(0.37) | benign(0.001) | TCGA-2W-A8YY-01 | Cervix | cervical & endocervical cancer | Female | <65 | I/II | Chemotherapy | cisplatin | CR |
| GCH1 | SNV | Missense_Mutation | c.676G>A | p.Val226Met | p.V226M | P30793 | protein_coding | deleterious(0.03) | possibly_damaging(0.602) | TCGA-A6-6653-01 | Colorectum | colon adenocarcinoma | Male | >=65 | I/II | Unknown | Unknown | SD | |
| GCH1 | SNV | Missense_Mutation | c.404N>C | p.Ile135Thr | p.I135T | P30793 | protein_coding | deleterious(0) | probably_damaging(0.996) | TCGA-D5-6530-01 | Colorectum | colon adenocarcinoma | Male | <65 | I/II | Unknown | Unknown | SD | |
| GCH1 | SNV | Missense_Mutation | c.355N>A | p.Asp119Asn | p.D119N | P30793 | protein_coding | tolerated(0.37) | benign(0.003) | TCGA-F5-6814-01 | Colorectum | rectum adenocarcinoma | Male | <65 | I/II | Unknown | Unknown | SD | |
| GCH1 | SNV | Missense_Mutation | novel | c.749G>T | p.Ser250Ile | p.S250I | P30793 | protein_coding | deleterious(0) | possibly_damaging(0.657) | TCGA-A5-A0G2-01 | Endometrium | uterine corpus endometrioid carcinoma | Female | <65 | III/IV | Unknown | Unknown | SD |
| GCH1 | SNV | Missense_Mutation | rs886042892 | c.284N>T | p.Pro95Leu | p.P95L | P30793 | protein_coding | deleterious(0) | probably_damaging(0.999) | TCGA-B5-A1MX-01 | Endometrium | uterine corpus endometrioid carcinoma | Female | <65 | I/II | Hormone Therapy | megace | SD |
| GCH1 | SNV | Missense_Mutation | c.384N>T | p.Glu128Asp | p.E128D | P30793 | protein_coding | deleterious(0.03) | benign(0.352) | TCGA-D1-A103-01 | Endometrium | uterine corpus endometrioid carcinoma | Female | >=65 | I/II | Unknown | Unknown | SD | |
| GCH1 | SNV | Missense_Mutation | c.159N>C | p.Trp53Cys | p.W53C | P30793 | protein_coding | tolerated(0.1) | benign(0.001) | TCGA-EC-A24G-01 | Endometrium | uterine corpus endometrioid carcinoma | Female | <65 | I/II | Chemotherapy | doxorubicin | SD |
| Page: 1 2 |
Top |
Related drugs of malignant transformation related genes |
| Identification of chemicals and drugs interact with genes involved in malignant transfromation |
| (DGIdb 4.0) |
| Entrez ID | Symbol | Category | Interaction Types | Drug Claim Name | Drug Name | PMIDs |
| 2643 | GCH1 | ENZYME | ProSavin | |||
| 2643 | GCH1 | ENZYME | Guanine | GUANINE |
| Page: 1 |

Copyright 2023-Present -The University of Texas Health Science Center at Houston |