
|
|||||
|
 | |
| |
| |
| |
| |
| |
|
Gene: GCC2 |
Gene summary for GCC2 |
| Gene information | Species | Human | Gene symbol | GCC2 | Gene ID | 9648 |
| Gene name | GRIP and coiled-coil domain containing 2 | |
| Gene Alias | GCC185 | |
| Cytomap | 2q12.3 | |
| Gene Type | protein-coding | GO ID | GO:0000226 | UniProtAcc | B3KR21 |
Top |
Malignant transformation analysis |
| Identification of the aberrant gene expression in precancerous and cancerous lesions by comparing the gene expression of stem-like cells in diseased tissues with normal stem cells |
| Entrez ID | Symbol | Replicates | Species | Organ | Tissue | Adj P-value | Log2FC | Malignancy |
| 9648 | GCC2 | HTA11_3410_2000001011 | Human | Colorectum | AD | 1.27e-06 | -4.57e-01 | 0.0155 |
| 9648 | GCC2 | HTA11_78_2000001011 | Human | Colorectum | AD | 1.39e-03 | 5.20e-01 | -0.1088 |
| 9648 | GCC2 | HTA11_347_2000001011 | Human | Colorectum | AD | 9.20e-10 | 5.25e-01 | -0.1954 |
| 9648 | GCC2 | HTA11_99999965062_69753 | Human | Colorectum | MSI-H | 1.26e-02 | 9.10e-01 | 0.3487 |
| 9648 | GCC2 | F007 | Human | Colorectum | FAP | 1.82e-14 | 6.53e-01 | 0.1176 |
| 9648 | GCC2 | A001-C-207 | Human | Colorectum | FAP | 2.90e-10 | 4.39e-01 | 0.1278 |
| 9648 | GCC2 | A015-C-203 | Human | Colorectum | FAP | 5.32e-23 | -5.19e-03 | -0.1294 |
| 9648 | GCC2 | A015-C-204 | Human | Colorectum | FAP | 3.37e-07 | 2.26e-01 | -0.0228 |
| 9648 | GCC2 | A014-C-040 | Human | Colorectum | FAP | 1.16e-07 | 3.67e-01 | -0.1184 |
| 9648 | GCC2 | A002-C-201 | Human | Colorectum | FAP | 2.40e-15 | 3.04e-01 | 0.0324 |
| 9648 | GCC2 | A002-C-203 | Human | Colorectum | FAP | 4.12e-06 | 2.46e-01 | 0.2786 |
| 9648 | GCC2 | A001-C-119 | Human | Colorectum | FAP | 5.52e-17 | 4.97e-01 | -0.1557 |
| 9648 | GCC2 | A001-C-108 | Human | Colorectum | FAP | 3.47e-38 | 6.27e-01 | -0.0272 |
| 9648 | GCC2 | A002-C-205 | Human | Colorectum | FAP | 3.43e-31 | 4.15e-01 | -0.1236 |
| 9648 | GCC2 | A001-C-104 | Human | Colorectum | FAP | 1.06e-13 | 4.64e-01 | 0.0184 |
| 9648 | GCC2 | A015-C-005 | Human | Colorectum | FAP | 7.86e-05 | 3.17e-01 | -0.0336 |
| 9648 | GCC2 | A015-C-006 | Human | Colorectum | FAP | 7.21e-28 | 5.36e-01 | -0.0994 |
| 9648 | GCC2 | A015-C-106 | Human | Colorectum | FAP | 1.39e-11 | 2.73e-01 | -0.0511 |
| 9648 | GCC2 | A002-C-114 | Human | Colorectum | FAP | 7.47e-20 | 2.03e-01 | -0.1561 |
| 9648 | GCC2 | A015-C-104 | Human | Colorectum | FAP | 7.37e-28 | 4.08e-02 | -0.1899 |
| Page: 1 2 3 4 5 6 7 8 9 10 11 |
| Tissue | Expression Dynamics | Abbreviation |
| Colorectum (GSE201348) |  | FAP: Familial adenomatous polyposis |
| CRC: Colorectal cancer | ||
| Colorectum (HTA11) |  | AD: Adenomas |
| SER: Sessile serrated lesions | ||
| MSI-H: Microsatellite-high colorectal cancer | ||
| MSS: Microsatellite stable colorectal cancer | ||
| Endometrium | 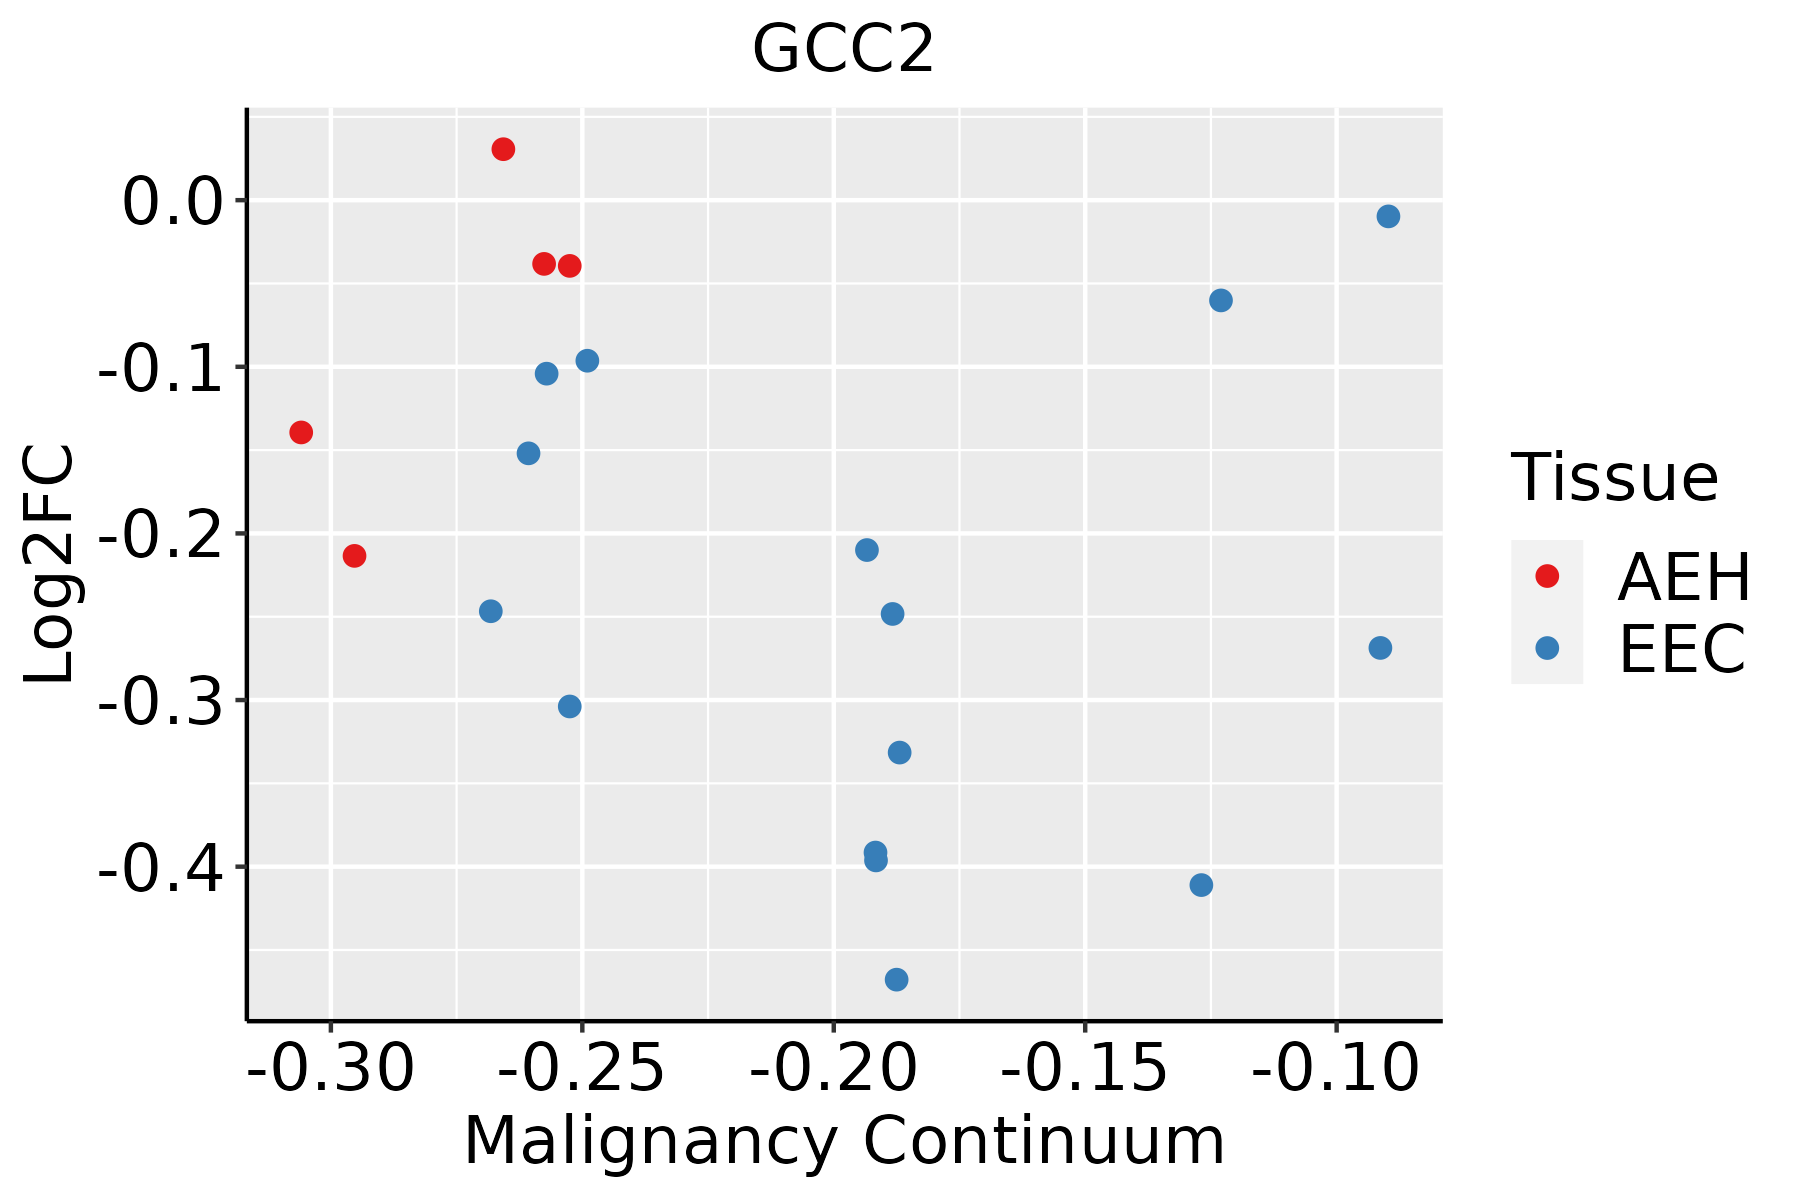 | AEH: Atypical endometrial hyperplasia |
| EEC: Endometrioid Cancer | ||
| Esophagus | 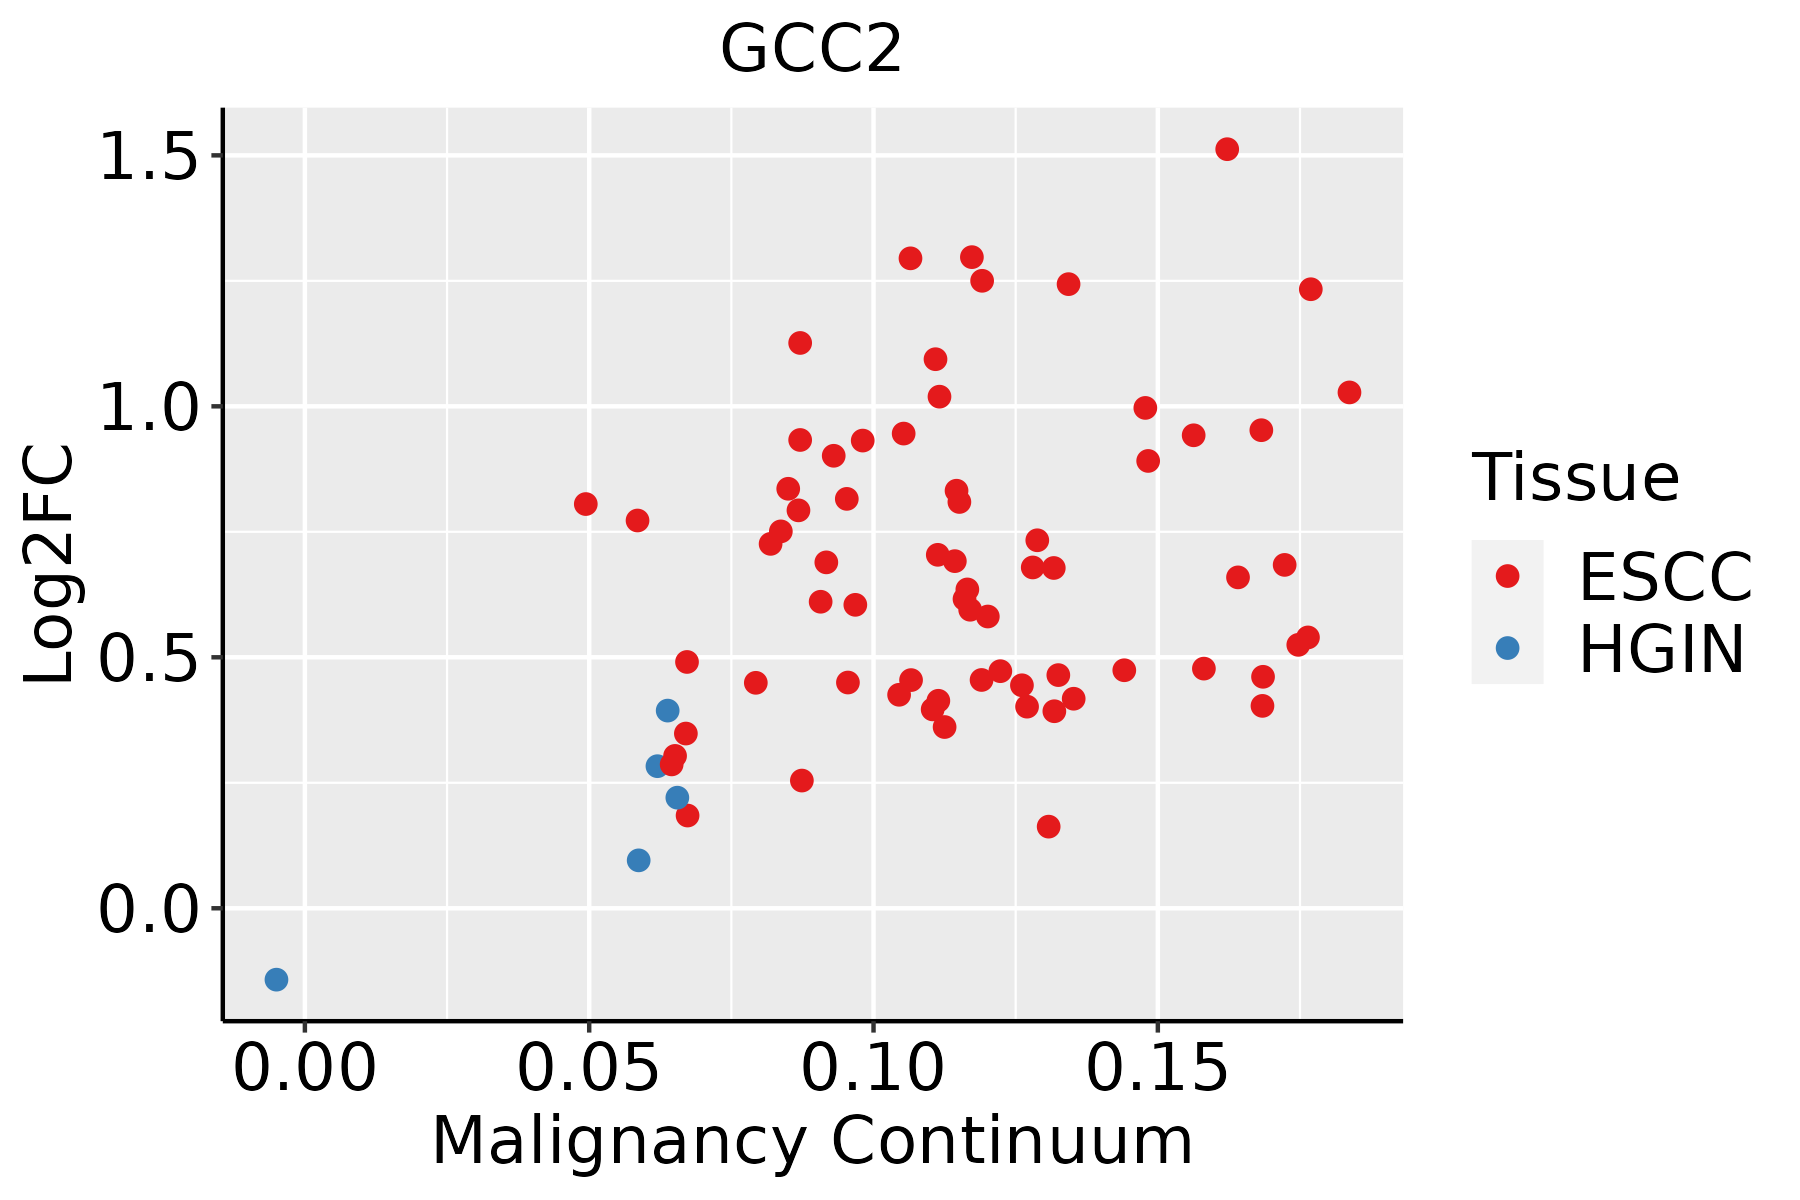 | ESCC: Esophageal squamous cell carcinoma |
| HGIN: High-grade intraepithelial neoplasias | ||
| LGIN: Low-grade intraepithelial neoplasias | ||
| Liver | 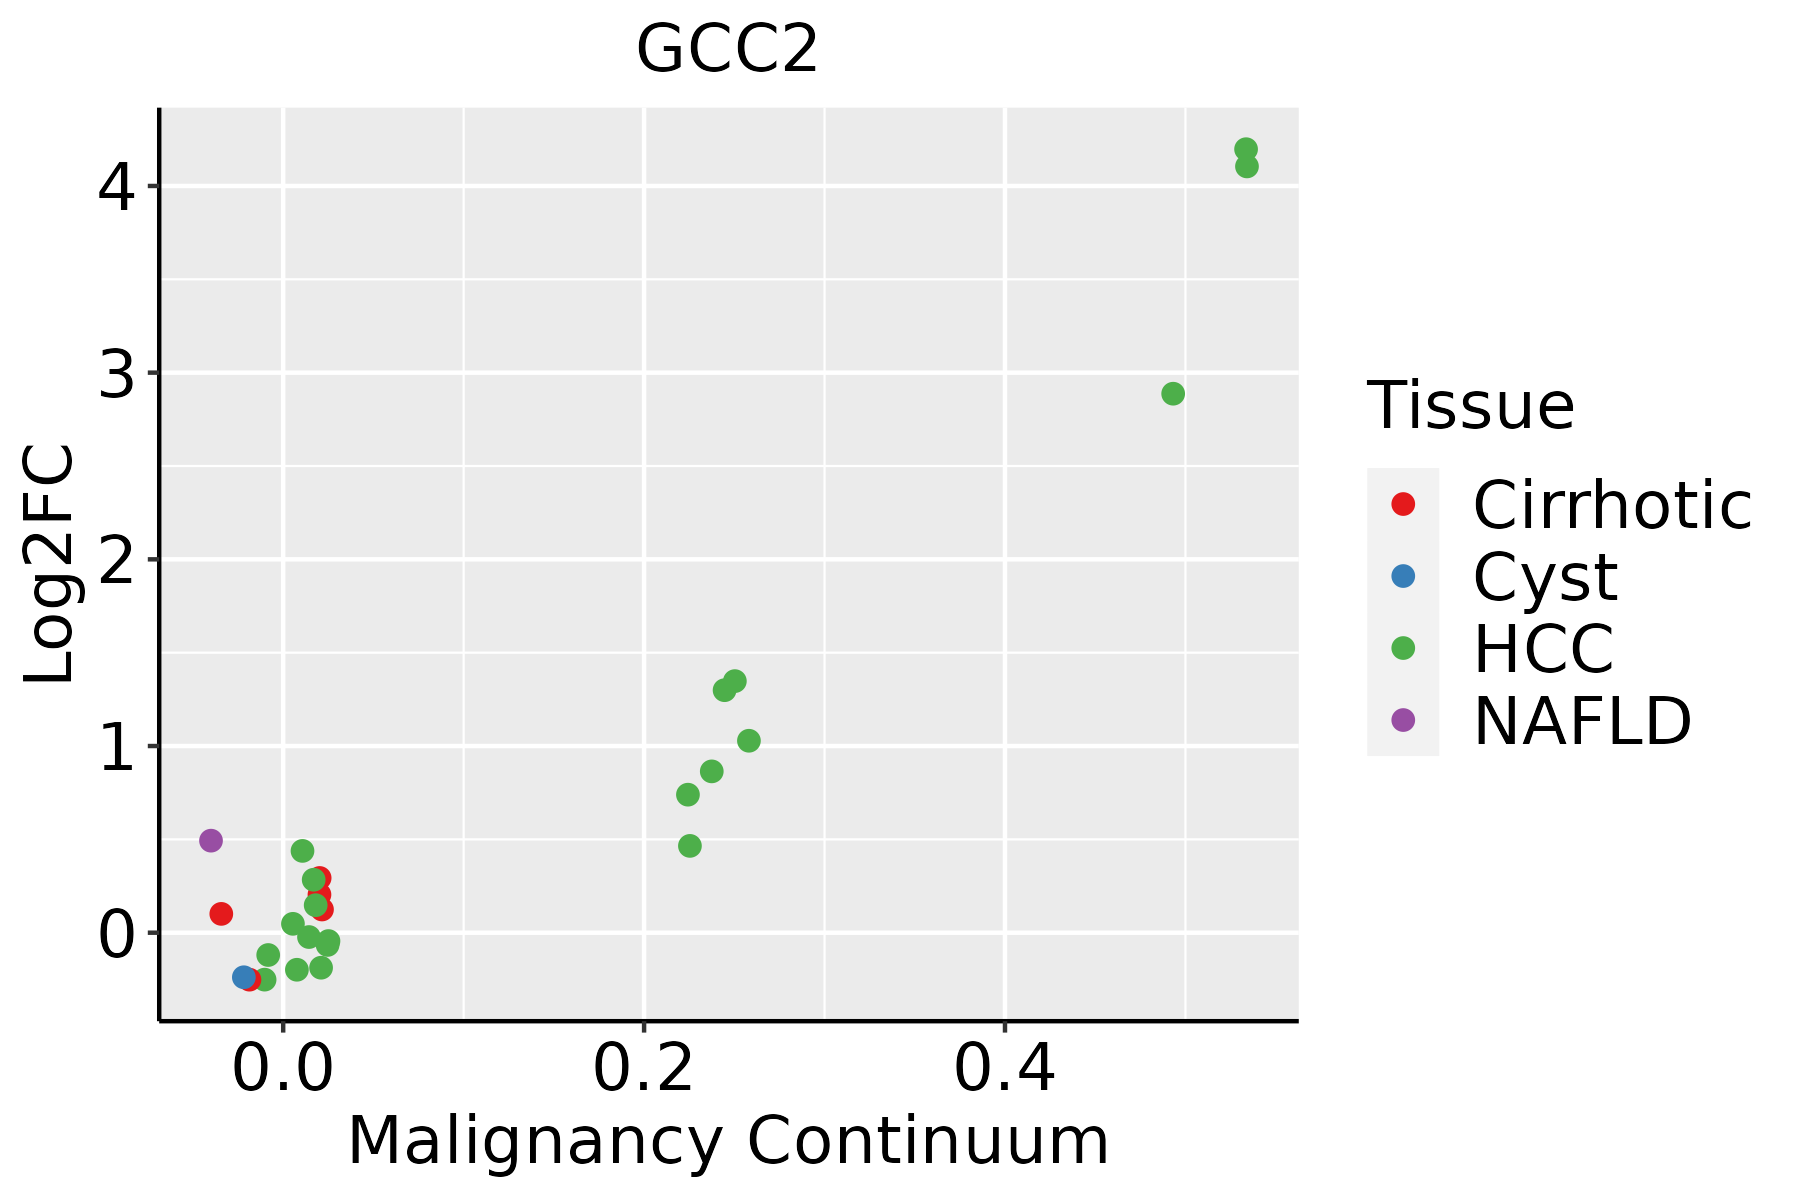 | HCC: Hepatocellular carcinoma |
| NAFLD: Non-alcoholic fatty liver disease | ||
| Lung | 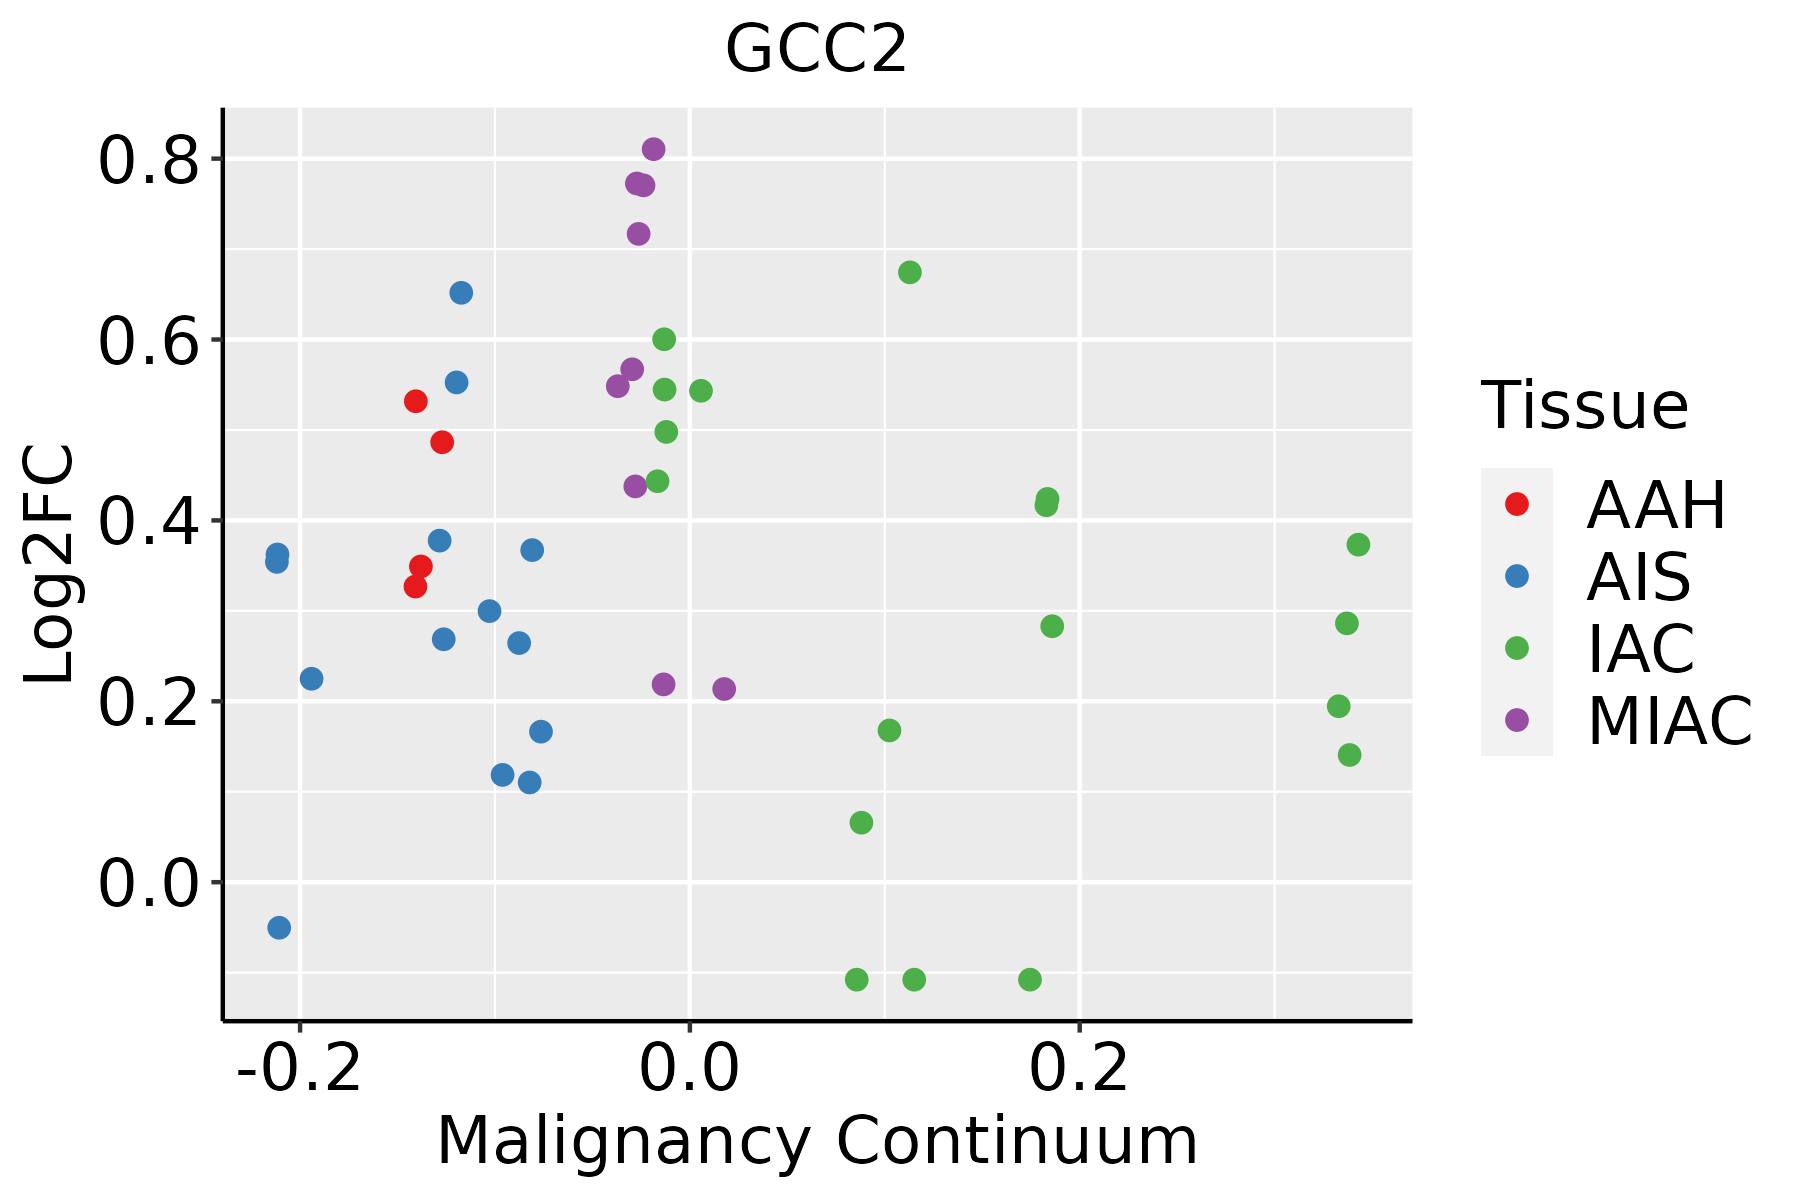 | AAH: Atypical adenomatous hyperplasia |
| AIS: Adenocarcinoma in situ | ||
| IAC: Invasive lung adenocarcinoma | ||
| MIA: Minimally invasive adenocarcinoma | ||
| Oral Cavity |  | EOLP: Erosive Oral lichen planus |
| LP: leukoplakia | ||
| NEOLP: Non-erosive oral lichen planus | ||
| OSCC: Oral squamous cell carcinoma | ||
| Prostate | 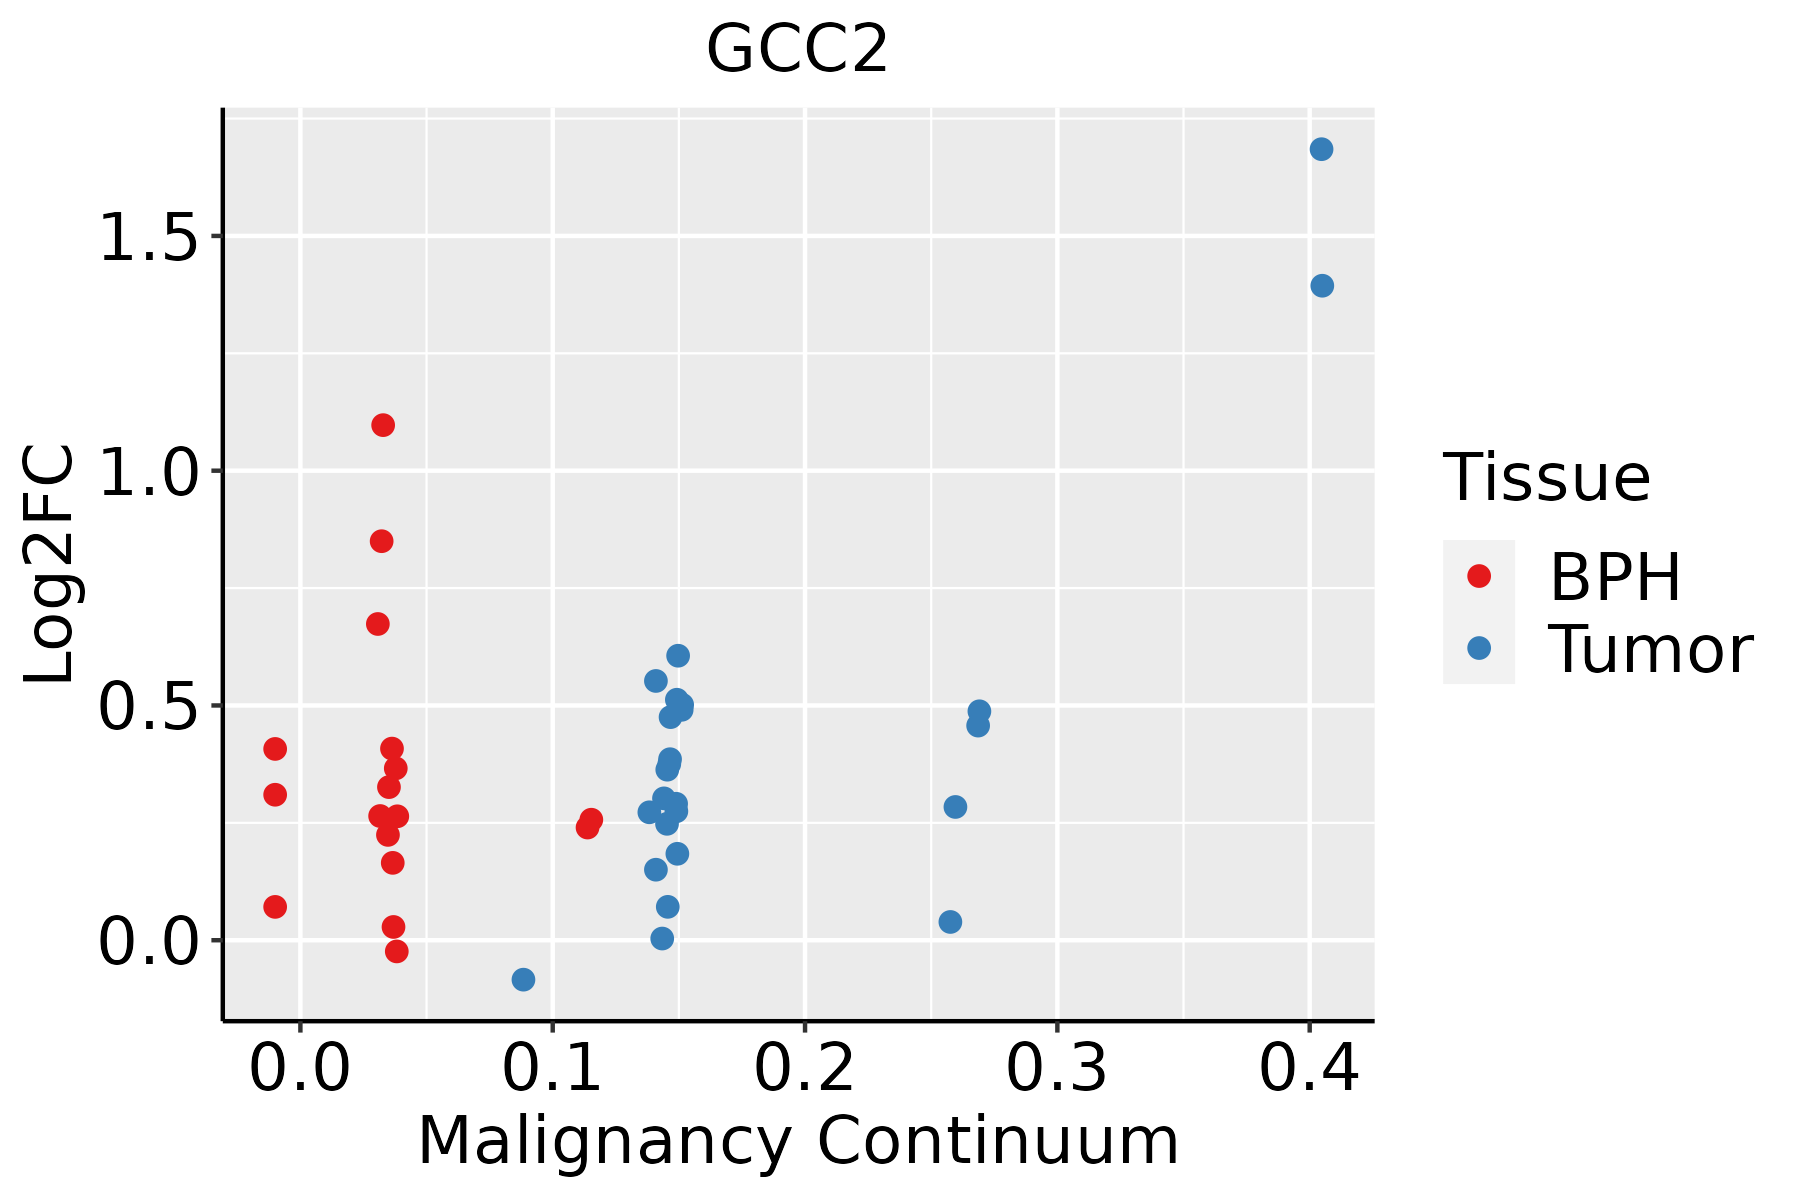 | BPH: Benign Prostatic Hyperplasia |
| Skin | 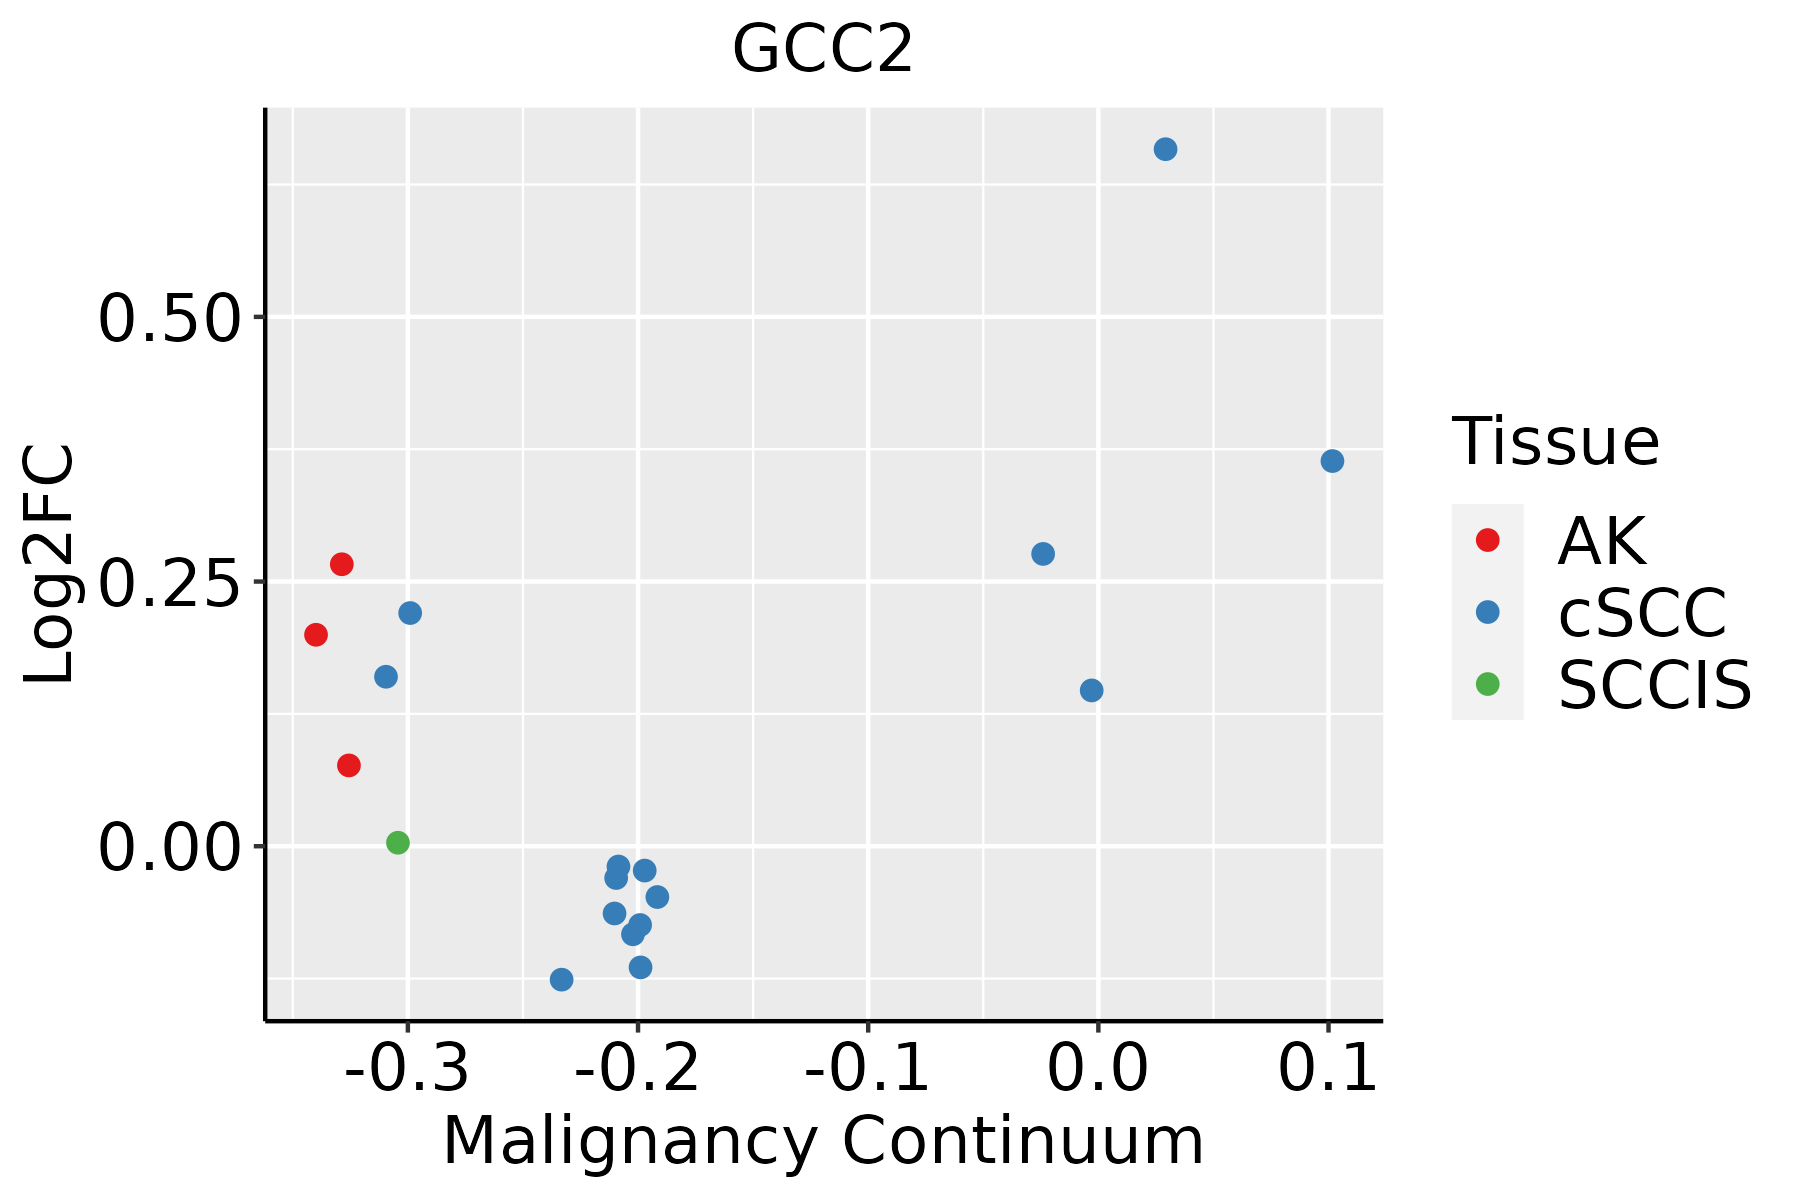 | AK: Actinic keratosis |
| cSCC: Cutaneous squamous cell carcinoma | ||
| SCCIS:squamous cell carcinoma in situ | ||
| Thyroid | 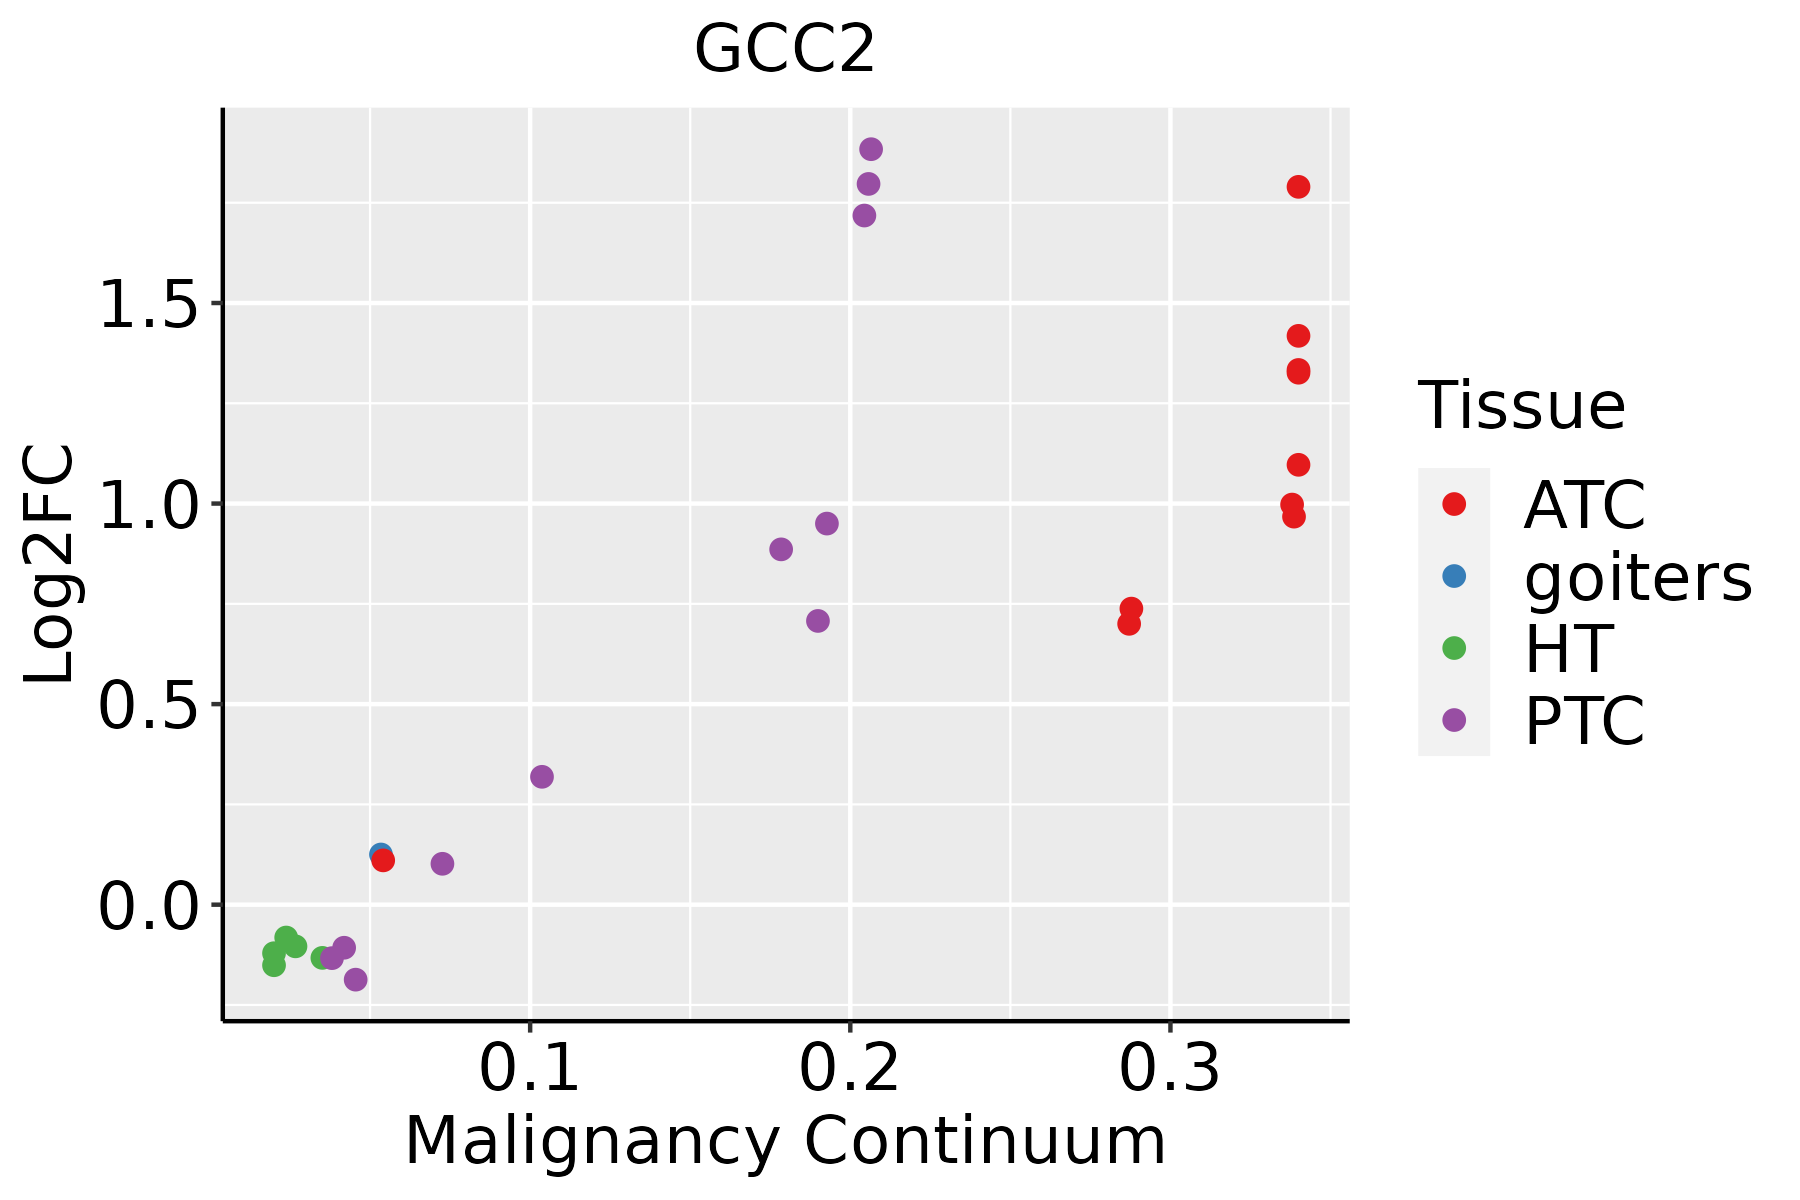 | ATC: Anaplastic thyroid cancer |
| HT: Hashimoto's thyroiditis | ||
| PTC: Papillary thyroid cancer |
| ∗log2FC in expression of this searched gene in stem-like cells from each diseased tissue sample relative to stem-like cells in normal samples in each tissue plotted against the malignancy continuum. Samples are colored based on if they are from different disease stage. |
Top |
Malignant transformation related pathway analysis |
| Find out the enriched GO biological processes and KEGG pathways involved in transition from healthy to precancer to cancer |
| Tissue | Disease Stage | Enriched GO biological Processes |
| Colorectum | AD |  |
| Colorectum | SER |  |
| Colorectum | MSS |  |
| Colorectum | MSI-H |  |
| Colorectum | FAP |  |
| ∗Top 15 enriched GO BP terms are showed in the bar plot of each disease state in each tissue. Each row represents a significant GO biological process which is colored according to the -log10(p.adjust). |
| Page: 1 2 3 4 5 6 7 8 9 |
| GO ID | Tissue | Disease Stage | Description | Gene Ratio | Bg Ratio | pvalue | p.adjust | Count |
| GO:0072594 | Colorectum | AD | establishment of protein localization to organelle | 148/3918 | 422/18723 | 7.95e-12 | 1.04e-09 | 148 |
| GO:0048193 | Colorectum | AD | Golgi vesicle transport | 109/3918 | 296/18723 | 1.80e-10 | 1.68e-08 | 109 |
| GO:0016197 | Colorectum | AD | endosomal transport | 90/3918 | 230/18723 | 1.88e-10 | 1.73e-08 | 90 |
| GO:0016482 | Colorectum | AD | cytosolic transport | 68/3918 | 168/18723 | 6.00e-09 | 3.72e-07 | 68 |
| GO:0006605 | Colorectum | AD | protein targeting | 105/3918 | 314/18723 | 1.39e-07 | 6.44e-06 | 105 |
| GO:0007034 | Colorectum | AD | vacuolar transport | 60/3918 | 157/18723 | 4.97e-07 | 1.85e-05 | 60 |
| GO:0032386 | Colorectum | AD | regulation of intracellular transport | 109/3918 | 337/18723 | 5.33e-07 | 1.95e-05 | 109 |
| GO:0033157 | Colorectum | AD | regulation of intracellular protein transport | 80/3918 | 229/18723 | 5.81e-07 | 2.09e-05 | 80 |
| GO:0042147 | Colorectum | AD | retrograde transport, endosome to Golgi | 37/3918 | 91/18723 | 1.46e-05 | 3.14e-04 | 37 |
| GO:0007041 | Colorectum | AD | lysosomal transport | 42/3918 | 114/18723 | 6.61e-05 | 1.07e-03 | 42 |
| GO:0072665 | Colorectum | AD | protein localization to vacuole | 27/3918 | 67/18723 | 2.40e-04 | 3.04e-03 | 27 |
| GO:0034067 | Colorectum | AD | protein localization to Golgi apparatus | 14/3918 | 29/18723 | 9.40e-04 | 8.92e-03 | 14 |
| GO:0061462 | Colorectum | AD | protein localization to lysosome | 19/3918 | 46/18723 | 1.36e-03 | 1.19e-02 | 19 |
| GO:0006623 | Colorectum | AD | protein targeting to vacuole | 15/3918 | 37/18723 | 5.24e-03 | 3.47e-02 | 15 |
| GO:0072666 | Colorectum | AD | establishment of protein localization to vacuole | 18/3918 | 49/18723 | 7.93e-03 | 4.73e-02 | 18 |
| GO:00725943 | Colorectum | MSI-H | establishment of protein localization to organelle | 63/1319 | 422/18723 | 1.10e-08 | 1.33e-06 | 63 |
| GO:00066053 | Colorectum | MSI-H | protein targeting | 44/1319 | 314/18723 | 9.50e-06 | 4.55e-04 | 44 |
| GO:00323863 | Colorectum | MSI-H | regulation of intracellular transport | 46/1319 | 337/18723 | 1.20e-05 | 5.48e-04 | 46 |
| GO:00331573 | Colorectum | MSI-H | regulation of intracellular protein transport | 33/1319 | 229/18723 | 6.86e-05 | 2.29e-03 | 33 |
| GO:00481933 | Colorectum | MSI-H | Golgi vesicle transport | 39/1319 | 296/18723 | 1.17e-04 | 3.51e-03 | 39 |
| Page: 1 2 3 4 5 6 7 8 9 10 11 12 13 14 15 16 17 |
| Pathway ID | Tissue | Disease Stage | Description | Gene Ratio | Bg Ratio | pvalue | p.adjust | qvalue | Count |
| hsa05132 | Colorectum | AD | Salmonella infection | 102/2092 | 249/8465 | 7.65e-09 | 1.28e-07 | 8.17e-08 | 102 |
| hsa051321 | Colorectum | AD | Salmonella infection | 102/2092 | 249/8465 | 7.65e-09 | 1.28e-07 | 8.17e-08 | 102 |
| hsa051326 | Colorectum | MSI-H | Salmonella infection | 43/797 | 249/8465 | 5.91e-05 | 8.33e-04 | 6.98e-04 | 43 |
| hsa051327 | Colorectum | MSI-H | Salmonella infection | 43/797 | 249/8465 | 5.91e-05 | 8.33e-04 | 6.98e-04 | 43 |
| hsa051328 | Colorectum | FAP | Salmonella infection | 67/1404 | 249/8465 | 2.04e-05 | 2.52e-04 | 1.53e-04 | 67 |
| hsa051329 | Colorectum | FAP | Salmonella infection | 67/1404 | 249/8465 | 2.04e-05 | 2.52e-04 | 1.53e-04 | 67 |
| hsa0513210 | Colorectum | CRC | Salmonella infection | 48/1091 | 249/8465 | 2.43e-03 | 1.69e-02 | 1.15e-02 | 48 |
| hsa0513211 | Colorectum | CRC | Salmonella infection | 48/1091 | 249/8465 | 2.43e-03 | 1.69e-02 | 1.15e-02 | 48 |
| hsa0513226 | Endometrium | AEH | Salmonella infection | 71/1197 | 249/8465 | 1.69e-09 | 3.44e-08 | 2.52e-08 | 71 |
| hsa05132112 | Endometrium | AEH | Salmonella infection | 71/1197 | 249/8465 | 1.69e-09 | 3.44e-08 | 2.52e-08 | 71 |
| hsa0513227 | Endometrium | EEC | Salmonella infection | 71/1237 | 249/8465 | 7.11e-09 | 1.30e-07 | 9.69e-08 | 71 |
| hsa0513236 | Endometrium | EEC | Salmonella infection | 71/1237 | 249/8465 | 7.11e-09 | 1.30e-07 | 9.69e-08 | 71 |
| hsa05132211 | Esophagus | ESCC | Salmonella infection | 191/4205 | 249/8465 | 6.51e-19 | 5.45e-17 | 2.79e-17 | 191 |
| hsa05132310 | Esophagus | ESCC | Salmonella infection | 191/4205 | 249/8465 | 6.51e-19 | 5.45e-17 | 2.79e-17 | 191 |
| hsa0513214 | Liver | NAFLD | Salmonella infection | 55/1043 | 249/8465 | 8.48e-06 | 3.09e-04 | 2.49e-04 | 55 |
| hsa0513215 | Liver | NAFLD | Salmonella infection | 55/1043 | 249/8465 | 8.48e-06 | 3.09e-04 | 2.49e-04 | 55 |
| hsa0513222 | Liver | Cirrhotic | Salmonella infection | 121/2530 | 249/8465 | 2.47e-10 | 5.13e-09 | 3.16e-09 | 121 |
| hsa0513232 | Liver | Cirrhotic | Salmonella infection | 121/2530 | 249/8465 | 2.47e-10 | 5.13e-09 | 3.16e-09 | 121 |
| hsa0513242 | Liver | HCC | Salmonella infection | 178/4020 | 249/8465 | 5.90e-15 | 1.98e-13 | 1.10e-13 | 178 |
| hsa0513252 | Liver | HCC | Salmonella infection | 178/4020 | 249/8465 | 5.90e-15 | 1.98e-13 | 1.10e-13 | 178 |
| Page: 1 2 |
Top |
Cell-cell communication analysis |
| Identification of potential cell-cell interactions between two cell types and their ligand-receptor pairs for different disease states |
| Ligand | Receptor | LRpair | Pathway | Tissue | Disease Stage |
| Page: 1 |
Top |
Single-cell gene regulatory network inference analysis |
| Find out the significant the regulons (TFs) and the target genes of each regulon across cell types for different disease states |
| TF | Cell Type | Tissue | Disease Stage | Target Gene | RSS | Regulon Activity |
| ∗The dot plots of a searched regulon are shown for all cell subpopulations in each disease state of each tissue based on the regulon specific score inferred using pySCENIC and by calculating the average expression. |
| Page: 1 |
Top |
Somatic mutation of malignant transformation related genes |
| Annotation of somatic variants for genes involved in malignant transformation |
| Hugo Symbol | Variant Class | Variant Classification | dbSNP RS | HGVSc | HGVSp | HGVSp Short | SWISSPROT | BIOTYPE | SIFT | PolyPhen | Tumor Sample Barcode | Tissue | Histology | Sex | Age | Stage | Therapy Types | Drugs | Outcome |
| GCC2 | SNV | Missense_Mutation | rs747941337 | c.3598N>G | p.Leu1200Val | p.L1200V | Q8IWJ2 | protein_coding | deleterious(0.02) | possibly_damaging(0.715) | TCGA-A2-A04R-01 | Breast | breast invasive carcinoma | Female | <65 | I/II | Chemotherapy | taxol | SD |
| GCC2 | SNV | Missense_Mutation | c.2112N>C | p.Leu704Phe | p.L704F | Q8IWJ2 | protein_coding | deleterious(0.01) | possibly_damaging(0.454) | TCGA-AC-A23H-01 | Breast | breast invasive carcinoma | Female | >=65 | I/II | Unknown | Unknown | PD | |
| GCC2 | SNV | Missense_Mutation | novel | c.2338N>C | p.Val780Leu | p.V780L | Q8IWJ2 | protein_coding | tolerated(1) | benign(0) | TCGA-AC-A3QQ-01 | Breast | breast invasive carcinoma | Female | <65 | I/II | Unknown | Unknown | SD |
| GCC2 | SNV | Missense_Mutation | c.4710N>C | p.Lys1570Asn | p.K1570N | Q8IWJ2 | protein_coding | deleterious(0) | probably_damaging(0.97) | TCGA-AN-A04C-01 | Breast | breast invasive carcinoma | Female | <65 | I/II | Unknown | Unknown | SD | |
| GCC2 | SNV | Missense_Mutation | c.2272C>A | p.Gln758Lys | p.Q758K | Q8IWJ2 | protein_coding | tolerated(0.05) | probably_damaging(0.989) | TCGA-AN-A0XW-01 | Breast | breast invasive carcinoma | Female | <65 | III/IV | Unknown | Unknown | SD | |
| GCC2 | SNV | Missense_Mutation | c.4249G>C | p.Glu1417Gln | p.E1417Q | Q8IWJ2 | protein_coding | deleterious(0.02) | probably_damaging(0.996) | TCGA-AR-A0TX-01 | Breast | breast invasive carcinoma | Female | <65 | I/II | Unknown | Unknown | SD | |
| GCC2 | SNV | Missense_Mutation | c.3394C>A | p.Gln1132Lys | p.Q1132K | Q8IWJ2 | protein_coding | deleterious(0.04) | benign(0.058) | TCGA-B6-A0WT-01 | Breast | breast invasive carcinoma | Female | <65 | I/II | Unknown | Unknown | PD | |
| GCC2 | SNV | Missense_Mutation | c.1158N>T | p.Lys386Asn | p.K386N | Q8IWJ2 | protein_coding | deleterious(0) | probably_damaging(0.997) | TCGA-C8-A26Y-01 | Breast | breast invasive carcinoma | Female | >=65 | I/II | Unknown | Unknown | SD | |
| GCC2 | SNV | Missense_Mutation | c.4835N>G | p.Ser1612Cys | p.S1612C | Q8IWJ2 | protein_coding | deleterious(0) | probably_damaging(0.997) | TCGA-D8-A147-01 | Breast | breast invasive carcinoma | Female | <65 | I/II | Chemotherapy | doxorubicine | SD | |
| GCC2 | SNV | Missense_Mutation | c.1600N>G | p.Leu534Val | p.L534V | Q8IWJ2 | protein_coding | tolerated(0.06) | benign(0.223) | TCGA-D8-A1XT-01 | Breast | breast invasive carcinoma | Female | <65 | I/II | Chemotherapy | adriamycin+cyclophosphamide | SD |
| Page: 1 2 3 4 5 6 7 8 9 10 11 12 13 14 15 16 17 18 |
Top |
Related drugs of malignant transformation related genes |
| Identification of chemicals and drugs interact with genes involved in malignant transfromation |
| (DGIdb 4.0) |
| Entrez ID | Symbol | Category | Interaction Types | Drug Claim Name | Drug Name | PMIDs |
| Page: 1 |

Copyright 2023-Present -The University of Texas Health Science Center at Houston |