
|
|||||
|
 | |
| |
| |
| |
| |
| |
|
Gene: GCA |
Gene summary for GCA |
| Gene information | Species | Human | Gene symbol | GCA | Gene ID | 25801 |
| Gene name | grancalcin | |
| Gene Alias | GCL | |
| Cytomap | 2q24.2 | |
| Gene Type | protein-coding | GO ID | GO:0008150 | UniProtAcc | H7BXD5 |
Top |
Malignant transformation analysis |
| Identification of the aberrant gene expression in precancerous and cancerous lesions by comparing the gene expression of stem-like cells in diseased tissues with normal stem cells |
| Entrez ID | Symbol | Replicates | Species | Organ | Tissue | Adj P-value | Log2FC | Malignancy |
| 25801 | GCA | LZE7T | Human | Esophagus | ESCC | 2.37e-06 | 5.71e-01 | 0.0667 |
| 25801 | GCA | LZE8T | Human | Esophagus | ESCC | 6.52e-05 | 2.48e-01 | 0.067 |
| 25801 | GCA | LZE20T | Human | Esophagus | ESCC | 3.46e-03 | 8.19e-02 | 0.0662 |
| 25801 | GCA | LZE22T | Human | Esophagus | ESCC | 7.63e-06 | 3.92e-01 | 0.068 |
| 25801 | GCA | LZE24T | Human | Esophagus | ESCC | 4.34e-27 | 7.30e-01 | 0.0596 |
| 25801 | GCA | P1T-E | Human | Esophagus | ESCC | 7.24e-11 | 5.51e-01 | 0.0875 |
| 25801 | GCA | P2T-E | Human | Esophagus | ESCC | 9.69e-21 | 3.81e-01 | 0.1177 |
| 25801 | GCA | P4T-E | Human | Esophagus | ESCC | 6.18e-28 | 6.24e-01 | 0.1323 |
| 25801 | GCA | P5T-E | Human | Esophagus | ESCC | 8.72e-10 | 2.00e-01 | 0.1327 |
| 25801 | GCA | P8T-E | Human | Esophagus | ESCC | 2.23e-20 | 4.44e-01 | 0.0889 |
| 25801 | GCA | P9T-E | Human | Esophagus | ESCC | 1.20e-04 | 1.14e-01 | 0.1131 |
| 25801 | GCA | P10T-E | Human | Esophagus | ESCC | 1.58e-03 | 7.12e-02 | 0.116 |
| 25801 | GCA | P11T-E | Human | Esophagus | ESCC | 2.87e-07 | 3.14e-01 | 0.1426 |
| 25801 | GCA | P12T-E | Human | Esophagus | ESCC | 7.64e-20 | 4.06e-01 | 0.1122 |
| 25801 | GCA | P15T-E | Human | Esophagus | ESCC | 1.17e-11 | 2.56e-01 | 0.1149 |
| 25801 | GCA | P16T-E | Human | Esophagus | ESCC | 4.96e-25 | 4.05e-01 | 0.1153 |
| 25801 | GCA | P17T-E | Human | Esophagus | ESCC | 2.87e-04 | 2.51e-01 | 0.1278 |
| 25801 | GCA | P19T-E | Human | Esophagus | ESCC | 4.00e-04 | 4.97e-01 | 0.1662 |
| 25801 | GCA | P20T-E | Human | Esophagus | ESCC | 1.93e-11 | 2.36e-01 | 0.1124 |
| 25801 | GCA | P21T-E | Human | Esophagus | ESCC | 9.58e-06 | 9.99e-02 | 0.1617 |
| Page: 1 2 3 4 |
| Tissue | Expression Dynamics | Abbreviation |
| Esophagus | 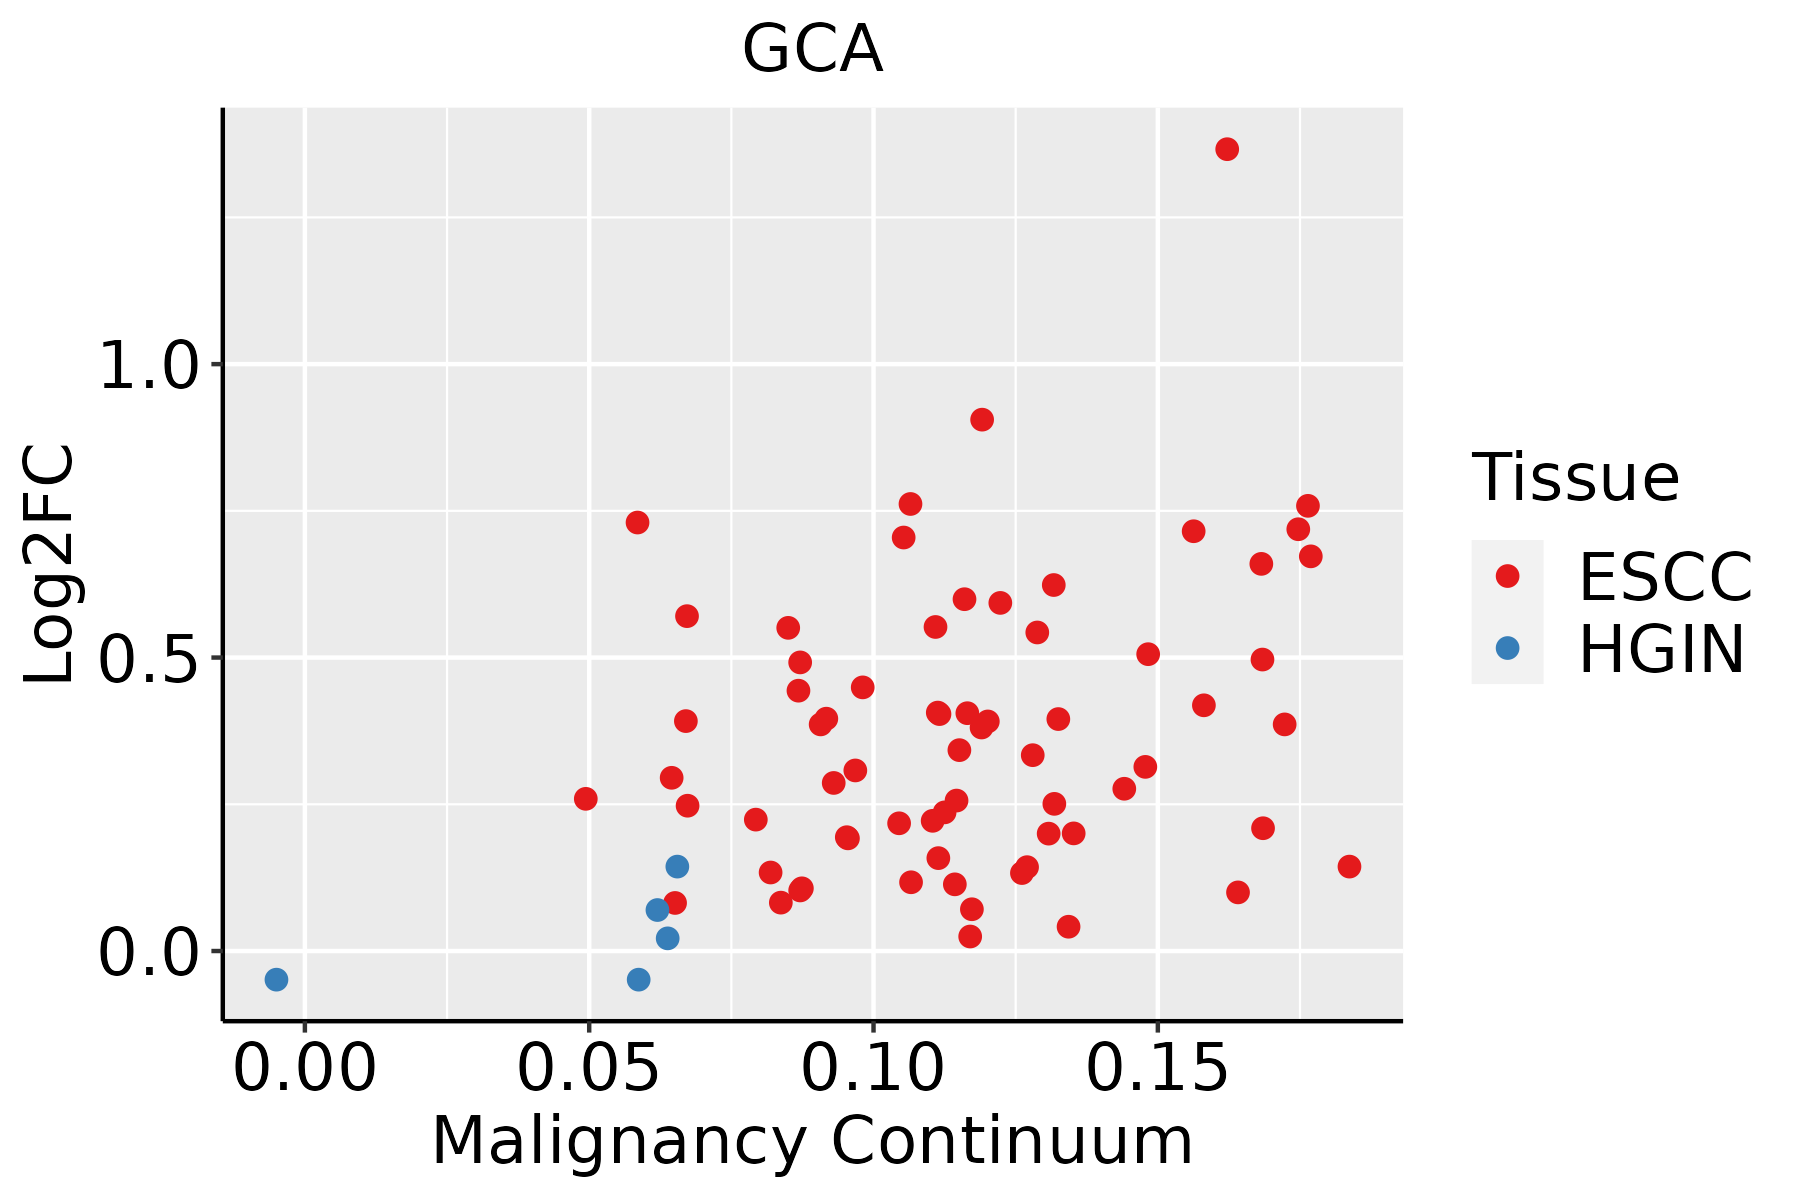 | ESCC: Esophageal squamous cell carcinoma |
| HGIN: High-grade intraepithelial neoplasias | ||
| LGIN: Low-grade intraepithelial neoplasias | ||
| Oral Cavity | 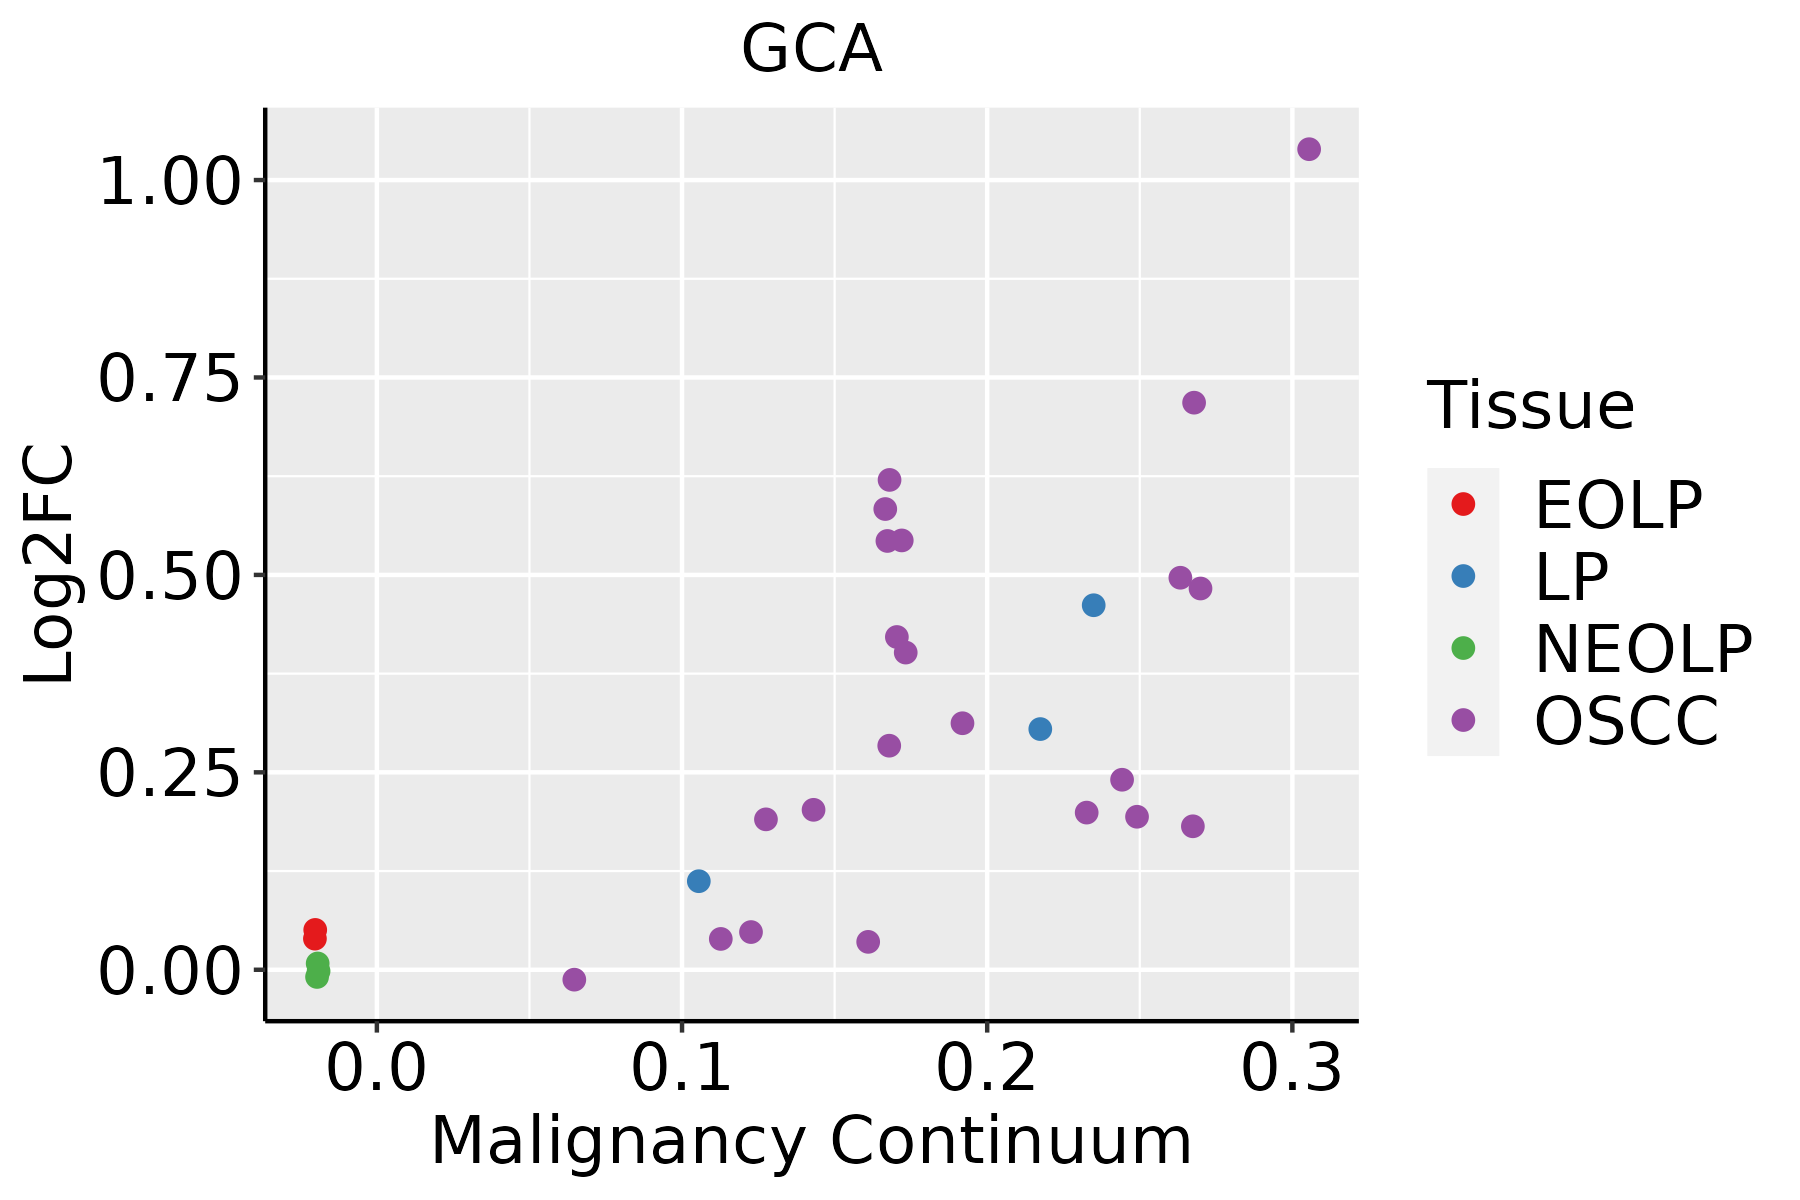 | EOLP: Erosive Oral lichen planus |
| LP: leukoplakia | ||
| NEOLP: Non-erosive oral lichen planus | ||
| OSCC: Oral squamous cell carcinoma |
| ∗log2FC in expression of this searched gene in stem-like cells from each diseased tissue sample relative to stem-like cells in normal samples in each tissue plotted against the malignancy continuum. Samples are colored based on if they are from different disease stage. |
Top |
Malignant transformation related pathway analysis |
| Find out the enriched GO biological processes and KEGG pathways involved in transition from healthy to precancer to cancer |
| Tissue | Disease Stage | Enriched GO biological Processes |
| Colorectum | AD |  |
| Colorectum | SER |  |
| Colorectum | MSS |  |
| Colorectum | MSI-H |  |
| Colorectum | FAP |  |
| ∗Top 15 enriched GO BP terms are showed in the bar plot of each disease state in each tissue. Each row represents a significant GO biological process which is colored according to the -log10(p.adjust). |
| Page: 1 2 3 4 5 6 7 8 9 |
| GO ID | Tissue | Disease Stage | Description | Gene Ratio | Bg Ratio | pvalue | p.adjust | Count |
| GO:00610254 | Esophagus | ESCC | membrane fusion | 98/8552 | 163/18723 | 1.39e-04 | 9.41e-04 | 98 |
| GO:00442827 | Esophagus | ESCC | small molecule catabolic process | 201/8552 | 376/18723 | 1.35e-03 | 6.41e-03 | 201 |
| GO:004428221 | Liver | HCC | small molecule catabolic process | 225/7958 | 376/18723 | 6.50e-12 | 2.80e-10 | 225 |
| GO:001605421 | Liver | HCC | organic acid catabolic process | 152/7958 | 240/18723 | 5.11e-11 | 1.92e-09 | 152 |
| GO:00463952 | Liver | HCC | carboxylic acid catabolic process | 149/7958 | 236/18723 | 1.11e-10 | 3.87e-09 | 149 |
| GO:19016052 | Liver | HCC | alpha-amino acid metabolic process | 124/7958 | 195/18723 | 2.07e-09 | 5.79e-08 | 124 |
| GO:00065202 | Liver | HCC | cellular amino acid metabolic process | 167/7958 | 284/18723 | 1.91e-08 | 4.56e-07 | 167 |
| GO:00090632 | Liver | HCC | cellular amino acid catabolic process | 70/7958 | 110/18723 | 6.12e-06 | 7.52e-05 | 70 |
| GO:00090692 | Liver | HCC | serine family amino acid metabolic process | 29/7958 | 40/18723 | 1.17e-04 | 9.87e-04 | 29 |
| GO:00090662 | Liver | HCC | aspartate family amino acid metabolic process | 34/7958 | 49/18723 | 1.28e-04 | 1.06e-03 | 34 |
| GO:19016062 | Liver | HCC | alpha-amino acid catabolic process | 53/7958 | 87/18723 | 4.01e-04 | 2.71e-03 | 53 |
| GO:00310999 | Oral cavity | OSCC | regeneration | 114/7305 | 198/18723 | 8.54e-08 | 1.50e-06 | 114 |
| GO:00422464 | Oral cavity | OSCC | tissue regeneration | 42/7305 | 72/18723 | 6.89e-04 | 3.84e-03 | 42 |
| GO:00610253 | Oral cavity | OSCC | membrane fusion | 84/7305 | 163/18723 | 7.56e-04 | 4.12e-03 | 84 |
| GO:00434034 | Oral cavity | OSCC | skeletal muscle tissue regeneration | 23/7305 | 37/18723 | 3.66e-03 | 1.51e-02 | 23 |
| GO:003109916 | Oral cavity | LP | regeneration | 76/4623 | 198/18723 | 1.25e-05 | 2.24e-04 | 76 |
| GO:00422461 | Oral cavity | LP | tissue regeneration | 30/4623 | 72/18723 | 1.13e-03 | 9.27e-03 | 30 |
| GO:00610251 | Oral cavity | LP | membrane fusion | 58/4623 | 163/18723 | 1.19e-03 | 9.62e-03 | 58 |
| GO:004340311 | Oral cavity | LP | skeletal muscle tissue regeneration | 18/4623 | 37/18723 | 1.36e-03 | 1.08e-02 | 18 |
| Page: 1 |
| Pathway ID | Tissue | Disease Stage | Description | Gene Ratio | Bg Ratio | pvalue | p.adjust | qvalue | Count |
| Page: 1 |
Top |
Cell-cell communication analysis |
| Identification of potential cell-cell interactions between two cell types and their ligand-receptor pairs for different disease states |
| Ligand | Receptor | LRpair | Pathway | Tissue | Disease Stage |
| Page: 1 |
Top |
Single-cell gene regulatory network inference analysis |
| Find out the significant the regulons (TFs) and the target genes of each regulon across cell types for different disease states |
| TF | Cell Type | Tissue | Disease Stage | Target Gene | RSS | Regulon Activity |
| ∗The dot plots of a searched regulon are shown for all cell subpopulations in each disease state of each tissue based on the regulon specific score inferred using pySCENIC and by calculating the average expression. |
| Page: 1 |
Top |
Somatic mutation of malignant transformation related genes |
| Annotation of somatic variants for genes involved in malignant transformation |
| Hugo Symbol | Variant Class | Variant Classification | dbSNP RS | HGVSc | HGVSp | HGVSp Short | SWISSPROT | BIOTYPE | SIFT | PolyPhen | Tumor Sample Barcode | Tissue | Histology | Sex | Age | Stage | Therapy Types | Drugs | Outcome |
| GCA | SNV | Missense_Mutation | c.522N>G | p.Phe174Leu | p.F174L | P28676 | protein_coding | tolerated(0.79) | benign(0.251) | TCGA-C5-A8XH-01 | Cervix | cervical & endocervical cancer | Female | <65 | I/II | Unknown | Unknown | SD | |
| GCA | SNV | Missense_Mutation | novel | c.472N>G | p.Gln158Glu | p.Q158E | P28676 | protein_coding | deleterious(0.04) | benign(0.141) | TCGA-UC-A7PD-01 | Cervix | cervical & endocervical cancer | Female | <65 | I/II | Unknown | Unknown | PD |
| GCA | SNV | Missense_Mutation | novel | c.485C>A | p.Thr162Asn | p.T162N | P28676 | protein_coding | tolerated(0.12) | benign(0.072) | TCGA-A5-A1OF-01 | Endometrium | uterine corpus endometrioid carcinoma | Female | <65 | I/II | Unknown | Unknown | SD |
| GCA | SNV | Missense_Mutation | novel | c.646N>A | p.Ala216Thr | p.A216T | P28676 | protein_coding | tolerated(0.32) | benign(0.006) | TCGA-AX-A06F-01 | Endometrium | uterine corpus endometrioid carcinoma | Female | <65 | III/IV | Chemotherapy | carboplatin | SD |
| GCA | SNV | Missense_Mutation | rs766783966 | c.625N>A | p.Asp209Asn | p.D209N | P28676 | protein_coding | deleterious(0) | probably_damaging(0.956) | TCGA-BS-A0UF-01 | Endometrium | uterine corpus endometrioid carcinoma | Female | >=65 | I/II | Unknown | Unknown | SD |
| GCA | SNV | Missense_Mutation | rs377112025 | c.496N>T | p.Arg166Cys | p.R166C | P28676 | protein_coding | deleterious(0) | probably_damaging(1) | TCGA-D1-A17F-01 | Endometrium | uterine corpus endometrioid carcinoma | Female | >=65 | I/II | Unknown | Unknown | SD |
| GCA | SNV | Missense_Mutation | novel | c.308G>T | p.Arg103Ile | p.R103I | P28676 | protein_coding | deleterious(0.01) | possibly_damaging(0.617) | TCGA-E6-A1LX-01 | Endometrium | uterine corpus endometrioid carcinoma | Female | <65 | I/II | Unknown | Unknown | SD |
| GCA | SNV | Missense_Mutation | novel | c.310G>A | p.Asp104Asn | p.D104N | P28676 | protein_coding | deleterious(0.03) | possibly_damaging(0.887) | TCGA-E6-A1LX-01 | Endometrium | uterine corpus endometrioid carcinoma | Female | <65 | I/II | Unknown | Unknown | SD |
| GCA | SNV | Missense_Mutation | novel | c.253N>G | p.Thr85Ala | p.T85A | P28676 | protein_coding | tolerated(0.14) | benign(0.001) | TCGA-EC-A24G-01 | Endometrium | uterine corpus endometrioid carcinoma | Female | <65 | I/II | Chemotherapy | doxorubicin | SD |
| GCA | SNV | Missense_Mutation | rs563127943 | c.433C>T | p.Arg145Cys | p.R145C | P28676 | protein_coding | tolerated(0.07) | benign(0) | TCGA-QF-A5YS-01 | Endometrium | uterine corpus endometrioid carcinoma | Female | <65 | I/II | Chemotherapy | carboplatin | CR |
| Page: 1 2 3 |
Top |
Related drugs of malignant transformation related genes |
| Identification of chemicals and drugs interact with genes involved in malignant transfromation |
| (DGIdb 4.0) |
| Entrez ID | Symbol | Category | Interaction Types | Drug Claim Name | Drug Name | PMIDs |
| Page: 1 |

Copyright 2023-Present -The University of Texas Health Science Center at Houston |