
|
|||||
|
 | |
| |
| |
| |
| |
| |
|
Gene: GC |
Gene summary for GC |
| Gene information | Species | Human | Gene symbol | GC | Gene ID | 2638 |
| Gene name | GC vitamin D binding protein | |
| Gene Alias | DBP | |
| Cytomap | 4q13.3 | |
| Gene Type | protein-coding | GO ID | GO:0006629 | UniProtAcc | P02774 |
Top |
Malignant transformation analysis |
| Identification of the aberrant gene expression in precancerous and cancerous lesions by comparing the gene expression of stem-like cells in diseased tissues with normal stem cells |
| Entrez ID | Symbol | Replicates | Species | Organ | Tissue | Adj P-value | Log2FC | Malignancy |
| 2638 | GC | S41 | Human | Liver | Cirrhotic | 1.46e-05 | -9.54e-01 | -0.0343 |
| 2638 | GC | S42 | Human | Liver | HCC | 7.42e-03 | -4.85e-01 | -0.0103 |
| 2638 | GC | S43 | Human | Liver | Cirrhotic | 6.46e-26 | -4.03e-01 | -0.0187 |
| 2638 | GC | S44 | Human | Liver | HCC | 2.81e-02 | -6.59e-01 | -0.0083 |
| 2638 | GC | HCC1_Meng | Human | Liver | HCC | 4.12e-31 | -1.56e-01 | 0.0246 |
| 2638 | GC | HCC2_Meng | Human | Liver | HCC | 2.71e-67 | -1.43e+00 | 0.0107 |
| 2638 | GC | cirrhotic2 | Human | Liver | Cirrhotic | 7.17e-07 | 2.86e-01 | 0.0201 |
| 2638 | GC | cirrhotic3 | Human | Liver | Cirrhotic | 1.28e-16 | -6.78e-01 | 0.0215 |
| 2638 | GC | p6 | Human | Liver | Cyst | 1.86e-19 | -1.48e+00 | -0.0218 |
| 2638 | GC | HCC1 | Human | Liver | HCC | 8.30e-06 | 3.63e+00 | 0.5336 |
| 2638 | GC | HCC2 | Human | Liver | HCC | 2.81e-27 | 6.74e+00 | 0.5341 |
| 2638 | GC | HCC5 | Human | Liver | HCC | 7.54e-16 | 3.23e+00 | 0.4932 |
| 2638 | GC | Pt13.a | Human | Liver | HCC | 2.71e-17 | -3.89e-01 | 0.021 |
| 2638 | GC | Pt13.b | Human | Liver | HCC | 6.04e-34 | -4.40e-01 | 0.0251 |
| 2638 | GC | Pt13.c | Human | Liver | HCC | 6.46e-04 | -5.40e-01 | 0.0076 |
| 2638 | GC | Pt14.a | Human | Liver | HCC | 2.30e-04 | -5.47e-01 | 0.0169 |
| 2638 | GC | Pt14.b | Human | Liver | HCC | 2.36e-08 | -3.18e-01 | 0.018 |
| 2638 | GC | Pt14.c | Human | Liver | HCC | 7.42e-04 | -7.82e-01 | 0.0054 |
| 2638 | GC | Pt14.d | Human | Liver | HCC | 1.58e-08 | -4.24e-01 | 0.0143 |
| 2638 | GC | S014 | Human | Liver | HCC | 2.61e-43 | -5.95e-01 | 0.2254 |
| Page: 1 2 |
| Tissue | Expression Dynamics | Abbreviation |
| Liver | 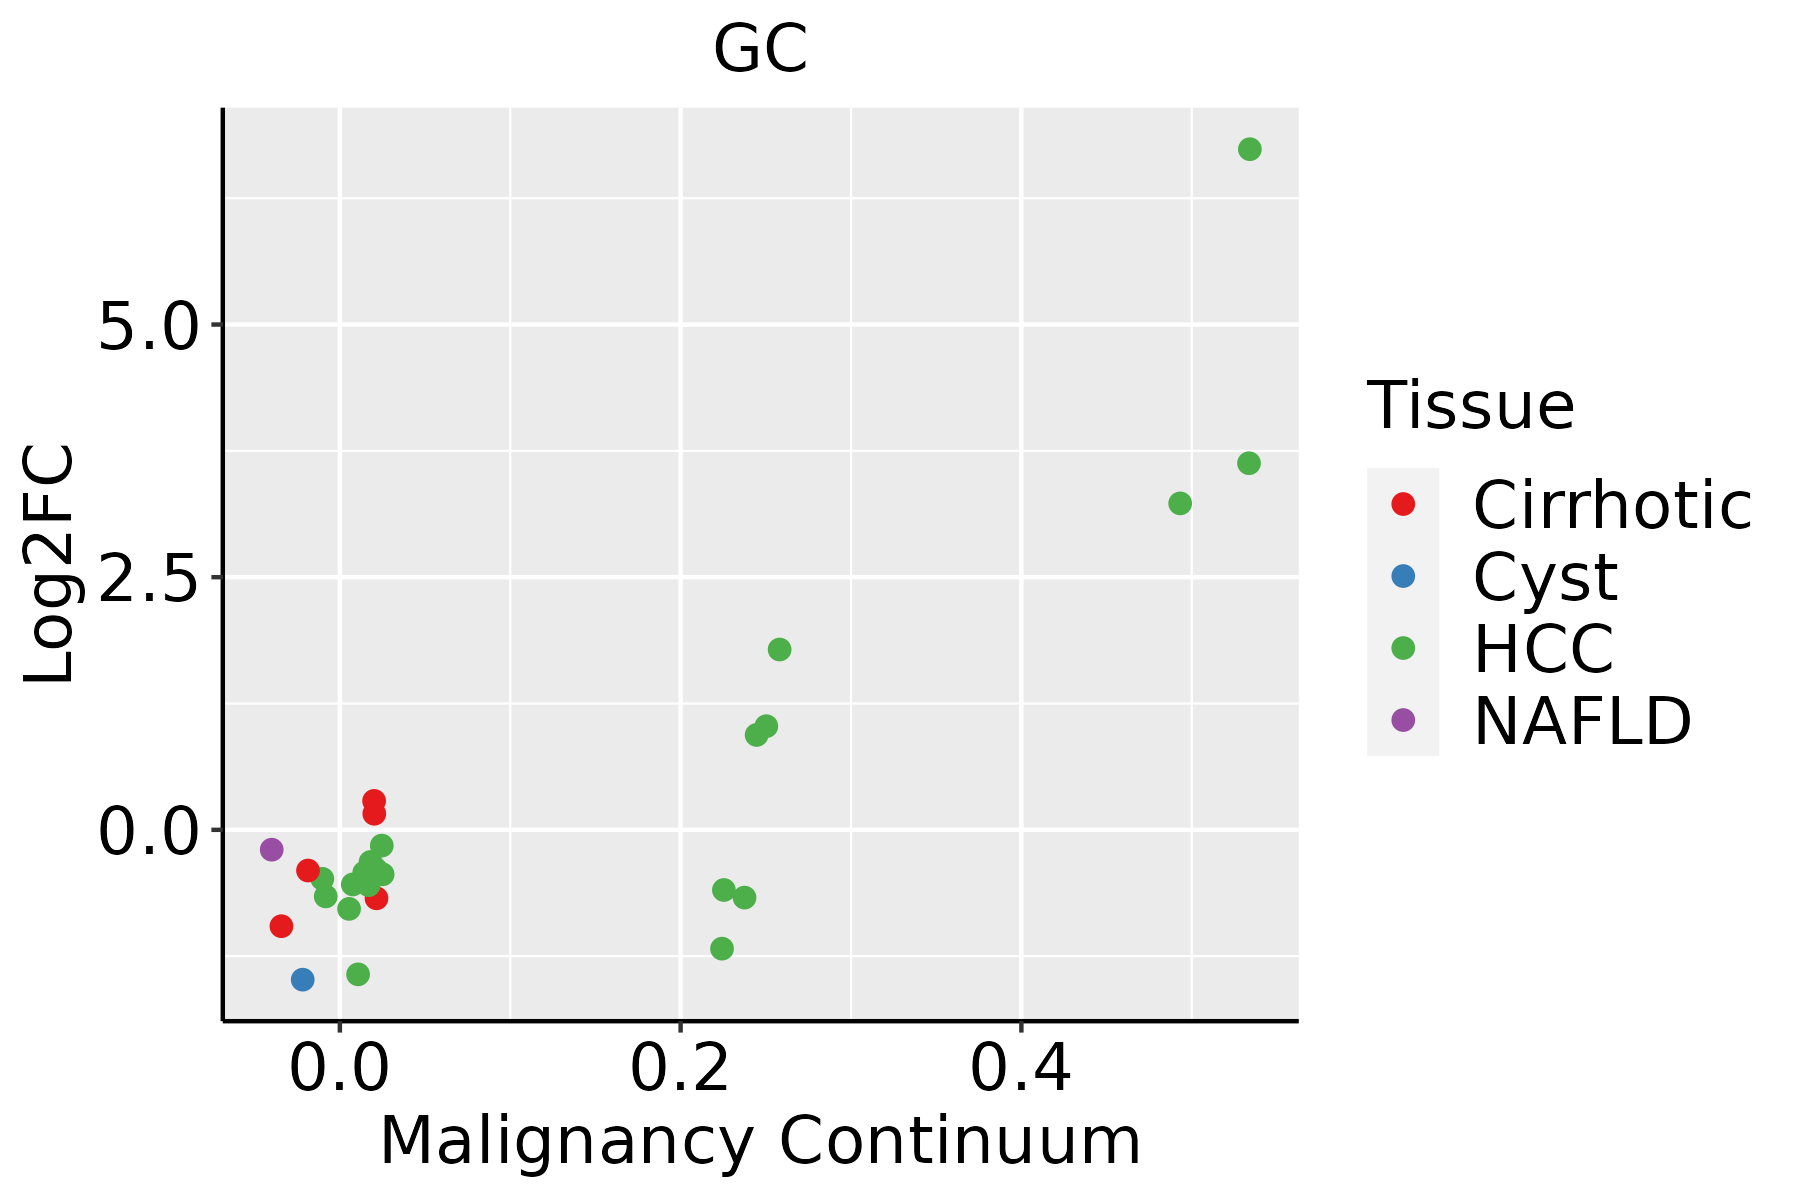 | HCC: Hepatocellular carcinoma |
| NAFLD: Non-alcoholic fatty liver disease |
| ∗log2FC in expression of this searched gene in stem-like cells from each diseased tissue sample relative to stem-like cells in normal samples in each tissue plotted against the malignancy continuum. Samples are colored based on if they are from different disease stage. |
Top |
Malignant transformation related pathway analysis |
| Find out the enriched GO biological processes and KEGG pathways involved in transition from healthy to precancer to cancer |
| Tissue | Disease Stage | Enriched GO biological Processes |
| Colorectum | AD |  |
| Colorectum | SER |  |
| Colorectum | MSS |  |
| Colorectum | MSI-H |  |
| Colorectum | FAP |  |
| ∗Top 15 enriched GO BP terms are showed in the bar plot of each disease state in each tissue. Each row represents a significant GO biological process which is colored according to the -log10(p.adjust). |
| Page: 1 2 3 4 5 6 7 8 9 |
| GO ID | Tissue | Disease Stage | Description | Gene Ratio | Bg Ratio | pvalue | p.adjust | Count |
| GO:20012339 | Breast | Precancer | regulation of apoptotic signaling pathway | 65/1080 | 356/18723 | 7.70e-17 | 3.17e-14 | 65 |
| GO:00069799 | Breast | Precancer | response to oxidative stress | 70/1080 | 446/18723 | 1.59e-14 | 4.26e-12 | 70 |
| GO:00362939 | Breast | Precancer | response to decreased oxygen levels | 53/1080 | 322/18723 | 4.09e-12 | 6.84e-10 | 53 |
| GO:00016669 | Breast | Precancer | response to hypoxia | 51/1080 | 307/18723 | 7.33e-12 | 1.11e-09 | 51 |
| GO:00704829 | Breast | Precancer | response to oxygen levels | 55/1080 | 347/18723 | 7.47e-12 | 1.11e-09 | 55 |
| GO:20012349 | Breast | Precancer | negative regulation of apoptotic signaling pathway | 39/1080 | 224/18723 | 5.35e-10 | 4.77e-08 | 39 |
| GO:00362948 | Breast | Precancer | cellular response to decreased oxygen levels | 31/1080 | 161/18723 | 2.61e-09 | 2.11e-07 | 31 |
| GO:00714538 | Breast | Precancer | cellular response to oxygen levels | 32/1080 | 177/18723 | 7.32e-09 | 5.52e-07 | 32 |
| GO:00709979 | Breast | Precancer | neuron death | 50/1080 | 361/18723 | 7.75e-09 | 5.70e-07 | 50 |
| GO:00714565 | Breast | Precancer | cellular response to hypoxia | 29/1080 | 151/18723 | 8.98e-09 | 6.50e-07 | 29 |
| GO:00514029 | Breast | Precancer | neuron apoptotic process | 38/1080 | 246/18723 | 2.68e-08 | 1.75e-06 | 38 |
| GO:00086378 | Breast | Precancer | apoptotic mitochondrial changes | 23/1080 | 107/18723 | 3.44e-08 | 2.12e-06 | 23 |
| GO:00518816 | Breast | Precancer | regulation of mitochondrial membrane potential | 18/1080 | 74/18723 | 1.45e-07 | 7.82e-06 | 18 |
| GO:19012149 | Breast | Precancer | regulation of neuron death | 41/1080 | 319/18723 | 1.27e-06 | 4.80e-05 | 41 |
| GO:00435237 | Breast | Precancer | regulation of neuron apoptotic process | 31/1080 | 212/18723 | 1.69e-06 | 6.08e-05 | 31 |
| GO:00018196 | Breast | Precancer | positive regulation of cytokine production | 52/1080 | 467/18723 | 4.18e-06 | 1.29e-04 | 52 |
| GO:00018367 | Breast | Precancer | release of cytochrome c from mitochondria | 14/1080 | 59/18723 | 4.80e-06 | 1.47e-04 | 14 |
| GO:20012369 | Breast | Precancer | regulation of extrinsic apoptotic signaling pathway | 24/1080 | 151/18723 | 5.78e-06 | 1.70e-04 | 24 |
| GO:00075688 | Breast | Precancer | aging | 41/1080 | 339/18723 | 5.95e-06 | 1.71e-04 | 41 |
| GO:00971919 | Breast | Precancer | extrinsic apoptotic signaling pathway | 30/1080 | 219/18723 | 9.42e-06 | 2.50e-04 | 30 |
| Pathway ID | Tissue | Disease Stage | Description | Gene Ratio | Bg Ratio | pvalue | p.adjust | qvalue | Count |
| Page: 1 |
Top |
Cell-cell communication analysis |
| Identification of potential cell-cell interactions between two cell types and their ligand-receptor pairs for different disease states |
| Ligand | Receptor | LRpair | Pathway | Tissue | Disease Stage |
| Page: 1 |
Top |
Single-cell gene regulatory network inference analysis |
| Find out the significant the regulons (TFs) and the target genes of each regulon across cell types for different disease states |
| TF | Cell Type | Tissue | Disease Stage | Target Gene | RSS | Regulon Activity |
| ∗The dot plots of a searched regulon are shown for all cell subpopulations in each disease state of each tissue based on the regulon specific score inferred using pySCENIC and by calculating the average expression. |
| Page: 1 |
Top |
Somatic mutation of malignant transformation related genes |
| Annotation of somatic variants for genes involved in malignant transformation |
| Hugo Symbol | Variant Class | Variant Classification | dbSNP RS | HGVSc | HGVSp | HGVSp Short | SWISSPROT | BIOTYPE | SIFT | PolyPhen | Tumor Sample Barcode | Tissue | Histology | Sex | Age | Stage | Therapy Types | Drugs | Outcome |
| GC | SNV | Missense_Mutation | c.1096A>G | p.Thr366Ala | p.T366A | P02774 | protein_coding | tolerated(0.35) | benign(0.093) | TCGA-A8-A09Z-01 | Breast | breast invasive carcinoma | Female | >=65 | I/II | Unknown | Unknown | SD | |
| GC | SNV | Missense_Mutation | novel | c.1236G>T | p.Lys412Asn | p.K412N | P02774 | protein_coding | tolerated(0.22) | benign(0.04) | TCGA-PE-A5DE-01 | Breast | breast invasive carcinoma | Female | <65 | I/II | Chemotherapy | taxotere | CR |
| GC | insertion | Frame_Shift_Ins | novel | c.41_42insTA | p.Arg14SerfsTer8 | p.R14Sfs*8 | P02774 | protein_coding | TCGA-A2-A0EQ-01 | Breast | breast invasive carcinoma | Female | <65 | I/II | Chemotherapy | adriamycin | SD | ||
| GC | insertion | Nonsense_Mutation | novel | c.40_41insACATTTATTAAGCAGTATTCCATGGAATGGGGAATCAATTA | p.Arg14AsnfsTer4 | p.R14Nfs*4 | P02774 | protein_coding | TCGA-A2-A0EQ-01 | Breast | breast invasive carcinoma | Female | <65 | I/II | Chemotherapy | adriamycin | SD | ||
| GC | SNV | Missense_Mutation | c.1112G>A | p.Arg371Lys | p.R371K | P02774 | protein_coding | deleterious(0.02) | benign(0.333) | TCGA-AA-3982-01 | Colorectum | colon adenocarcinoma | Male | >=65 | III/IV | Unknown | Unknown | SD | |
| GC | SNV | Missense_Mutation | c.858G>T | p.Glu286Asp | p.E286D | P02774 | protein_coding | tolerated(1) | benign(0.005) | TCGA-AA-3982-01 | Colorectum | colon adenocarcinoma | Male | >=65 | III/IV | Unknown | Unknown | SD | |
| GC | SNV | Missense_Mutation | c.860N>T | p.Ser287Phe | p.S287F | P02774 | protein_coding | deleterious(0) | probably_damaging(0.99) | TCGA-AA-3984-01 | Colorectum | colon adenocarcinoma | Female | <65 | I/II | Unknown | Unknown | SD | |
| GC | SNV | Missense_Mutation | c.818N>A | p.Leu273Gln | p.L273Q | P02774 | protein_coding | deleterious(0) | probably_damaging(0.998) | TCGA-AU-3779-01 | Colorectum | colon adenocarcinoma | Female | >=65 | I/II | Unknown | Unknown | SD | |
| GC | SNV | Missense_Mutation | c.356C>A | p.Ser119Tyr | p.S119Y | P02774 | protein_coding | deleterious(0) | probably_damaging(0.992) | TCGA-CA-6718-01 | Colorectum | colon adenocarcinoma | Male | <65 | I/II | Unknown | Unknown | PD | |
| GC | SNV | Missense_Mutation | rs746394990 | c.295G>C | p.Asp99His | p.D99H | P02774 | protein_coding | deleterious(0.02) | possibly_damaging(0.9) | TCGA-AG-A00Y-01 | Colorectum | rectum adenocarcinoma | Male | >=65 | I/II | Unknown | Unknown | PD |
| Page: 1 2 3 4 5 6 7 8 |
Top |
Related drugs of malignant transformation related genes |
| Identification of chemicals and drugs interact with genes involved in malignant transfromation |
| (DGIdb 4.0) |
| Entrez ID | Symbol | Category | Interaction Types | Drug Claim Name | Drug Name | PMIDs |
| 2638 | GC | DRUGGABLE GENOME | inhibitor | CHEMBL712 | ANISINDIONE | |
| 2638 | GC | DRUGGABLE GENOME | cetuximab | CETUXIMAB | 29208668 | |
| 2638 | GC | DRUGGABLE GENOME | Isosorbide Dinitrate | |||
| 2638 | GC | DRUGGABLE GENOME | VITAMIN D | 761406 | ||
| 2638 | GC | DRUGGABLE GENOME | CHEMBL2105671 | AFEGOSTAT TARTRATE | ||
| 2638 | GC | DRUGGABLE GENOME | bevacizumab | BEVACIZUMAB | 29208668 | |
| 2638 | GC | DRUGGABLE GENOME | Pirsidomine | PIRSIDOMINE | ||
| 2638 | GC | DRUGGABLE GENOME | Erythrityl Tetranitrate | |||
| 2638 | GC | DRUGGABLE GENOME | ASA | ASPIRIN | 17555340 | |
| 2638 | GC | DRUGGABLE GENOME | Nitric Oxide |
| Page: 1 2 |

Copyright 2023-Present -The University of Texas Health Science Center at Houston |