
|
|||||
|
 | |
| |
| |
| |
| |
| |
|
Gene: GBP6 |
Gene summary for GBP6 |
| Gene information | Species | Human | Gene symbol | GBP6 | Gene ID | 163351 |
| Gene name | guanylate binding protein family member 6 | |
| Gene Alias | GBP6 | |
| Cytomap | 1p22.2 | |
| Gene Type | protein-coding | GO ID | GO:0001562 | UniProtAcc | B4DRX0 |
Top |
Malignant transformation analysis |
| Identification of the aberrant gene expression in precancerous and cancerous lesions by comparing the gene expression of stem-like cells in diseased tissues with normal stem cells |
| Entrez ID | Symbol | Replicates | Species | Organ | Tissue | Adj P-value | Log2FC | Malignancy |
| 163351 | GBP6 | LZE2T | Human | Esophagus | ESCC | 2.29e-02 | 5.11e-01 | 0.082 |
| 163351 | GBP6 | LZE4T | Human | Esophagus | ESCC | 3.58e-14 | 6.93e-01 | 0.0811 |
| 163351 | GBP6 | LZE20T | Human | Esophagus | ESCC | 8.01e-03 | 3.29e-01 | 0.0662 |
| 163351 | GBP6 | LZE24T | Human | Esophagus | ESCC | 3.95e-13 | 5.83e-01 | 0.0596 |
| 163351 | GBP6 | P4T-E | Human | Esophagus | ESCC | 2.31e-30 | 1.09e+00 | 0.1323 |
| 163351 | GBP6 | P5T-E | Human | Esophagus | ESCC | 1.42e-07 | 6.57e-02 | 0.1327 |
| 163351 | GBP6 | P9T-E | Human | Esophagus | ESCC | 1.55e-09 | 3.95e-01 | 0.1131 |
| 163351 | GBP6 | P10T-E | Human | Esophagus | ESCC | 1.21e-09 | 2.70e-01 | 0.116 |
| 163351 | GBP6 | P11T-E | Human | Esophagus | ESCC | 9.26e-03 | 1.11e-01 | 0.1426 |
| 163351 | GBP6 | P12T-E | Human | Esophagus | ESCC | 1.14e-28 | 1.23e+00 | 0.1122 |
| 163351 | GBP6 | P15T-E | Human | Esophagus | ESCC | 4.60e-21 | 6.31e-01 | 0.1149 |
| 163351 | GBP6 | P20T-E | Human | Esophagus | ESCC | 1.03e-20 | 8.47e-01 | 0.1124 |
| 163351 | GBP6 | P21T-E | Human | Esophagus | ESCC | 7.44e-09 | 1.17e-01 | 0.1617 |
| 163351 | GBP6 | P22T-E | Human | Esophagus | ESCC | 2.16e-12 | 3.66e-01 | 0.1236 |
| 163351 | GBP6 | P23T-E | Human | Esophagus | ESCC | 8.53e-04 | 2.92e-01 | 0.108 |
| 163351 | GBP6 | P26T-E | Human | Esophagus | ESCC | 2.19e-06 | 3.04e-01 | 0.1276 |
| 163351 | GBP6 | P27T-E | Human | Esophagus | ESCC | 8.76e-31 | 8.86e-01 | 0.1055 |
| 163351 | GBP6 | P28T-E | Human | Esophagus | ESCC | 8.10e-25 | 6.76e-01 | 0.1149 |
| 163351 | GBP6 | P30T-E | Human | Esophagus | ESCC | 1.54e-18 | 1.12e+00 | 0.137 |
| 163351 | GBP6 | P31T-E | Human | Esophagus | ESCC | 2.07e-10 | 4.12e-01 | 0.1251 |
| Page: 1 2 3 |
| Tissue | Expression Dynamics | Abbreviation |
| Esophagus | 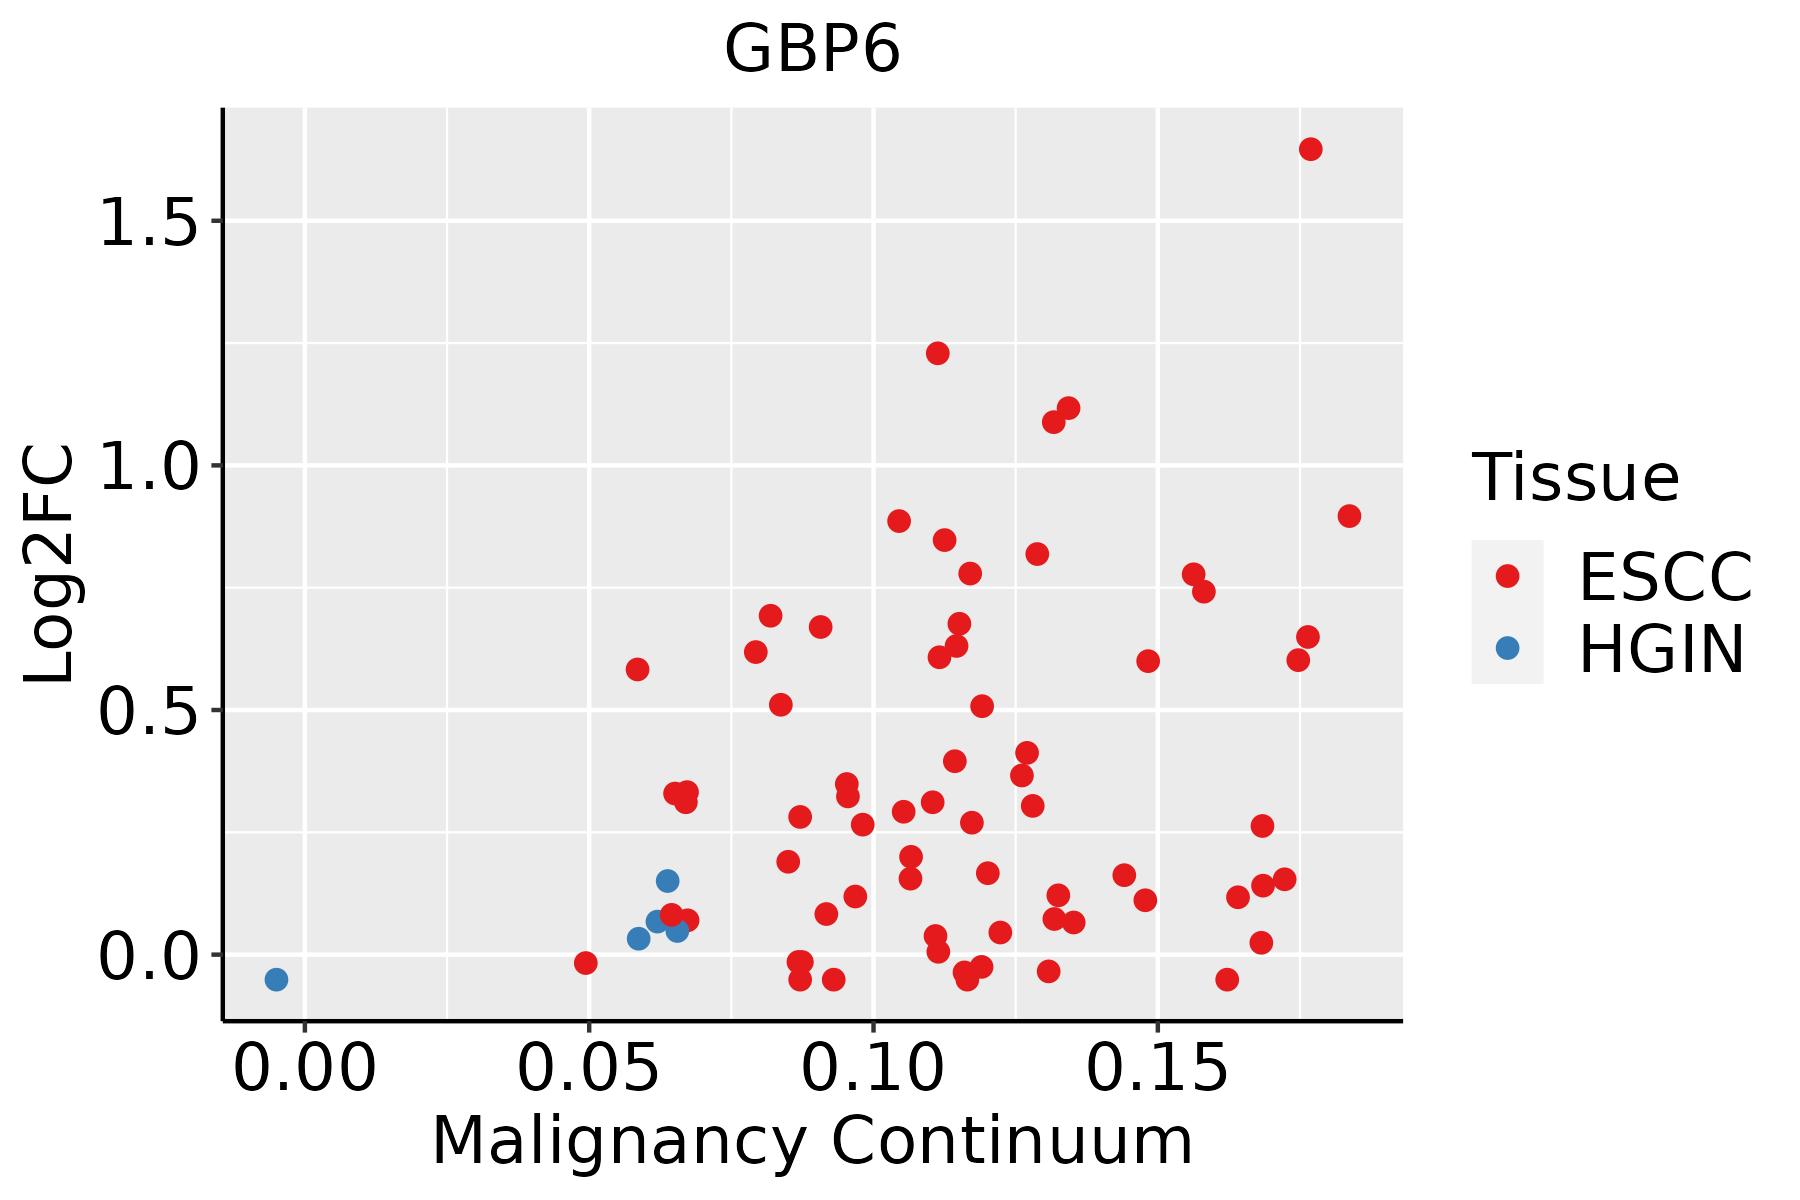 | ESCC: Esophageal squamous cell carcinoma |
| HGIN: High-grade intraepithelial neoplasias | ||
| LGIN: Low-grade intraepithelial neoplasias | ||
| Liver | 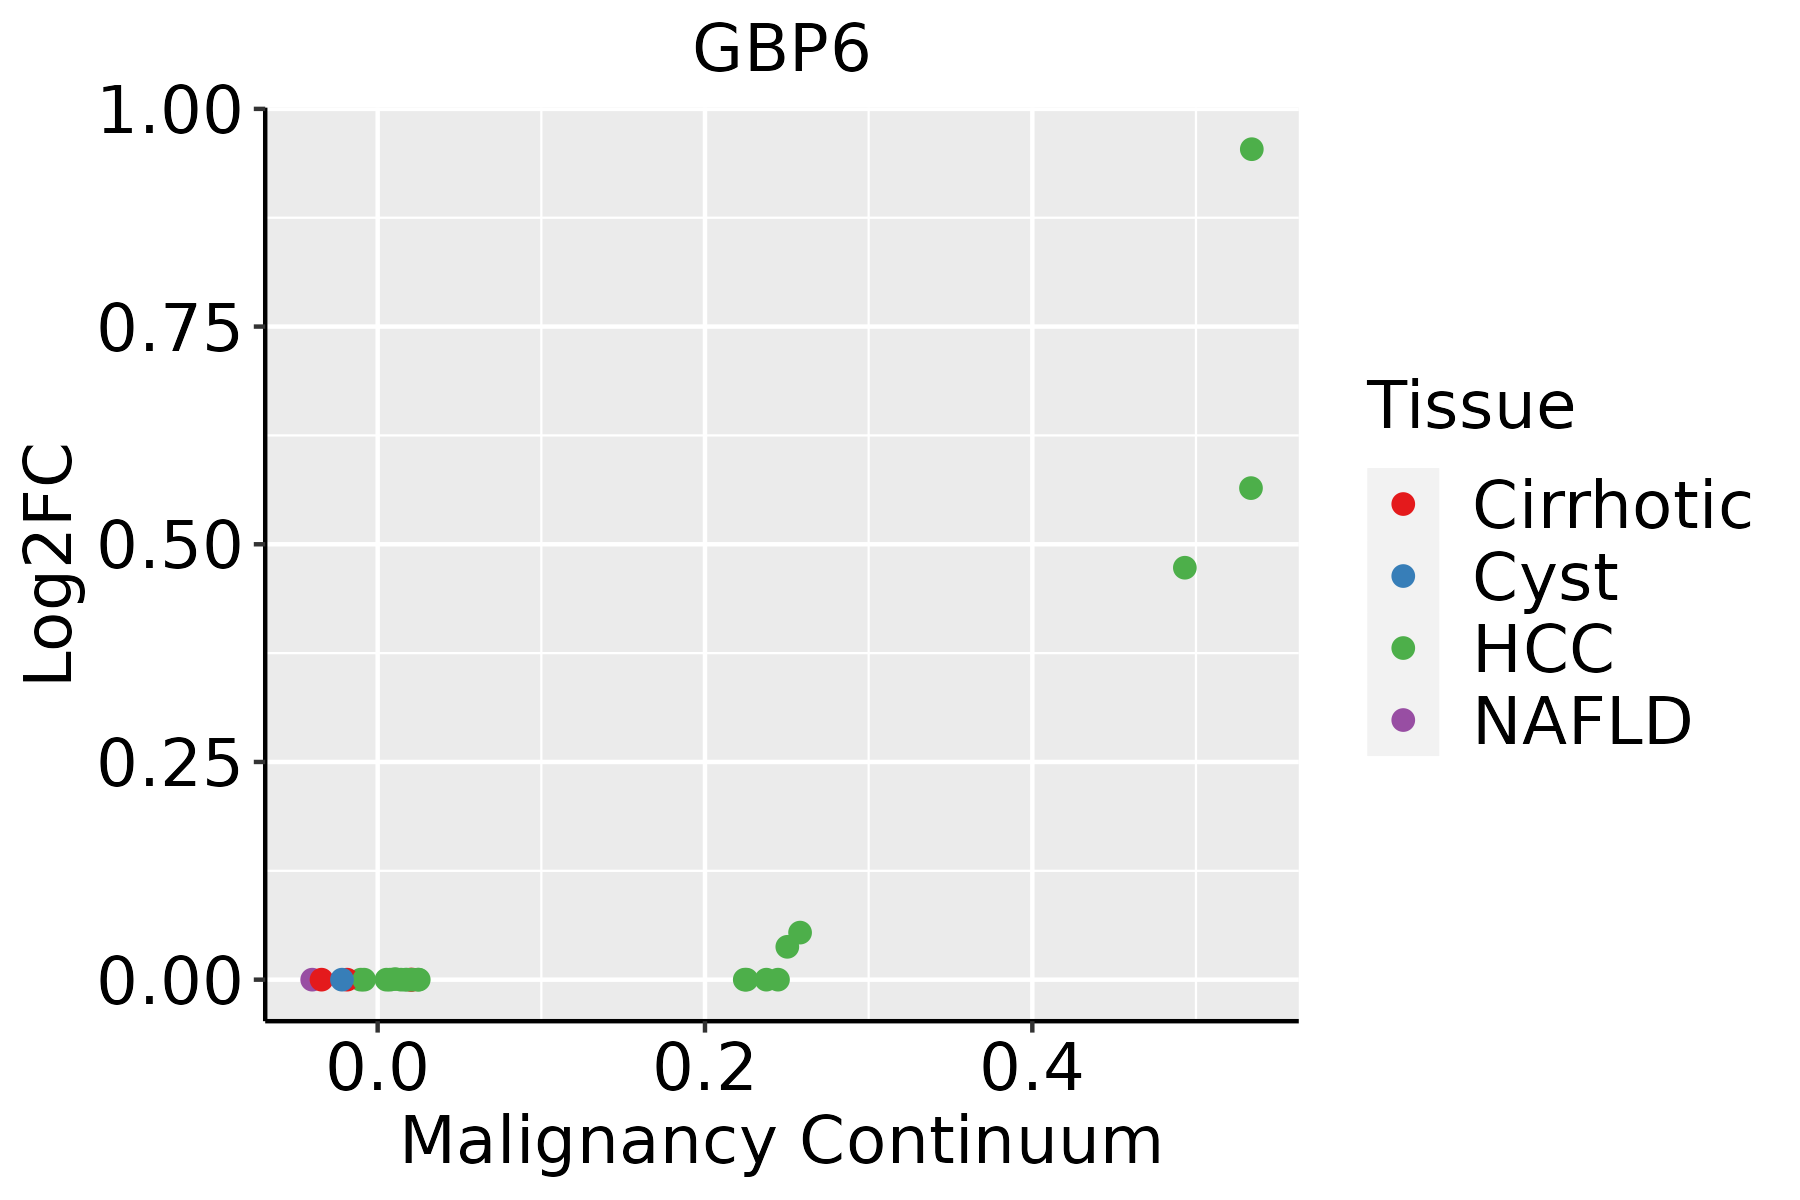 | HCC: Hepatocellular carcinoma |
| NAFLD: Non-alcoholic fatty liver disease | ||
| Oral Cavity |  | EOLP: Erosive Oral lichen planus |
| LP: leukoplakia | ||
| NEOLP: Non-erosive oral lichen planus | ||
| OSCC: Oral squamous cell carcinoma | ||
| Skin | 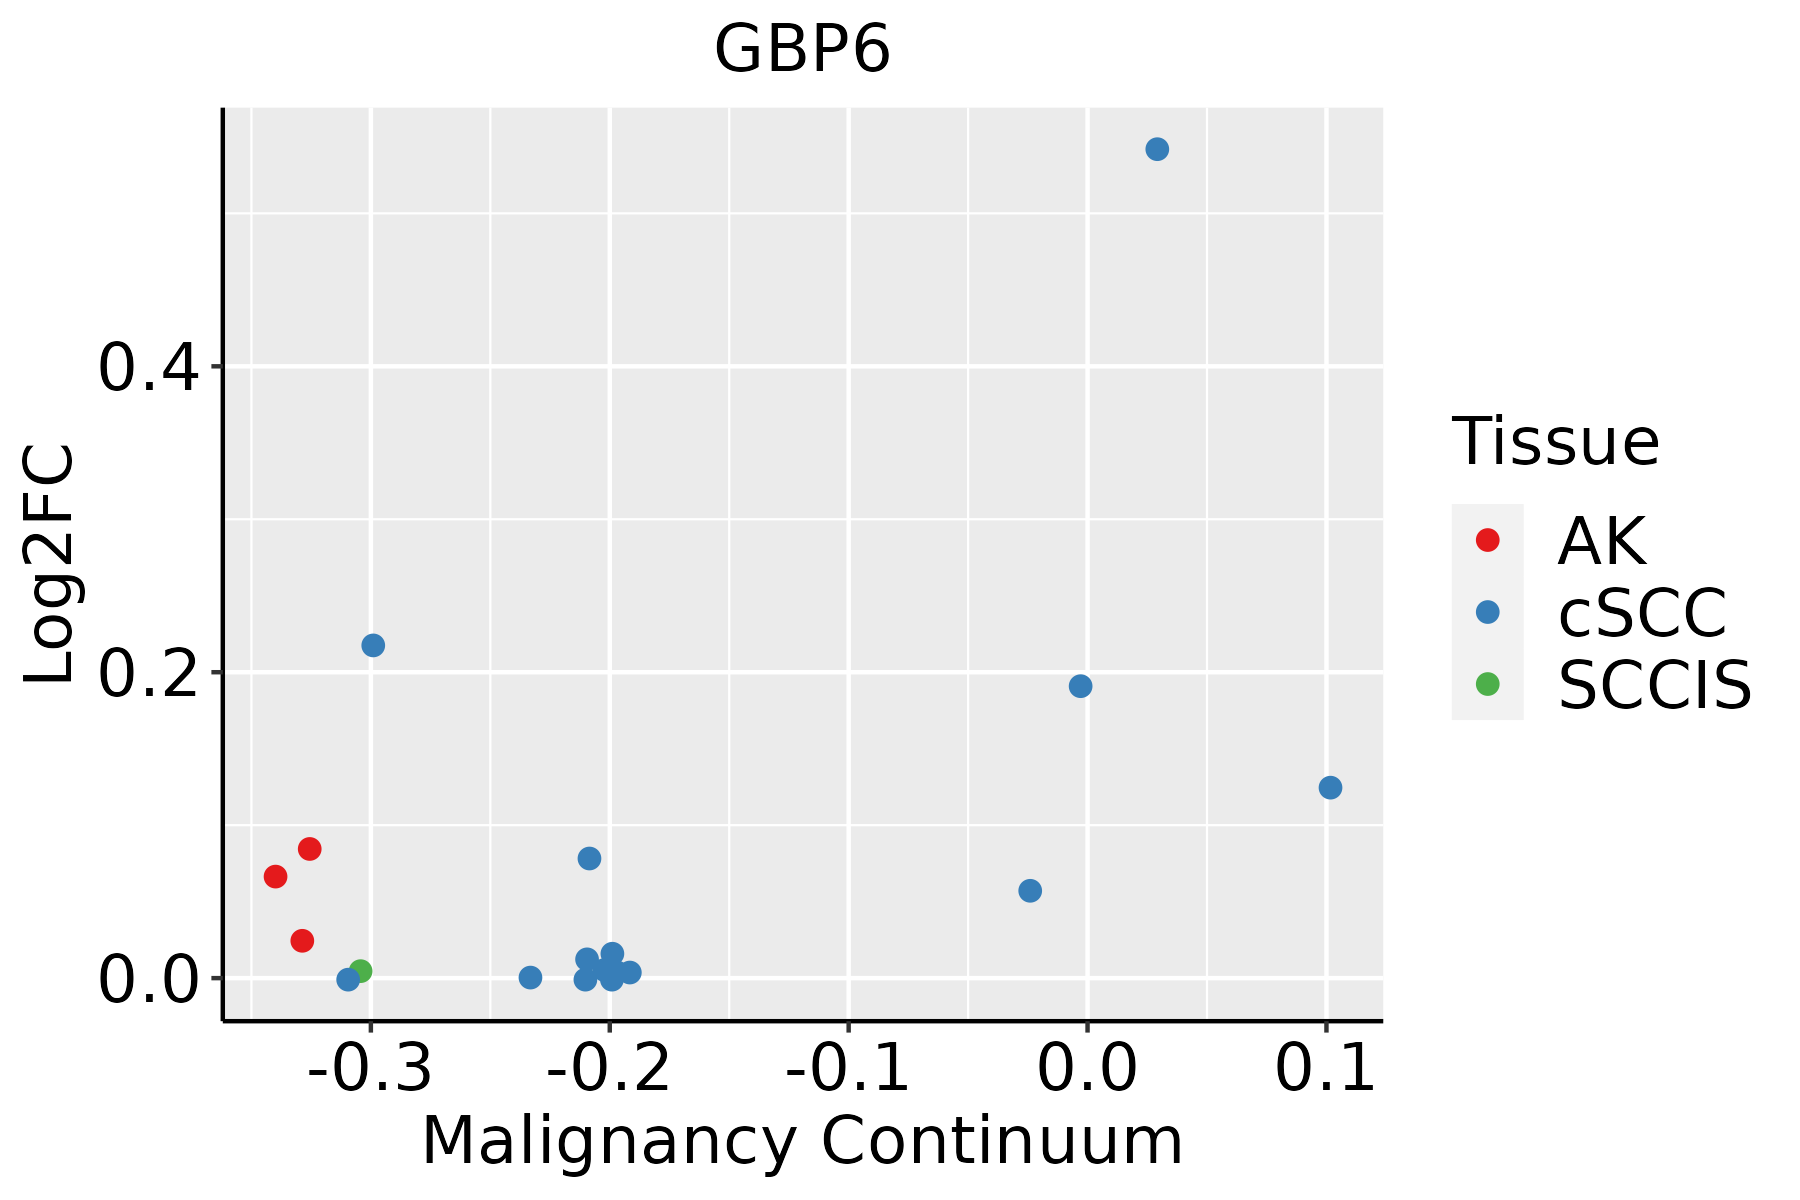 | AK: Actinic keratosis |
| cSCC: Cutaneous squamous cell carcinoma | ||
| SCCIS:squamous cell carcinoma in situ |
| ∗log2FC in expression of this searched gene in stem-like cells from each diseased tissue sample relative to stem-like cells in normal samples in each tissue plotted against the malignancy continuum. Samples are colored based on if they are from different disease stage. |
Top |
Malignant transformation related pathway analysis |
| Find out the enriched GO biological processes and KEGG pathways involved in transition from healthy to precancer to cancer |
| Tissue | Disease Stage | Enriched GO biological Processes |
| Colorectum | AD |  |
| Colorectum | SER |  |
| Colorectum | MSS |  |
| Colorectum | MSI-H |  |
| Colorectum | FAP |  |
| ∗Top 15 enriched GO BP terms are showed in the bar plot of each disease state in each tissue. Each row represents a significant GO biological process which is colored according to the -log10(p.adjust). |
| Page: 1 2 3 4 5 6 7 8 9 |
| GO ID | Tissue | Disease Stage | Description | Gene Ratio | Bg Ratio | pvalue | p.adjust | Count |
| GO:00343418 | Esophagus | ESCC | response to interferon-gamma | 86/8552 | 141/18723 | 1.74e-04 | 1.14e-03 | 86 |
| GO:00713466 | Esophagus | ESCC | cellular response to interferon-gamma | 69/8552 | 118/18723 | 3.44e-03 | 1.41e-02 | 69 |
| GO:00343411 | Liver | HCC | response to interferon-gamma | 82/7958 | 141/18723 | 1.25e-04 | 1.03e-03 | 82 |
| GO:00713461 | Liver | HCC | cellular response to interferon-gamma | 70/7958 | 118/18723 | 1.66e-04 | 1.32e-03 | 70 |
| GO:00343417 | Oral cavity | OSCC | response to interferon-gamma | 81/7305 | 141/18723 | 6.77e-06 | 7.43e-05 | 81 |
| GO:00713465 | Oral cavity | OSCC | cellular response to interferon-gamma | 65/7305 | 118/18723 | 2.83e-04 | 1.79e-03 | 65 |
| GO:003434115 | Skin | cSCC | response to interferon-gamma | 57/4864 | 141/18723 | 1.20e-04 | 1.11e-03 | 57 |
| GO:007134613 | Skin | cSCC | cellular response to interferon-gamma | 47/4864 | 118/18723 | 6.71e-04 | 4.79e-03 | 47 |
| Page: 1 |
| Pathway ID | Tissue | Disease Stage | Description | Gene Ratio | Bg Ratio | pvalue | p.adjust | qvalue | Count |
| Page: 1 |
Top |
Cell-cell communication analysis |
| Identification of potential cell-cell interactions between two cell types and their ligand-receptor pairs for different disease states |
| Ligand | Receptor | LRpair | Pathway | Tissue | Disease Stage |
| Page: 1 |
Top |
Single-cell gene regulatory network inference analysis |
| Find out the significant the regulons (TFs) and the target genes of each regulon across cell types for different disease states |
| TF | Cell Type | Tissue | Disease Stage | Target Gene | RSS | Regulon Activity |
| ∗The dot plots of a searched regulon are shown for all cell subpopulations in each disease state of each tissue based on the regulon specific score inferred using pySCENIC and by calculating the average expression. |
| Page: 1 |
Top |
Somatic mutation of malignant transformation related genes |
| Annotation of somatic variants for genes involved in malignant transformation |
| Hugo Symbol | Variant Class | Variant Classification | dbSNP RS | HGVSc | HGVSp | HGVSp Short | SWISSPROT | BIOTYPE | SIFT | PolyPhen | Tumor Sample Barcode | Tissue | Histology | Sex | Age | Stage | Therapy Types | Drugs | Outcome |
| GBP6 | SNV | Missense_Mutation | c.576N>A | p.His192Gln | p.H192Q | Q6ZN66 | protein_coding | tolerated(1) | benign(0.003) | TCGA-A2-A0T7-01 | Breast | breast invasive carcinoma | Female | <65 | I/II | Chemotherapy | adriamycin | SD | |
| GBP6 | SNV | Missense_Mutation | novel | c.737N>C | p.Leu246Pro | p.L246P | Q6ZN66 | protein_coding | deleterious(0) | probably_damaging(0.998) | TCGA-AC-A8OR-01 | Breast | breast invasive carcinoma | Female | >=65 | I/II | Unknown | Unknown | SD |
| GBP6 | SNV | Missense_Mutation | c.1768A>G | p.Thr590Ala | p.T590A | Q6ZN66 | protein_coding | tolerated(0.47) | benign(0) | TCGA-AN-A0FV-01 | Breast | breast invasive carcinoma | Female | <65 | I/II | Unknown | Unknown | SD | |
| GBP6 | SNV | Missense_Mutation | c.342N>T | p.Trp114Cys | p.W114C | Q6ZN66 | protein_coding | deleterious(0.01) | possibly_damaging(0.783) | TCGA-BH-A0H6-01 | Breast | breast invasive carcinoma | Female | >=65 | I/II | Unknown | Unknown | SD | |
| GBP6 | SNV | Missense_Mutation | novel | c.1143N>C | p.Lys381Asn | p.K381N | Q6ZN66 | protein_coding | deleterious(0.03) | benign(0.146) | TCGA-EW-A3E8-01 | Breast | breast invasive carcinoma | Female | <65 | I/II | Hormone Therapy | anastrozole | SD |
| GBP6 | SNV | Missense_Mutation | novel | c.966G>T | p.Glu322Asp | p.E322D | Q6ZN66 | protein_coding | deleterious(0) | probably_damaging(0.993) | TCGA-2W-A8YY-01 | Cervix | cervical & endocervical cancer | Female | <65 | I/II | Chemotherapy | cisplatin | CR |
| GBP6 | SNV | Missense_Mutation | novel | c.1650G>T | p.Glu550Asp | p.E550D | Q6ZN66 | protein_coding | tolerated(0.23) | benign(0.168) | TCGA-2W-A8YY-01 | Cervix | cervical & endocervical cancer | Female | <65 | I/II | Chemotherapy | cisplatin | CR |
| GBP6 | SNV | Missense_Mutation | c.567N>C | p.Leu189Phe | p.L189F | Q6ZN66 | protein_coding | tolerated(0.07) | benign(0.208) | TCGA-C5-A1MH-01 | Cervix | cervical & endocervical cancer | Female | >=65 | III/IV | Chemotherapy | cisplatin | PD | |
| GBP6 | SNV | Missense_Mutation | novel | c.730G>C | p.Asp244His | p.D244H | Q6ZN66 | protein_coding | deleterious(0.03) | benign(0.021) | TCGA-VS-A9U7-01 | Cervix | cervical & endocervical cancer | Female | <65 | I/II | Chemotherapy | cisplatin | CR |
| GBP6 | SNV | Missense_Mutation | c.322G>A | p.Asp108Asn | p.D108N | Q6ZN66 | protein_coding | tolerated(0.05) | benign(0.212) | TCGA-A6-2686-01 | Colorectum | colon adenocarcinoma | Female | >=65 | I/II | Unknown | Unknown | SD |
| Page: 1 2 3 4 5 6 7 8 9 |
Top |
Related drugs of malignant transformation related genes |
| Identification of chemicals and drugs interact with genes involved in malignant transfromation |
| (DGIdb 4.0) |
| Entrez ID | Symbol | Category | Interaction Types | Drug Claim Name | Drug Name | PMIDs |
| 163351 | GBP6 | NA | Tumor necrosis factor alpha (TNF-alpha) inhibitors |
| Page: 1 |

Copyright 2023-Present -The University of Texas Health Science Center at Houston |