
|
|||||
|
 | |
| |
| |
| |
| |
| |
|
Gene: GBP5 |
Gene summary for GBP5 |
| Gene information | Species | Human | Gene symbol | GBP5 | Gene ID | 115362 |
| Gene name | guanylate binding protein 5 | |
| Gene Alias | GBP-5 | |
| Cytomap | 1p22.2 | |
| Gene Type | protein-coding | GO ID | GO:0001816 | UniProtAcc | Q96PP8 |
Top |
Malignant transformation analysis |
| Identification of the aberrant gene expression in precancerous and cancerous lesions by comparing the gene expression of stem-like cells in diseased tissues with normal stem cells |
| Entrez ID | Symbol | Replicates | Species | Organ | Tissue | Adj P-value | Log2FC | Malignancy |
| 115362 | GBP5 | LZE4T | Human | Esophagus | ESCC | 1.09e-08 | 5.02e-01 | 0.0811 |
| 115362 | GBP5 | LZE7T | Human | Esophagus | ESCC | 3.63e-04 | 3.13e-01 | 0.0667 |
| 115362 | GBP5 | LZE6T | Human | Esophagus | ESCC | 1.49e-05 | 4.46e-01 | 0.0845 |
| 115362 | GBP5 | P5T-E | Human | Esophagus | ESCC | 4.24e-18 | 3.12e-01 | 0.1327 |
| 115362 | GBP5 | P8T-E | Human | Esophagus | ESCC | 4.44e-08 | 2.13e-01 | 0.0889 |
| 115362 | GBP5 | P11T-E | Human | Esophagus | ESCC | 5.31e-04 | 2.89e-01 | 0.1426 |
| 115362 | GBP5 | P12T-E | Human | Esophagus | ESCC | 1.75e-25 | 7.11e-01 | 0.1122 |
| 115362 | GBP5 | P23T-E | Human | Esophagus | ESCC | 2.41e-19 | 6.58e-01 | 0.108 |
| 115362 | GBP5 | P24T-E | Human | Esophagus | ESCC | 1.75e-25 | 8.20e-01 | 0.1287 |
| 115362 | GBP5 | P26T-E | Human | Esophagus | ESCC | 4.40e-09 | 3.24e-01 | 0.1276 |
| 115362 | GBP5 | P31T-E | Human | Esophagus | ESCC | 3.75e-03 | 1.24e-01 | 0.1251 |
| 115362 | GBP5 | P40T-E | Human | Esophagus | ESCC | 1.72e-06 | 3.40e-01 | 0.109 |
| 115362 | GBP5 | P52T-E | Human | Esophagus | ESCC | 4.41e-07 | 3.54e-01 | 0.1555 |
| 115362 | GBP5 | P61T-E | Human | Esophagus | ESCC | 1.32e-04 | 3.67e-01 | 0.099 |
| 115362 | GBP5 | P62T-E | Human | Esophagus | ESCC | 3.30e-25 | 8.62e-01 | 0.1302 |
| 115362 | GBP5 | P76T-E | Human | Esophagus | ESCC | 3.50e-02 | 2.69e-01 | 0.1207 |
| 115362 | GBP5 | P80T-E | Human | Esophagus | ESCC | 7.12e-38 | 1.28e+00 | 0.155 |
| 115362 | GBP5 | P83T-E | Human | Esophagus | ESCC | 1.31e-04 | 2.75e-01 | 0.1738 |
| 115362 | GBP5 | P89T-E | Human | Esophagus | ESCC | 1.24e-09 | 7.14e-01 | 0.1752 |
| 115362 | GBP5 | P91T-E | Human | Esophagus | ESCC | 8.27e-13 | 1.51e+00 | 0.1828 |
| Page: 1 2 |
| Tissue | Expression Dynamics | Abbreviation |
| Esophagus | 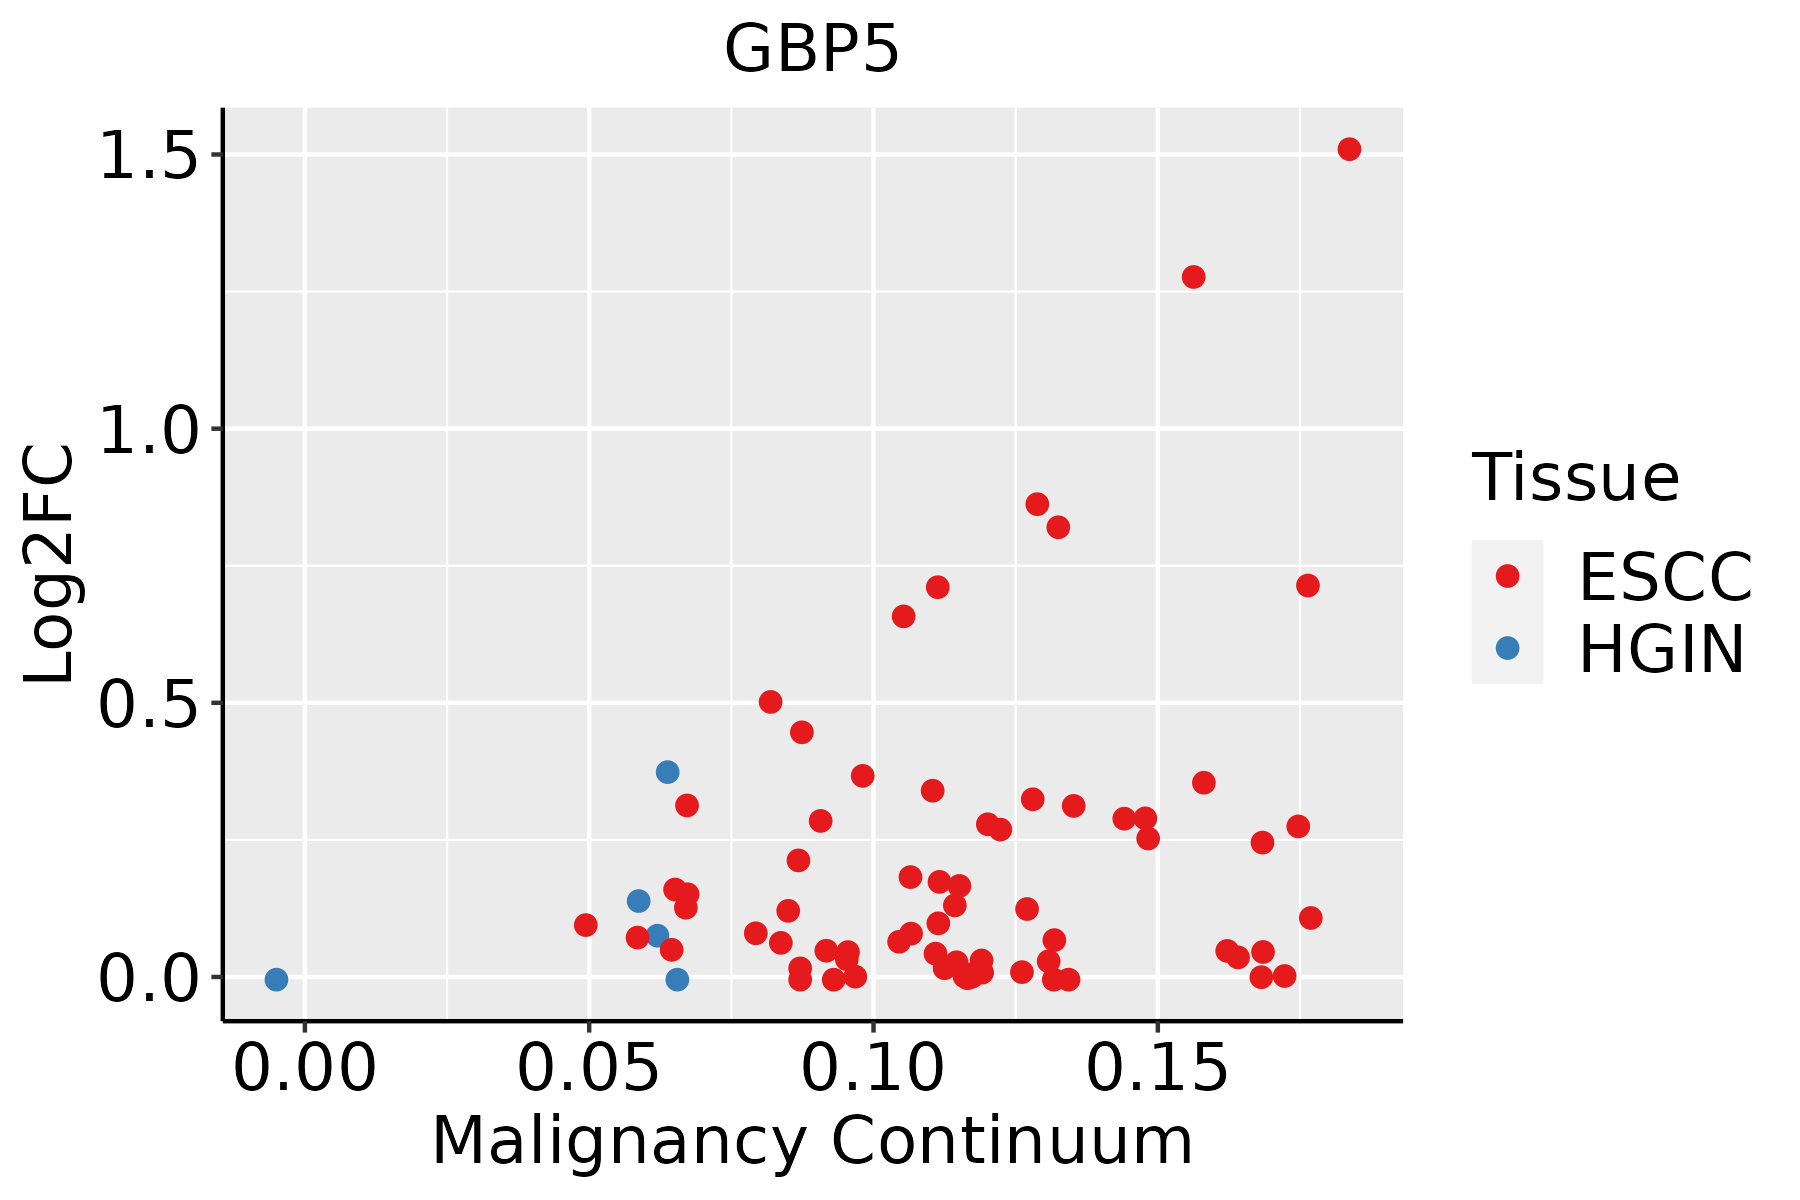 | ESCC: Esophageal squamous cell carcinoma |
| HGIN: High-grade intraepithelial neoplasias | ||
| LGIN: Low-grade intraepithelial neoplasias | ||
| Liver | 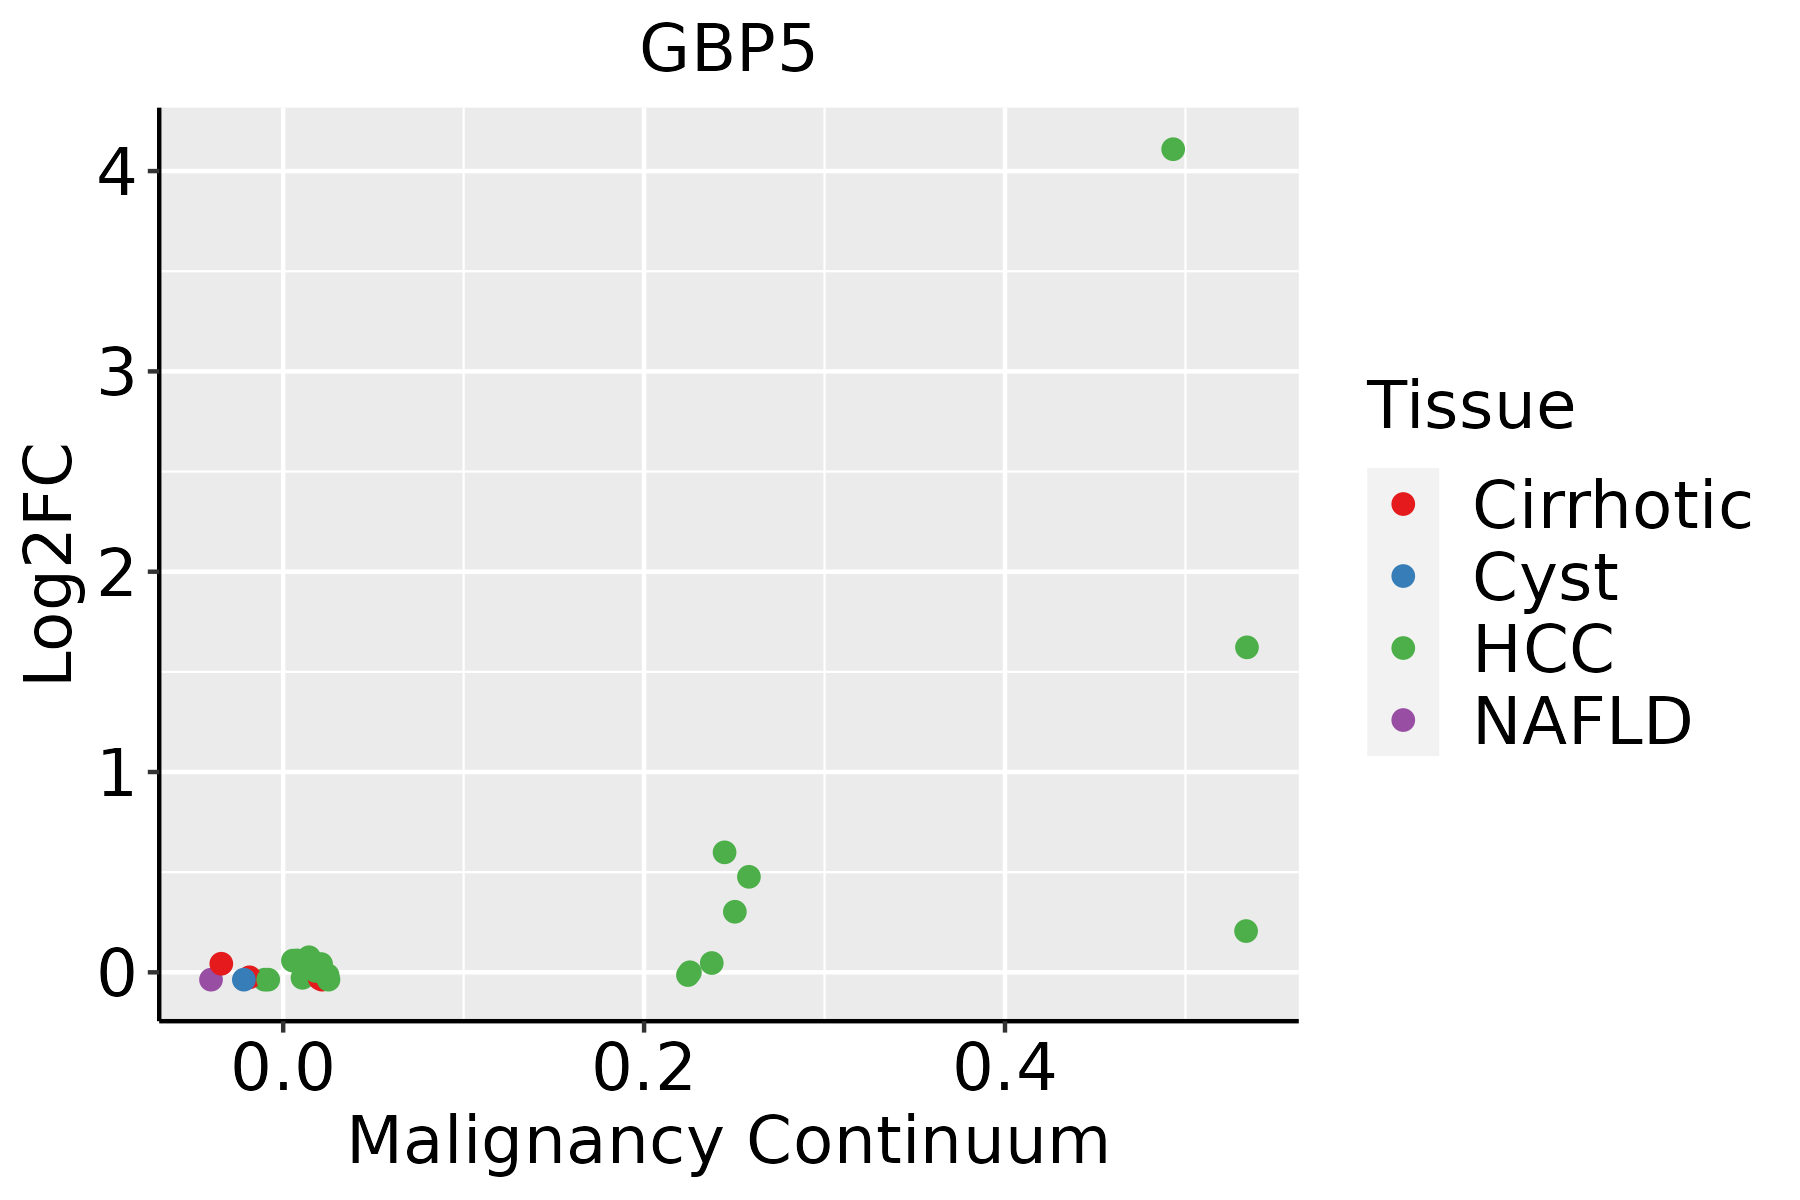 | HCC: Hepatocellular carcinoma |
| NAFLD: Non-alcoholic fatty liver disease | ||
| Oral Cavity | 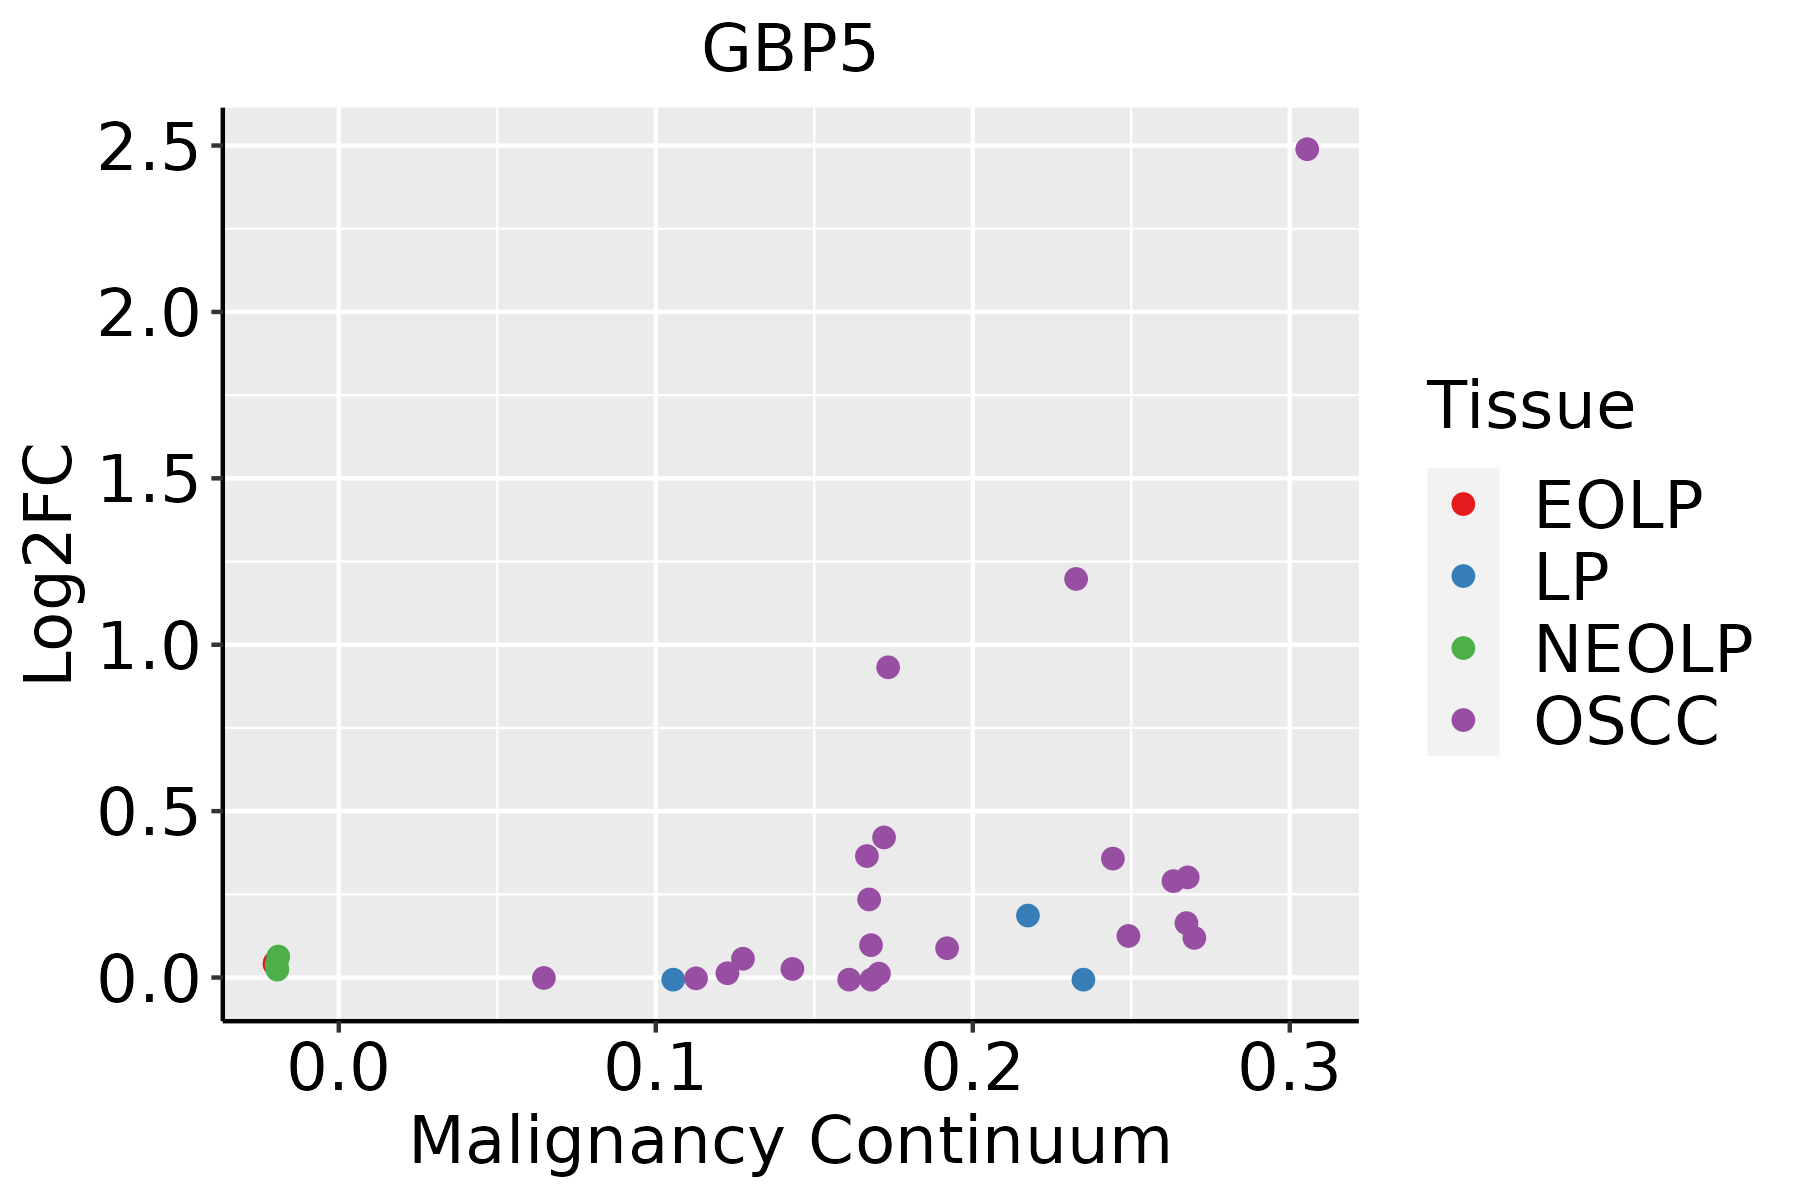 | EOLP: Erosive Oral lichen planus |
| LP: leukoplakia | ||
| NEOLP: Non-erosive oral lichen planus | ||
| OSCC: Oral squamous cell carcinoma | ||
| Thyroid |  | ATC: Anaplastic thyroid cancer |
| HT: Hashimoto's thyroiditis | ||
| PTC: Papillary thyroid cancer |
| ∗log2FC in expression of this searched gene in stem-like cells from each diseased tissue sample relative to stem-like cells in normal samples in each tissue plotted against the malignancy continuum. Samples are colored based on if they are from different disease stage. |
Top |
Malignant transformation related pathway analysis |
| Find out the enriched GO biological processes and KEGG pathways involved in transition from healthy to precancer to cancer |
| Tissue | Disease Stage | Enriched GO biological Processes |
| Colorectum | AD |  |
| Colorectum | SER |  |
| Colorectum | MSS |  |
| Colorectum | MSI-H |  |
| Colorectum | FAP |  |
| ∗Top 15 enriched GO BP terms are showed in the bar plot of each disease state in each tissue. Each row represents a significant GO biological process which is colored according to the -log10(p.adjust). |
| Page: 1 2 3 4 5 6 7 8 9 |
| GO ID | Tissue | Disease Stage | Description | Gene Ratio | Bg Ratio | pvalue | p.adjust | Count |
| GO:0043254111 | Esophagus | ESCC | regulation of protein-containing complex assembly | 278/8552 | 428/18723 | 3.81e-16 | 2.77e-14 | 278 |
| GO:0031334111 | Esophagus | ESCC | positive regulation of protein-containing complex assembly | 166/8552 | 237/18723 | 2.06e-14 | 1.07e-12 | 166 |
| GO:00028318 | Esophagus | ESCC | regulation of response to biotic stimulus | 191/8552 | 327/18723 | 2.12e-06 | 2.45e-05 | 191 |
| GO:00343418 | Esophagus | ESCC | response to interferon-gamma | 86/8552 | 141/18723 | 1.74e-04 | 1.14e-03 | 86 |
| GO:00340676 | Esophagus | ESCC | protein localization to Golgi apparatus | 23/8552 | 29/18723 | 2.25e-04 | 1.40e-03 | 23 |
| GO:00450885 | Esophagus | ESCC | regulation of innate immune response | 125/8552 | 218/18723 | 3.34e-04 | 1.96e-03 | 125 |
| GO:00512623 | Esophagus | ESCC | protein tetramerization | 54/8552 | 87/18723 | 1.50e-03 | 7.06e-03 | 54 |
| GO:000181916 | Esophagus | ESCC | positive regulation of cytokine production | 244/8552 | 467/18723 | 2.29e-03 | 1.01e-02 | 244 |
| GO:00512592 | Esophagus | ESCC | protein complex oligomerization | 130/8552 | 238/18723 | 3.29e-03 | 1.36e-02 | 130 |
| GO:00713466 | Esophagus | ESCC | cellular response to interferon-gamma | 69/8552 | 118/18723 | 3.44e-03 | 1.41e-02 | 69 |
| GO:004325422 | Liver | HCC | regulation of protein-containing complex assembly | 264/7958 | 428/18723 | 5.47e-16 | 4.39e-14 | 264 |
| GO:003133412 | Liver | HCC | positive regulation of protein-containing complex assembly | 150/7958 | 237/18723 | 7.35e-11 | 2.63e-09 | 150 |
| GO:003406721 | Liver | HCC | protein localization to Golgi apparatus | 23/7958 | 29/18723 | 5.86e-05 | 5.38e-04 | 23 |
| GO:00028312 | Liver | HCC | regulation of response to biotic stimulus | 173/7958 | 327/18723 | 8.55e-05 | 7.48e-04 | 173 |
| GO:00343411 | Liver | HCC | response to interferon-gamma | 82/7958 | 141/18723 | 1.25e-04 | 1.03e-03 | 82 |
| GO:00713461 | Liver | HCC | cellular response to interferon-gamma | 70/7958 | 118/18723 | 1.66e-04 | 1.32e-03 | 70 |
| GO:00450881 | Liver | HCC | regulation of innate immune response | 113/7958 | 218/18723 | 3.27e-03 | 1.50e-02 | 113 |
| GO:0051262 | Liver | HCC | protein tetramerization | 50/7958 | 87/18723 | 3.42e-03 | 1.55e-02 | 50 |
| GO:0051289 | Liver | HCC | protein homotetramerization | 33/7958 | 57/18723 | 1.37e-02 | 4.86e-02 | 33 |
| GO:004325420 | Oral cavity | OSCC | regulation of protein-containing complex assembly | 255/7305 | 428/18723 | 2.94e-18 | 3.15e-16 | 255 |
| Page: 1 2 |
| Pathway ID | Tissue | Disease Stage | Description | Gene Ratio | Bg Ratio | pvalue | p.adjust | qvalue | Count |
| hsa0462122 | Esophagus | ESCC | NOD-like receptor signaling pathway | 116/4205 | 186/8465 | 2.90e-04 | 1.03e-03 | 5.30e-04 | 116 |
| hsa0462132 | Esophagus | ESCC | NOD-like receptor signaling pathway | 116/4205 | 186/8465 | 2.90e-04 | 1.03e-03 | 5.30e-04 | 116 |
| hsa046218 | Oral cavity | OSCC | NOD-like receptor signaling pathway | 108/3704 | 186/8465 | 5.13e-05 | 2.07e-04 | 1.05e-04 | 108 |
| hsa0462113 | Oral cavity | OSCC | NOD-like receptor signaling pathway | 108/3704 | 186/8465 | 5.13e-05 | 2.07e-04 | 1.05e-04 | 108 |
| Page: 1 |
Top |
Cell-cell communication analysis |
| Identification of potential cell-cell interactions between two cell types and their ligand-receptor pairs for different disease states |
| Ligand | Receptor | LRpair | Pathway | Tissue | Disease Stage |
| Page: 1 |
Top |
Single-cell gene regulatory network inference analysis |
| Find out the significant the regulons (TFs) and the target genes of each regulon across cell types for different disease states |
| TF | Cell Type | Tissue | Disease Stage | Target Gene | RSS | Regulon Activity |
| ∗The dot plots of a searched regulon are shown for all cell subpopulations in each disease state of each tissue based on the regulon specific score inferred using pySCENIC and by calculating the average expression. |
| Page: 1 |
Top |
Somatic mutation of malignant transformation related genes |
| Annotation of somatic variants for genes involved in malignant transformation |
| Hugo Symbol | Variant Class | Variant Classification | dbSNP RS | HGVSc | HGVSp | HGVSp Short | SWISSPROT | BIOTYPE | SIFT | PolyPhen | Tumor Sample Barcode | Tissue | Histology | Sex | Age | Stage | Therapy Types | Drugs | Outcome |
| GBP5 | SNV | Missense_Mutation | c.458A>G | p.Lys153Arg | p.K153R | Q96PP8 | protein_coding | tolerated(1) | benign(0.02) | TCGA-A7-A13G-01 | Breast | breast invasive carcinoma | Female | >=65 | I/II | Hormone Therapy | arimidex | PD | |
| GBP5 | SNV | Missense_Mutation | c.164T>C | p.Met55Thr | p.M55T | Q96PP8 | protein_coding | deleterious(0) | possibly_damaging(0.875) | TCGA-AC-A4ZE-01 | Breast | breast invasive carcinoma | Female | <65 | I/II | Unknown | Unknown | SD | |
| GBP5 | SNV | Missense_Mutation | c.490G>C | p.Glu164Gln | p.E164Q | Q96PP8 | protein_coding | tolerated(0.1) | benign(0.131) | TCGA-AO-A12D-01 | Breast | breast invasive carcinoma | Female | <65 | I/II | Chemotherapy | cyclophosphamide | SD | |
| GBP5 | SNV | Missense_Mutation | rs763884452 | c.1349N>A | p.Arg450Gln | p.R450Q | Q96PP8 | protein_coding | deleterious(0.03) | benign(0.286) | TCGA-AQ-A0Y5-01 | Breast | breast invasive carcinoma | Female | >=65 | III/IV | Chemotherapy | cytoxan | SD |
| GBP5 | insertion | Frame_Shift_Ins | novel | c.107_108insTATTCTCCTTGTAAGGAGTAAGACATCAATGAAGT | p.Gln36HisfsTer15 | p.Q36Hfs*15 | Q96PP8 | protein_coding | TCGA-AQ-A04J-01 | Breast | breast invasive carcinoma | Female | <65 | I/II | Chemotherapy | cytoxan | SD | ||
| GBP5 | deletion | Frame_Shift_Del | c.790delN | p.Val264Ter | p.V264* | Q96PP8 | protein_coding | TCGA-AR-A251-01 | Breast | breast invasive carcinoma | Female | <65 | III/IV | Chemotherapy | doxorubicin | SD | |||
| GBP5 | deletion | Frame_Shift_Del | c.661delN | p.Arg221ValfsTer36 | p.R221Vfs*36 | Q96PP8 | protein_coding | TCGA-AR-A251-01 | Breast | breast invasive carcinoma | Female | <65 | III/IV | Chemotherapy | doxorubicin | SD | |||
| GBP5 | SNV | Missense_Mutation | novel | c.1559G>T | p.Arg520Ile | p.R520I | Q96PP8 | protein_coding | deleterious(0.02) | benign(0.038) | TCGA-2W-A8YY-01 | Cervix | cervical & endocervical cancer | Female | <65 | I/II | Chemotherapy | cisplatin | CR |
| GBP5 | SNV | Missense_Mutation | novel | c.1101N>T | p.Met367Ile | p.M367I | Q96PP8 | protein_coding | tolerated(0.18) | benign(0.012) | TCGA-JW-A5VJ-01 | Cervix | cervical & endocervical cancer | Female | <65 | I/II | Unknown | Unknown | PD |
| GBP5 | SNV | Missense_Mutation | c.1717G>A | p.Ala573Thr | p.A573T | Q96PP8 | protein_coding | deleterious(0.02) | benign(0.044) | TCGA-VS-A958-01 | Cervix | cervical & endocervical cancer | Female | <65 | I/II | Chemotherapy | cisplatin | CR |
| Page: 1 2 3 4 5 6 7 8 9 10 |
Top |
Related drugs of malignant transformation related genes |
| Identification of chemicals and drugs interact with genes involved in malignant transfromation |
| (DGIdb 4.0) |
| Entrez ID | Symbol | Category | Interaction Types | Drug Claim Name | Drug Name | PMIDs |
| Page: 1 |

Copyright 2023-Present -The University of Texas Health Science Center at Houston |