
|
|||||
|
 | |
| |
| |
| |
| |
| |
|
Gene: GBP4 |
Gene summary for GBP4 |
| Gene information | Species | Human | Gene symbol | GBP4 | Gene ID | 115361 |
| Gene name | guanylate binding protein 4 | |
| Gene Alias | Mpa2 | |
| Cytomap | 1p22.2 | |
| Gene Type | protein-coding | GO ID | GO:0001562 | UniProtAcc | Q96PP9 |
Top |
Malignant transformation analysis |
| Identification of the aberrant gene expression in precancerous and cancerous lesions by comparing the gene expression of stem-like cells in diseased tissues with normal stem cells |
| Entrez ID | Symbol | Replicates | Species | Organ | Tissue | Adj P-value | Log2FC | Malignancy |
| 115361 | GBP4 | CA_HPV_1 | Human | Cervix | CC | 1.32e-14 | 5.39e-01 | 0.0264 |
| 115361 | GBP4 | CCI_2 | Human | Cervix | CC | 6.37e-03 | 5.84e-01 | 0.5249 |
| 115361 | GBP4 | Tumor | Human | Cervix | CC | 9.52e-10 | 2.98e-01 | 0.1241 |
| 115361 | GBP4 | sample1 | Human | Cervix | CC | 4.01e-07 | 5.22e-01 | 0.0959 |
| 115361 | GBP4 | sample3 | Human | Cervix | CC | 3.88e-15 | 3.18e-01 | 0.1387 |
| 115361 | GBP4 | T1 | Human | Cervix | CC | 2.84e-09 | 4.28e-01 | 0.0918 |
| 115361 | GBP4 | T3 | Human | Cervix | CC | 1.02e-10 | 2.90e-01 | 0.1389 |
| 115361 | GBP4 | LZE4T | Human | Esophagus | ESCC | 2.37e-02 | 8.88e-02 | 0.0811 |
| 115361 | GBP4 | LZE8T | Human | Esophagus | ESCC | 2.72e-03 | 1.68e-01 | 0.067 |
| 115361 | GBP4 | LZE20T | Human | Esophagus | ESCC | 2.95e-06 | 2.29e-01 | 0.0662 |
| 115361 | GBP4 | LZE24T | Human | Esophagus | ESCC | 6.29e-04 | 1.21e-01 | 0.0596 |
| 115361 | GBP4 | LZE6T | Human | Esophagus | ESCC | 9.61e-05 | 2.14e-01 | 0.0845 |
| 115361 | GBP4 | P2T-E | Human | Esophagus | ESCC | 8.27e-11 | 3.79e-01 | 0.1177 |
| 115361 | GBP4 | P8T-E | Human | Esophagus | ESCC | 2.32e-08 | 3.23e-01 | 0.0889 |
| 115361 | GBP4 | P9T-E | Human | Esophagus | ESCC | 8.16e-12 | 4.20e-01 | 0.1131 |
| 115361 | GBP4 | P11T-E | Human | Esophagus | ESCC | 6.27e-12 | 5.86e-01 | 0.1426 |
| 115361 | GBP4 | P15T-E | Human | Esophagus | ESCC | 3.26e-02 | 1.59e-01 | 0.1149 |
| 115361 | GBP4 | P17T-E | Human | Esophagus | ESCC | 3.52e-10 | 4.48e-01 | 0.1278 |
| 115361 | GBP4 | P20T-E | Human | Esophagus | ESCC | 1.51e-02 | 1.75e-01 | 0.1124 |
| 115361 | GBP4 | P23T-E | Human | Esophagus | ESCC | 2.24e-15 | 3.22e-01 | 0.108 |
| Page: 1 2 3 |
| Tissue | Expression Dynamics | Abbreviation |
| Cervix | 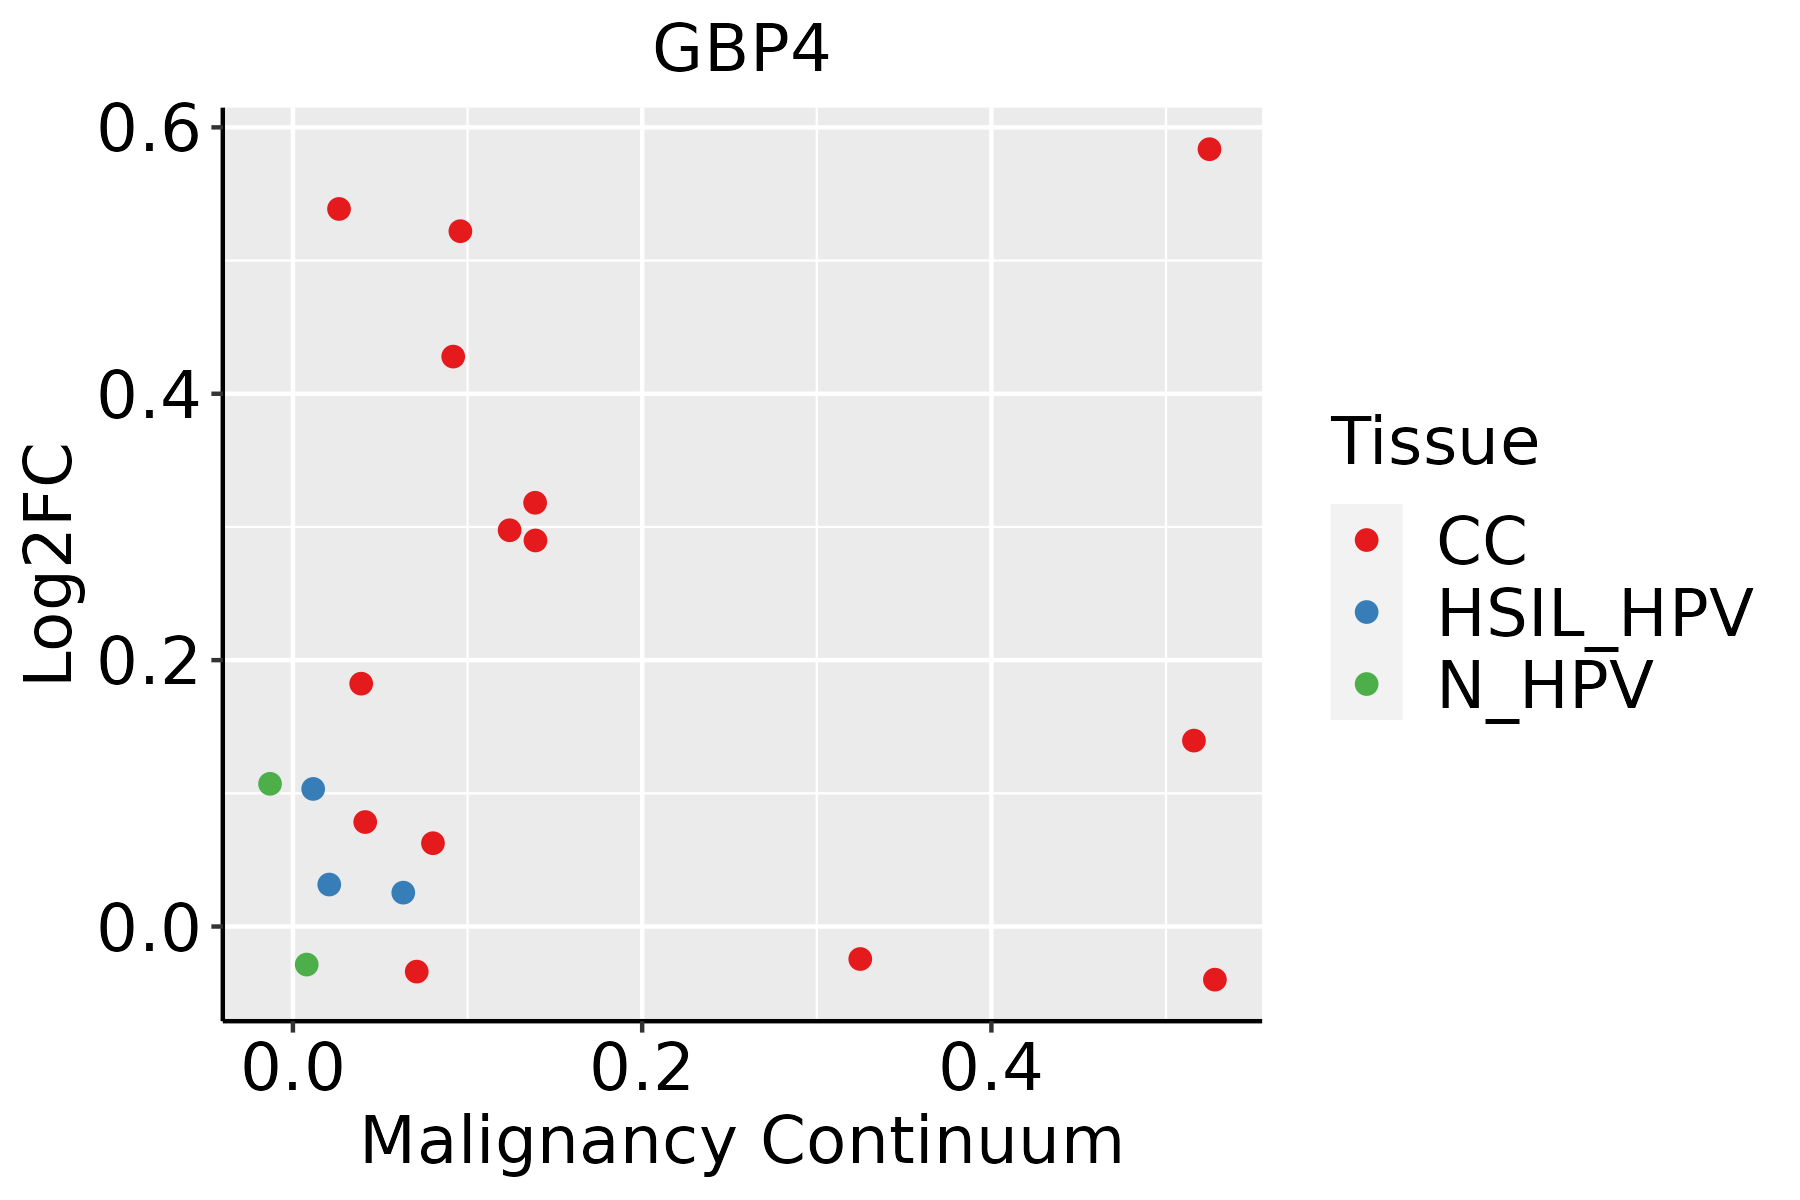 | CC: Cervix cancer |
| HSIL_HPV: HPV-infected high-grade squamous intraepithelial lesions | ||
| N_HPV: HPV-infected normal cervix | ||
| Esophagus | 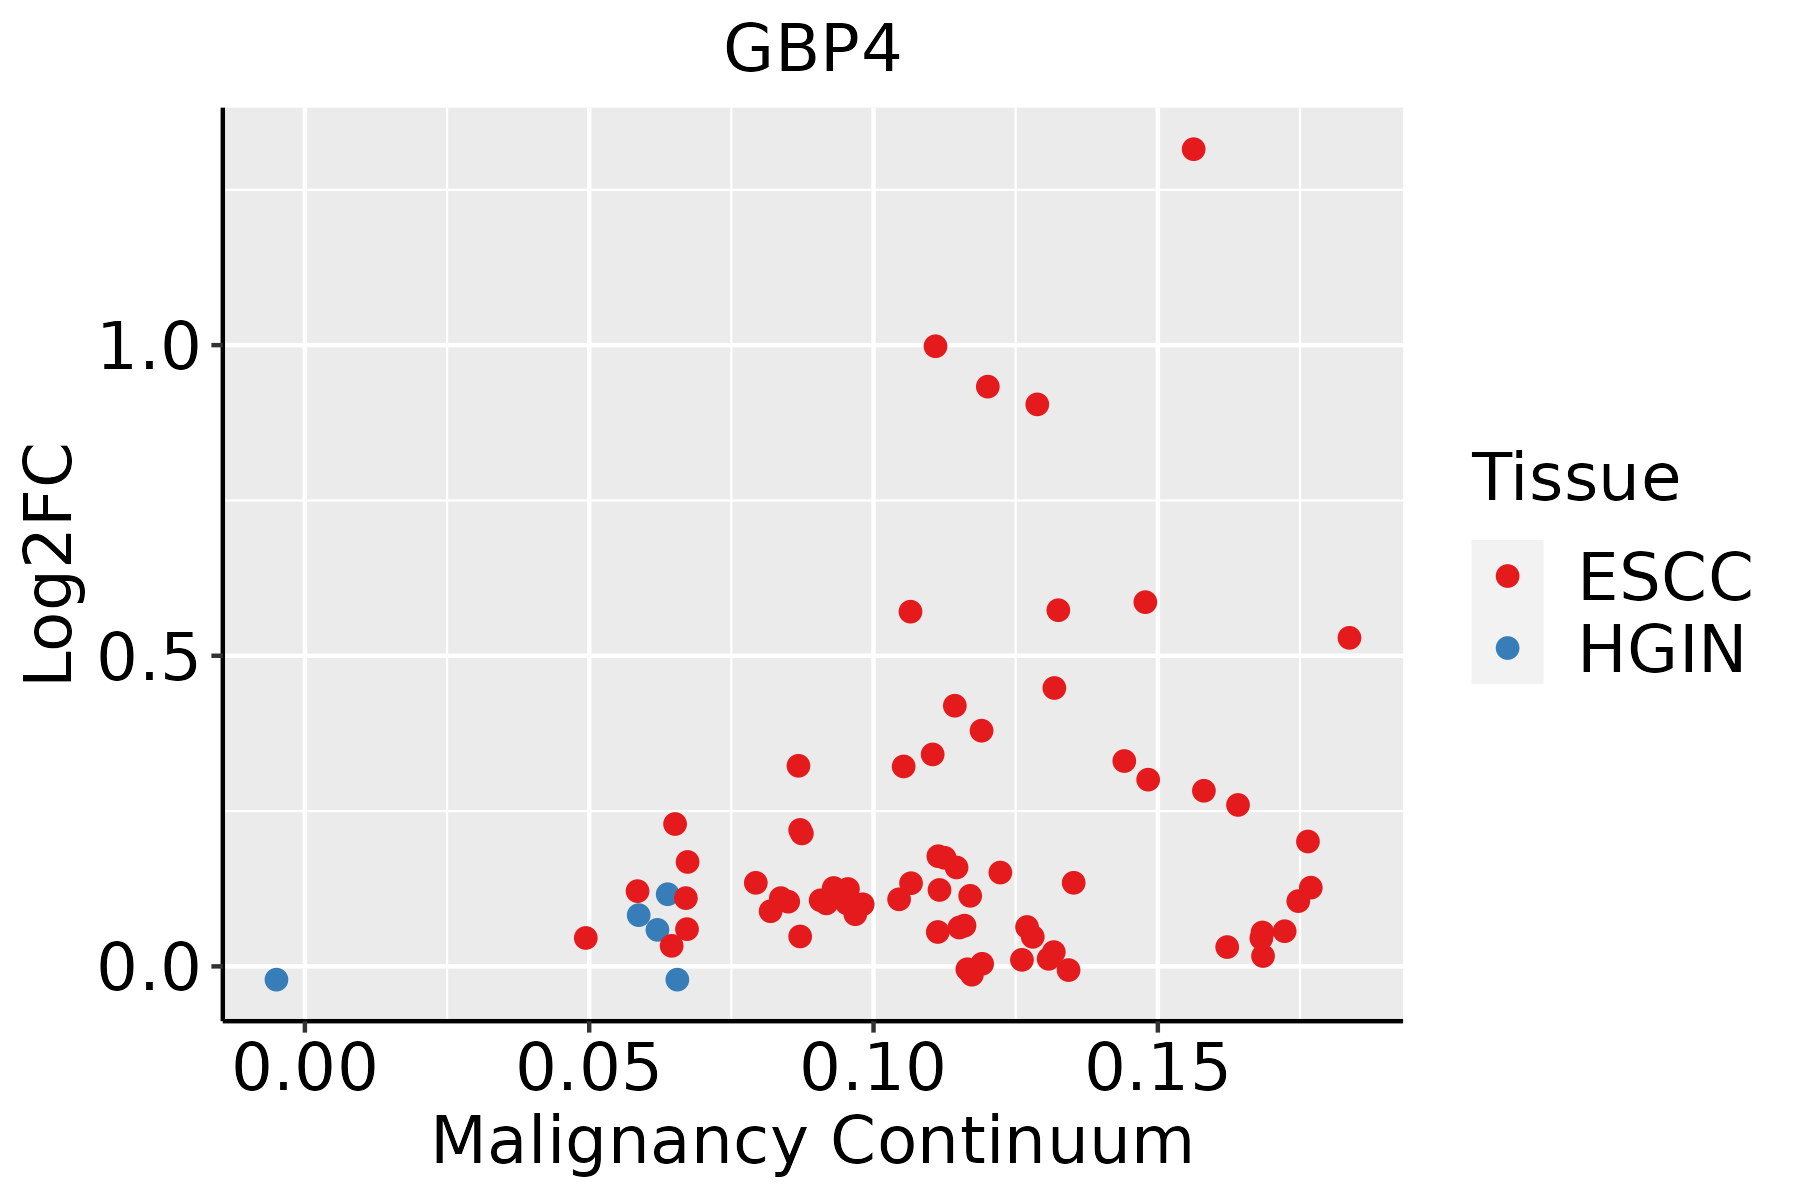 | ESCC: Esophageal squamous cell carcinoma |
| HGIN: High-grade intraepithelial neoplasias | ||
| LGIN: Low-grade intraepithelial neoplasias | ||
| Liver | 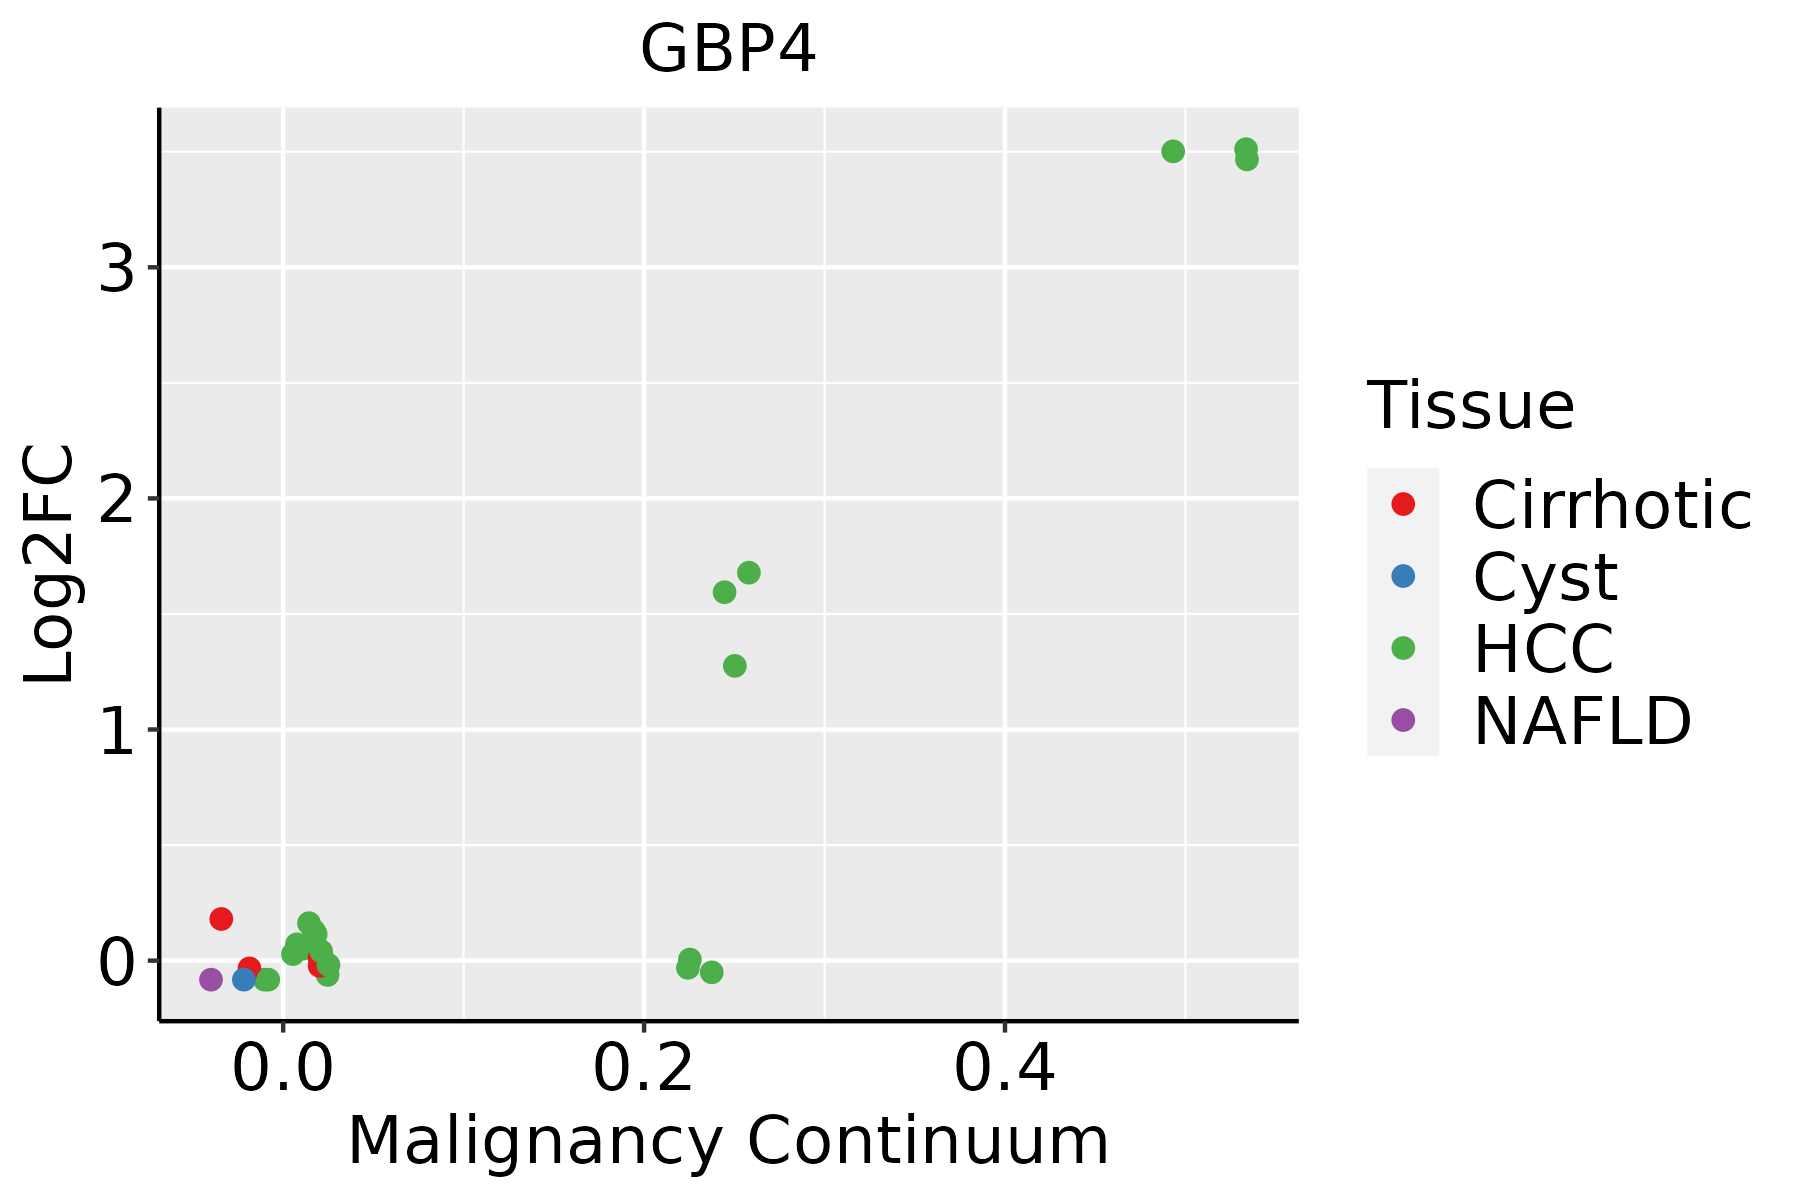 | HCC: Hepatocellular carcinoma |
| NAFLD: Non-alcoholic fatty liver disease | ||
| Oral Cavity |  | EOLP: Erosive Oral lichen planus |
| LP: leukoplakia | ||
| NEOLP: Non-erosive oral lichen planus | ||
| OSCC: Oral squamous cell carcinoma |
| ∗log2FC in expression of this searched gene in stem-like cells from each diseased tissue sample relative to stem-like cells in normal samples in each tissue plotted against the malignancy continuum. Samples are colored based on if they are from different disease stage. |
Top |
Malignant transformation related pathway analysis |
| Find out the enriched GO biological processes and KEGG pathways involved in transition from healthy to precancer to cancer |
| Tissue | Disease Stage | Enriched GO biological Processes |
| Colorectum | AD |  |
| Colorectum | SER |  |
| Colorectum | MSS |  |
| Colorectum | MSI-H |  |
| Colorectum | FAP |  |
| ∗Top 15 enriched GO BP terms are showed in the bar plot of each disease state in each tissue. Each row represents a significant GO biological process which is colored according to the -log10(p.adjust). |
| Page: 1 2 3 4 5 6 7 8 9 |
| GO ID | Tissue | Disease Stage | Description | Gene Ratio | Bg Ratio | pvalue | p.adjust | Count |
| GO:00343415 | Cervix | CC | response to interferon-gamma | 30/2311 | 141/18723 | 1.88e-03 | 1.39e-02 | 30 |
| GO:00713463 | Cervix | CC | cellular response to interferon-gamma | 25/2311 | 118/18723 | 4.54e-03 | 2.75e-02 | 25 |
| GO:00343418 | Esophagus | ESCC | response to interferon-gamma | 86/8552 | 141/18723 | 1.74e-04 | 1.14e-03 | 86 |
| GO:00713466 | Esophagus | ESCC | cellular response to interferon-gamma | 69/8552 | 118/18723 | 3.44e-03 | 1.41e-02 | 69 |
| GO:00343411 | Liver | HCC | response to interferon-gamma | 82/7958 | 141/18723 | 1.25e-04 | 1.03e-03 | 82 |
| GO:00713461 | Liver | HCC | cellular response to interferon-gamma | 70/7958 | 118/18723 | 1.66e-04 | 1.32e-03 | 70 |
| GO:00343417 | Oral cavity | OSCC | response to interferon-gamma | 81/7305 | 141/18723 | 6.77e-06 | 7.43e-05 | 81 |
| GO:00713465 | Oral cavity | OSCC | cellular response to interferon-gamma | 65/7305 | 118/18723 | 2.83e-04 | 1.79e-03 | 65 |
| GO:003434131 | Oral cavity | NEOLP | response to interferon-gamma | 36/2005 | 141/18723 | 5.06e-07 | 1.52e-05 | 36 |
| GO:007134631 | Oral cavity | NEOLP | cellular response to interferon-gamma | 27/2005 | 118/18723 | 1.03e-04 | 1.24e-03 | 27 |
| Page: 1 |
| Pathway ID | Tissue | Disease Stage | Description | Gene Ratio | Bg Ratio | pvalue | p.adjust | qvalue | Count |
| hsa046213 | Cervix | CC | NOD-like receptor signaling pathway | 41/1267 | 186/8465 | 5.90e-03 | 1.95e-02 | 1.15e-02 | 41 |
| hsa0462112 | Cervix | CC | NOD-like receptor signaling pathway | 41/1267 | 186/8465 | 5.90e-03 | 1.95e-02 | 1.15e-02 | 41 |
| hsa0462122 | Esophagus | ESCC | NOD-like receptor signaling pathway | 116/4205 | 186/8465 | 2.90e-04 | 1.03e-03 | 5.30e-04 | 116 |
| hsa0462132 | Esophagus | ESCC | NOD-like receptor signaling pathway | 116/4205 | 186/8465 | 2.90e-04 | 1.03e-03 | 5.30e-04 | 116 |
| hsa046218 | Oral cavity | OSCC | NOD-like receptor signaling pathway | 108/3704 | 186/8465 | 5.13e-05 | 2.07e-04 | 1.05e-04 | 108 |
| hsa0462113 | Oral cavity | OSCC | NOD-like receptor signaling pathway | 108/3704 | 186/8465 | 5.13e-05 | 2.07e-04 | 1.05e-04 | 108 |
| hsa046216 | Oral cavity | NEOLP | NOD-like receptor signaling pathway | 39/1112 | 186/8465 | 1.79e-03 | 7.91e-03 | 4.98e-03 | 39 |
| hsa046217 | Oral cavity | NEOLP | NOD-like receptor signaling pathway | 39/1112 | 186/8465 | 1.79e-03 | 7.91e-03 | 4.98e-03 | 39 |
| Page: 1 |
Top |
Cell-cell communication analysis |
| Identification of potential cell-cell interactions between two cell types and their ligand-receptor pairs for different disease states |
| Ligand | Receptor | LRpair | Pathway | Tissue | Disease Stage |
| Page: 1 |
Top |
Single-cell gene regulatory network inference analysis |
| Find out the significant the regulons (TFs) and the target genes of each regulon across cell types for different disease states |
| TF | Cell Type | Tissue | Disease Stage | Target Gene | RSS | Regulon Activity |
| ∗The dot plots of a searched regulon are shown for all cell subpopulations in each disease state of each tissue based on the regulon specific score inferred using pySCENIC and by calculating the average expression. |
| Page: 1 |
Top |
Somatic mutation of malignant transformation related genes |
| Annotation of somatic variants for genes involved in malignant transformation |
| Hugo Symbol | Variant Class | Variant Classification | dbSNP RS | HGVSc | HGVSp | HGVSp Short | SWISSPROT | BIOTYPE | SIFT | PolyPhen | Tumor Sample Barcode | Tissue | Histology | Sex | Age | Stage | Therapy Types | Drugs | Outcome |
| GBP4 | SNV | Missense_Mutation | novel | c.1078N>T | p.Pro360Ser | p.P360S | Q96PP9 | protein_coding | deleterious(0.01) | probably_damaging(0.942) | TCGA-5L-AAT0-01 | Breast | breast invasive carcinoma | Female | <65 | I/II | Hormone Therapy | tamoxiphen | SD |
| GBP4 | SNV | Missense_Mutation | rs771688858 | c.340N>A | p.Glu114Lys | p.E114K | Q96PP9 | protein_coding | deleterious(0.01) | probably_damaging(1) | TCGA-A2-A0ET-01 | Breast | breast invasive carcinoma | Female | <65 | III/IV | Chemotherapy | cytoxan | SD |
| GBP4 | SNV | Missense_Mutation | c.1785A>C | p.Glu595Asp | p.E595D | Q96PP9 | protein_coding | tolerated(0.17) | benign(0.007) | TCGA-A2-A0EU-01 | Breast | breast invasive carcinoma | Female | >=65 | I/II | Unknown | Unknown | SD | |
| GBP4 | SNV | Missense_Mutation | novel | c.1200N>G | p.Asp400Glu | p.D400E | Q96PP9 | protein_coding | tolerated(1) | benign(0.006) | TCGA-A8-A092-01 | Breast | breast invasive carcinoma | Female | <65 | III/IV | Chemotherapy | paclitaxel | CR |
| GBP4 | SNV | Missense_Mutation | c.526N>C | p.Asp176His | p.D176H | Q96PP9 | protein_coding | tolerated(0.1) | benign(0.111) | TCGA-C8-A27B-01 | Breast | breast invasive carcinoma | Female | <65 | I/II | Chemotherapy | 5-fluorouracil | CR | |
| GBP4 | SNV | Missense_Mutation | c.1714G>A | p.Glu572Lys | p.E572K | Q96PP9 | protein_coding | tolerated(0.39) | benign(0.014) | TCGA-D8-A1J9-01 | Breast | breast invasive carcinoma | Female | <65 | I/II | Unknown | Unknown | SD | |
| GBP4 | SNV | Missense_Mutation | c.496N>G | p.Leu166Val | p.L166V | Q96PP9 | protein_coding | deleterious(0.03) | possibly_damaging(0.692) | TCGA-E9-A1RF-01 | Breast | breast invasive carcinoma | Female | >=65 | III/IV | Hormone Therapy | tamoxiphen | SD | |
| GBP4 | insertion | Nonsense_Mutation | novel | c.1198-1_1198insTCACATGATCTTCTGAAGCTTGATGGTCTCTAGGT | p.Asp400SerfsTer11 | p.D400Sfs*11 | Q96PP9 | protein_coding | TCGA-A8-A092-01 | Breast | breast invasive carcinoma | Female | <65 | III/IV | Chemotherapy | paclitaxel | CR | ||
| GBP4 | insertion | Nonsense_Mutation | novel | c.1150_1151insTTTGATTCTCGGAATAATGTAAATTAGGTACCACTATCGTCCACAT | p.Glu384ValfsTer2 | p.E384Vfs*2 | Q96PP9 | protein_coding | TCGA-B6-A0RG-01 | Breast | breast invasive carcinoma | Female | <65 | I/II | Unknown | Unknown | SD | ||
| GBP4 | SNV | Missense_Mutation | novel | c.1839G>A | p.Met613Ile | p.M613I | Q96PP9 | protein_coding | tolerated(0.23) | benign(0) | TCGA-2W-A8YY-01 | Cervix | cervical & endocervical cancer | Female | <65 | I/II | Chemotherapy | cisplatin | CR |
| Page: 1 2 3 4 5 6 7 8 9 10 11 |
Top |
Related drugs of malignant transformation related genes |
| Identification of chemicals and drugs interact with genes involved in malignant transfromation |
| (DGIdb 4.0) |
| Entrez ID | Symbol | Category | Interaction Types | Drug Claim Name | Drug Name | PMIDs |
| Page: 1 |

Copyright 2023-Present -The University of Texas Health Science Center at Houston |