
|
|||||
|
 | |
| |
| |
| |
| |
| |
|
Gene: GBP3 |
Gene summary for GBP3 |
| Gene information | Species | Human | Gene symbol | GBP3 | Gene ID | 2635 |
| Gene name | guanylate binding protein 3 | |
| Gene Alias | GBP3 | |
| Cytomap | 1p22.2 | |
| Gene Type | protein-coding | GO ID | GO:0002376 | UniProtAcc | Q9H0R5 |
Top |
Malignant transformation analysis |
| Identification of the aberrant gene expression in precancerous and cancerous lesions by comparing the gene expression of stem-like cells in diseased tissues with normal stem cells |
| Entrez ID | Symbol | Replicates | Species | Organ | Tissue | Adj P-value | Log2FC | Malignancy |
| 2635 | GBP3 | HTA11_1938_2000001011 | Human | Colorectum | AD | 2.05e-03 | 2.43e-01 | -0.0811 |
| 2635 | GBP3 | HTA11_347_2000001011 | Human | Colorectum | AD | 3.13e-08 | 3.02e-01 | -0.1954 |
| 2635 | GBP3 | LZE5T | Human | Esophagus | ESCC | 4.02e-02 | 1.30e-01 | 0.0514 |
| 2635 | GBP3 | LZE20T | Human | Esophagus | ESCC | 4.42e-09 | 3.26e-01 | 0.0662 |
| 2635 | GBP3 | P2T-E | Human | Esophagus | ESCC | 5.98e-09 | 2.22e-01 | 0.1177 |
| 2635 | GBP3 | P4T-E | Human | Esophagus | ESCC | 1.71e-04 | 1.43e-01 | 0.1323 |
| 2635 | GBP3 | P5T-E | Human | Esophagus | ESCC | 4.17e-10 | 3.41e-02 | 0.1327 |
| 2635 | GBP3 | P8T-E | Human | Esophagus | ESCC | 3.14e-28 | 7.39e-01 | 0.0889 |
| 2635 | GBP3 | P11T-E | Human | Esophagus | ESCC | 1.42e-13 | 5.37e-01 | 0.1426 |
| 2635 | GBP3 | P12T-E | Human | Esophagus | ESCC | 1.13e-08 | 2.18e-01 | 0.1122 |
| 2635 | GBP3 | P16T-E | Human | Esophagus | ESCC | 2.76e-02 | -5.67e-02 | 0.1153 |
| 2635 | GBP3 | P17T-E | Human | Esophagus | ESCC | 6.94e-06 | 3.22e-01 | 0.1278 |
| 2635 | GBP3 | P20T-E | Human | Esophagus | ESCC | 3.61e-08 | 2.26e-01 | 0.1124 |
| 2635 | GBP3 | P21T-E | Human | Esophagus | ESCC | 2.79e-21 | 5.72e-01 | 0.1617 |
| 2635 | GBP3 | P22T-E | Human | Esophagus | ESCC | 5.09e-08 | 5.61e-02 | 0.1236 |
| 2635 | GBP3 | P23T-E | Human | Esophagus | ESCC | 1.18e-10 | 3.02e-01 | 0.108 |
| 2635 | GBP3 | P24T-E | Human | Esophagus | ESCC | 2.99e-06 | 2.85e-01 | 0.1287 |
| 2635 | GBP3 | P26T-E | Human | Esophagus | ESCC | 2.70e-06 | 1.72e-02 | 0.1276 |
| 2635 | GBP3 | P27T-E | Human | Esophagus | ESCC | 2.37e-08 | 1.29e-01 | 0.1055 |
| 2635 | GBP3 | P31T-E | Human | Esophagus | ESCC | 6.44e-05 | 1.70e-01 | 0.1251 |
| Page: 1 2 3 4 5 |
| Tissue | Expression Dynamics | Abbreviation |
| Colorectum (GSE201348) |  | FAP: Familial adenomatous polyposis |
| CRC: Colorectal cancer | ||
| Colorectum (HTA11) |  | AD: Adenomas |
| SER: Sessile serrated lesions | ||
| MSI-H: Microsatellite-high colorectal cancer | ||
| MSS: Microsatellite stable colorectal cancer | ||
| Esophagus | 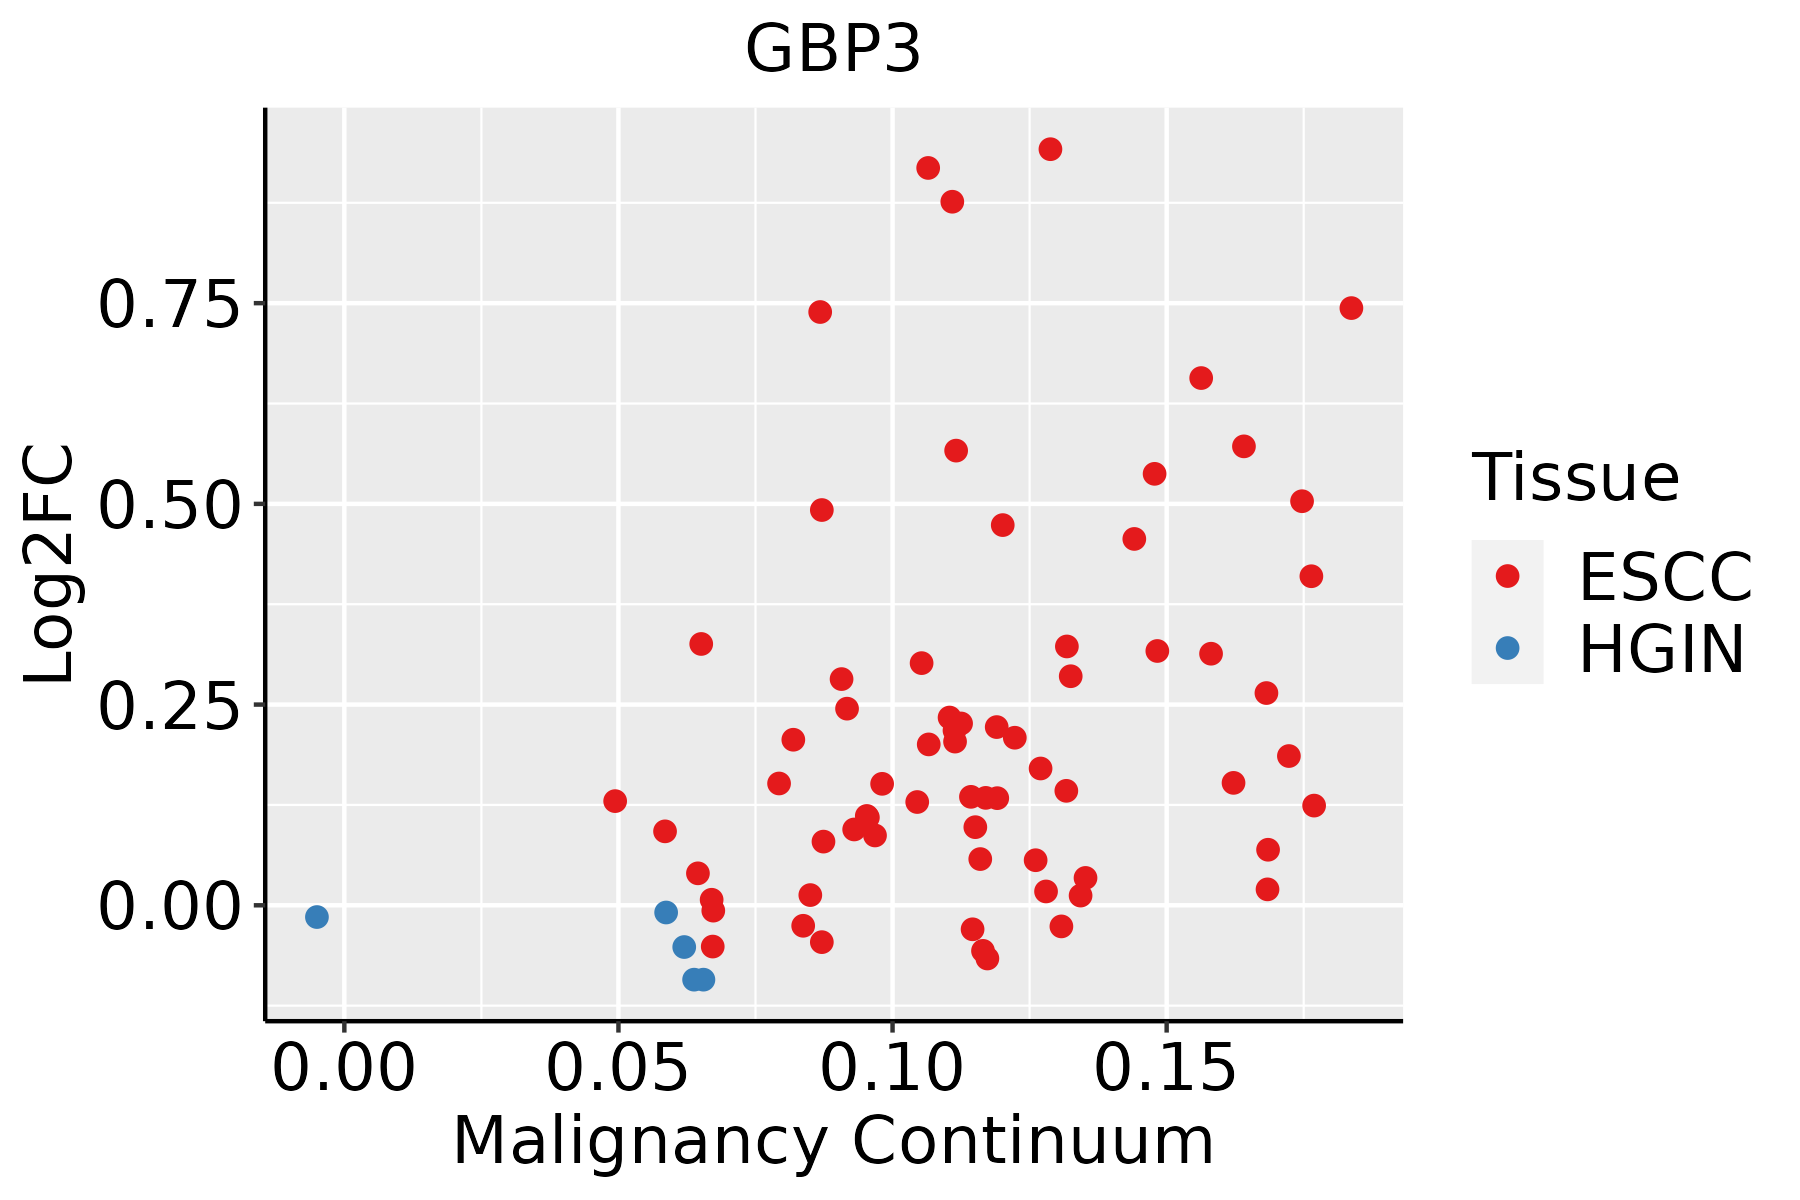 | ESCC: Esophageal squamous cell carcinoma |
| HGIN: High-grade intraepithelial neoplasias | ||
| LGIN: Low-grade intraepithelial neoplasias | ||
| Liver |  | HCC: Hepatocellular carcinoma |
| NAFLD: Non-alcoholic fatty liver disease | ||
| Oral Cavity |  | EOLP: Erosive Oral lichen planus |
| LP: leukoplakia | ||
| NEOLP: Non-erosive oral lichen planus | ||
| OSCC: Oral squamous cell carcinoma | ||
| Skin | 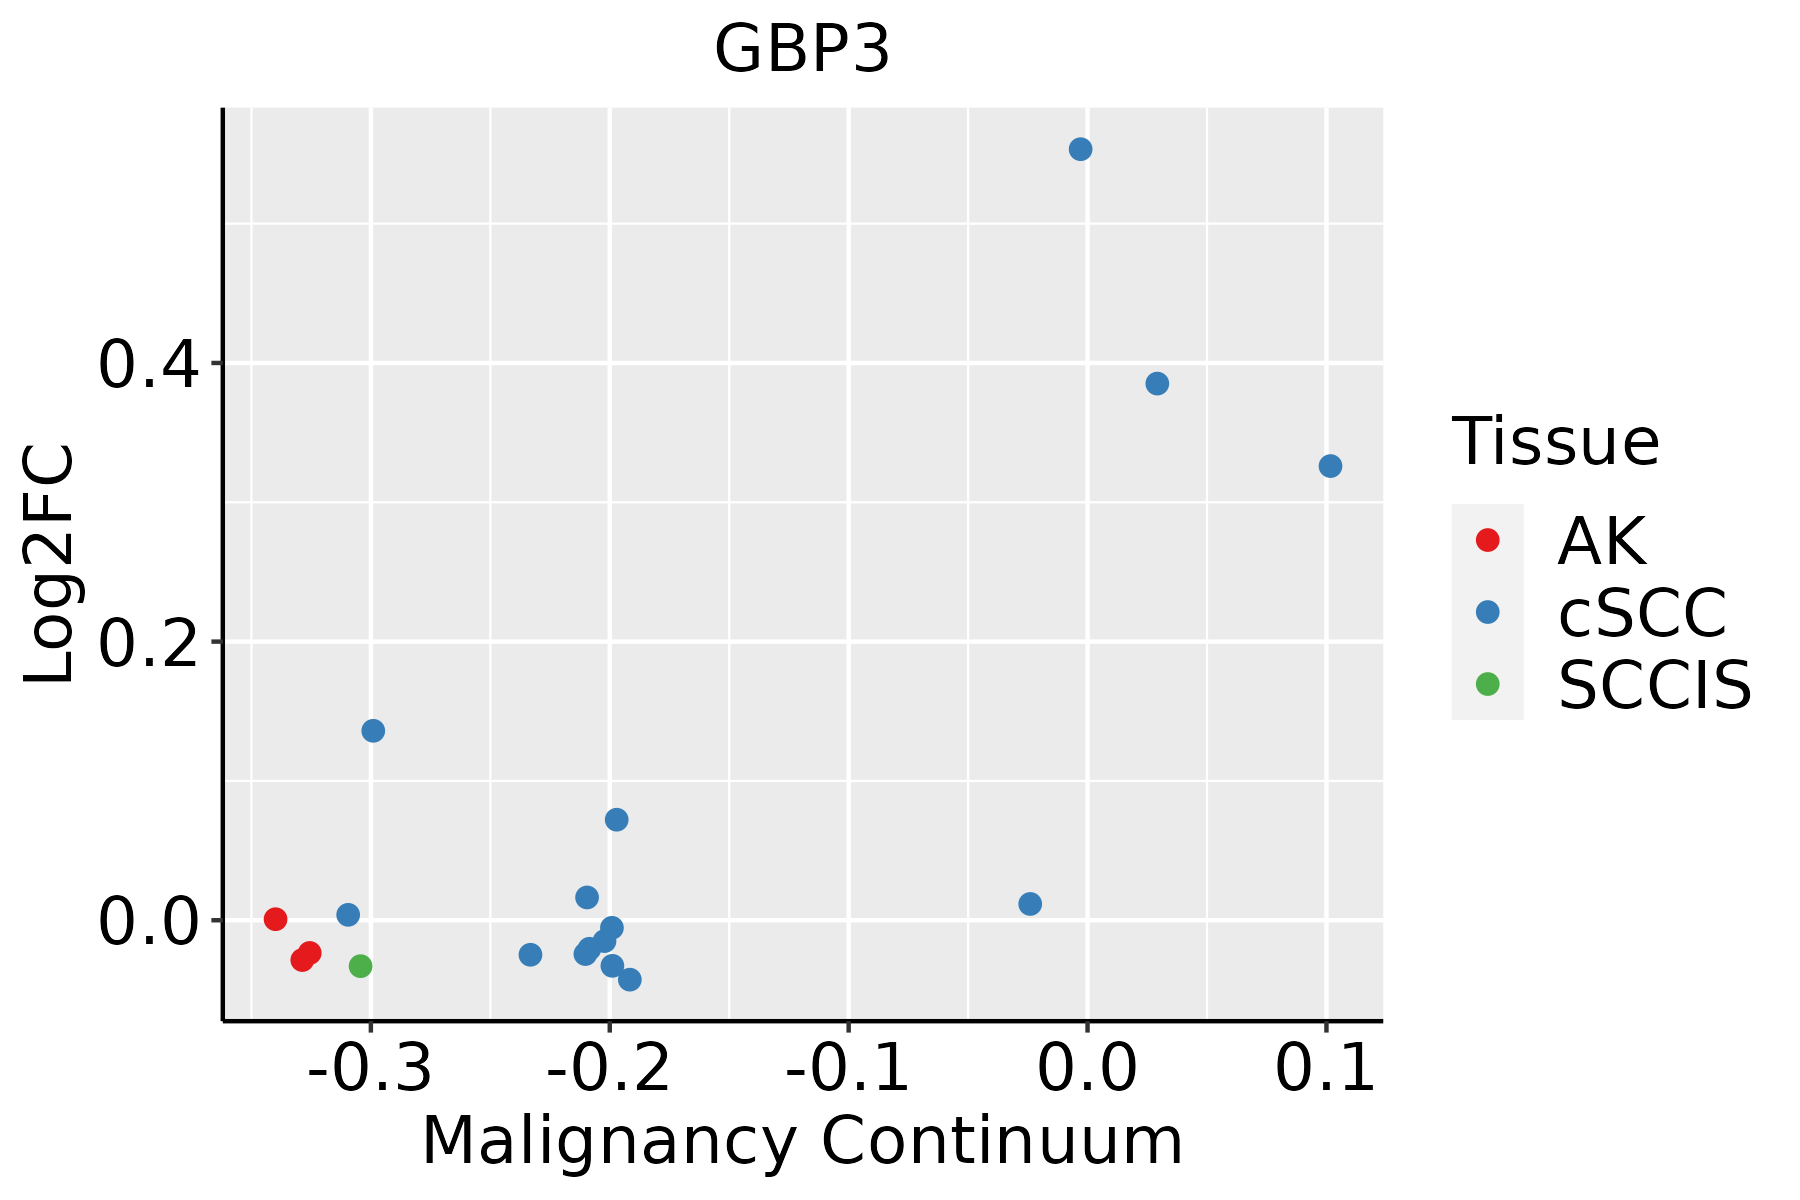 | AK: Actinic keratosis |
| cSCC: Cutaneous squamous cell carcinoma | ||
| SCCIS:squamous cell carcinoma in situ | ||
| Thyroid |  | ATC: Anaplastic thyroid cancer |
| HT: Hashimoto's thyroiditis | ||
| PTC: Papillary thyroid cancer |
| ∗log2FC in expression of this searched gene in stem-like cells from each diseased tissue sample relative to stem-like cells in normal samples in each tissue plotted against the malignancy continuum. Samples are colored based on if they are from different disease stage. |
Top |
Malignant transformation related pathway analysis |
| Find out the enriched GO biological processes and KEGG pathways involved in transition from healthy to precancer to cancer |
| Tissue | Disease Stage | Enriched GO biological Processes |
| Colorectum | AD |  |
| Colorectum | SER |  |
| Colorectum | MSS |  |
| Colorectum | MSI-H |  |
| Colorectum | FAP |  |
| ∗Top 15 enriched GO BP terms are showed in the bar plot of each disease state in each tissue. Each row represents a significant GO biological process which is colored according to the -log10(p.adjust). |
| Page: 1 2 3 4 5 6 7 8 9 |
| GO ID | Tissue | Disease Stage | Description | Gene Ratio | Bg Ratio | pvalue | p.adjust | Count |
| GO:000961518 | Esophagus | ESCC | response to virus | 238/8552 | 367/18723 | 6.65e-14 | 3.32e-12 | 238 |
| GO:00516075 | Esophagus | ESCC | defense response to virus | 171/8552 | 265/18723 | 3.91e-10 | 1.05e-08 | 171 |
| GO:01405465 | Esophagus | ESCC | defense response to symbiont | 171/8552 | 265/18723 | 3.91e-10 | 1.05e-08 | 171 |
| GO:003461220 | Esophagus | ESCC | response to tumor necrosis factor | 149/8552 | 253/18723 | 1.47e-05 | 1.33e-04 | 149 |
| GO:007135620 | Esophagus | ESCC | cellular response to tumor necrosis factor | 132/8552 | 229/18723 | 1.69e-04 | 1.11e-03 | 132 |
| GO:00343418 | Esophagus | ESCC | response to interferon-gamma | 86/8552 | 141/18723 | 1.74e-04 | 1.14e-03 | 86 |
| GO:00713466 | Esophagus | ESCC | cellular response to interferon-gamma | 69/8552 | 118/18723 | 3.44e-03 | 1.41e-02 | 69 |
| GO:000961511 | Liver | HCC | response to virus | 210/7958 | 367/18723 | 7.32e-09 | 1.86e-07 | 210 |
| GO:00516071 | Liver | HCC | defense response to virus | 151/7958 | 265/18723 | 1.27e-06 | 1.85e-05 | 151 |
| GO:01405461 | Liver | HCC | defense response to symbiont | 151/7958 | 265/18723 | 1.27e-06 | 1.85e-05 | 151 |
| GO:00343411 | Liver | HCC | response to interferon-gamma | 82/7958 | 141/18723 | 1.25e-04 | 1.03e-03 | 82 |
| GO:00713461 | Liver | HCC | cellular response to interferon-gamma | 70/7958 | 118/18723 | 1.66e-04 | 1.32e-03 | 70 |
| GO:00705551 | Liver | HCC | response to interleukin-1 | 80/7958 | 143/18723 | 7.95e-04 | 4.77e-03 | 80 |
| GO:003461211 | Liver | HCC | response to tumor necrosis factor | 132/7958 | 253/18723 | 1.14e-03 | 6.48e-03 | 132 |
| GO:00713471 | Liver | HCC | cellular response to interleukin-1 | 61/7958 | 113/18723 | 8.98e-03 | 3.46e-02 | 61 |
| GO:007135611 | Liver | HCC | cellular response to tumor necrosis factor | 115/7958 | 229/18723 | 1.08e-02 | 3.99e-02 | 115 |
| GO:000961515 | Oral cavity | OSCC | response to virus | 215/7305 | 367/18723 | 1.63e-14 | 9.41e-13 | 215 |
| GO:00516074 | Oral cavity | OSCC | defense response to virus | 154/7305 | 265/18723 | 1.96e-10 | 5.63e-09 | 154 |
| GO:01405464 | Oral cavity | OSCC | defense response to symbiont | 154/7305 | 265/18723 | 1.96e-10 | 5.63e-09 | 154 |
| GO:003461218 | Oral cavity | OSCC | response to tumor necrosis factor | 143/7305 | 253/18723 | 1.09e-08 | 2.23e-07 | 143 |
| Page: 1 2 3 |
| Pathway ID | Tissue | Disease Stage | Description | Gene Ratio | Bg Ratio | pvalue | p.adjust | qvalue | Count |
| hsa0462122 | Esophagus | ESCC | NOD-like receptor signaling pathway | 116/4205 | 186/8465 | 2.90e-04 | 1.03e-03 | 5.30e-04 | 116 |
| hsa0462132 | Esophagus | ESCC | NOD-like receptor signaling pathway | 116/4205 | 186/8465 | 2.90e-04 | 1.03e-03 | 5.30e-04 | 116 |
| hsa046218 | Oral cavity | OSCC | NOD-like receptor signaling pathway | 108/3704 | 186/8465 | 5.13e-05 | 2.07e-04 | 1.05e-04 | 108 |
| hsa0462113 | Oral cavity | OSCC | NOD-like receptor signaling pathway | 108/3704 | 186/8465 | 5.13e-05 | 2.07e-04 | 1.05e-04 | 108 |
| hsa0462121 | Oral cavity | LP | NOD-like receptor signaling pathway | 73/2418 | 186/8465 | 9.80e-04 | 4.53e-03 | 2.92e-03 | 73 |
| hsa0462131 | Oral cavity | LP | NOD-like receptor signaling pathway | 73/2418 | 186/8465 | 9.80e-04 | 4.53e-03 | 2.92e-03 | 73 |
| Page: 1 |
Top |
Cell-cell communication analysis |
| Identification of potential cell-cell interactions between two cell types and their ligand-receptor pairs for different disease states |
| Ligand | Receptor | LRpair | Pathway | Tissue | Disease Stage |
| Page: 1 |
Top |
Single-cell gene regulatory network inference analysis |
| Find out the significant the regulons (TFs) and the target genes of each regulon across cell types for different disease states |
| TF | Cell Type | Tissue | Disease Stage | Target Gene | RSS | Regulon Activity |
| ∗The dot plots of a searched regulon are shown for all cell subpopulations in each disease state of each tissue based on the regulon specific score inferred using pySCENIC and by calculating the average expression. |
| Page: 1 |
Top |
Somatic mutation of malignant transformation related genes |
| Annotation of somatic variants for genes involved in malignant transformation |
| Hugo Symbol | Variant Class | Variant Classification | dbSNP RS | HGVSc | HGVSp | HGVSp Short | SWISSPROT | BIOTYPE | SIFT | PolyPhen | Tumor Sample Barcode | Tissue | Histology | Sex | Age | Stage | Therapy Types | Drugs | Outcome |
| GBP3 | SNV | Missense_Mutation | novel | c.218N>A | p.Ser73Tyr | p.S73Y | Q9H0R5 | protein_coding | deleterious(0) | probably_damaging(0.994) | TCGA-5L-AAT1-01 | Breast | breast invasive carcinoma | Female | <65 | III/IV | Hormone Therapy | letrozol | SD |
| GBP3 | SNV | Missense_Mutation | c.577C>A | p.Pro193Thr | p.P193T | Q9H0R5 | protein_coding | tolerated(0.15) | benign(0.035) | TCGA-D8-A1XQ-01 | Breast | breast invasive carcinoma | Female | >=65 | I/II | Unknown | Unknown | SD | |
| GBP3 | SNV | Missense_Mutation | c.1121N>A | p.Val374Glu | p.V374E | Q9H0R5 | protein_coding | tolerated(0.89) | benign(0.021) | TCGA-E9-A1R3-01 | Breast | breast invasive carcinoma | Female | >=65 | III/IV | Chemotherapy | methotrexate | SD | |
| GBP3 | SNV | Missense_Mutation | c.897N>G | p.Ile299Met | p.I299M | Q9H0R5 | protein_coding | deleterious(0.02) | benign(0.166) | TCGA-Z7-A8R6-01 | Breast | breast invasive carcinoma | Female | <65 | I/II | Chemotherapy | taxol | CR | |
| GBP3 | insertion | Frame_Shift_Ins | novel | c.1212_1213insGTCCCAGG | p.Cys405ValfsTer15 | p.C405Vfs*15 | Q9H0R5 | protein_coding | TCGA-AN-A03X-01 | Breast | breast invasive carcinoma | Female | >=65 | I/II | Unknown | Unknown | SD | ||
| GBP3 | insertion | Frame_Shift_Ins | novel | c.1184_1185insT | p.Lys395AsnfsTer53 | p.K395Nfs*53 | Q9H0R5 | protein_coding | TCGA-AR-A0U0-01 | Breast | breast invasive carcinoma | Female | >=65 | I/II | Unknown | Unknown | SD | ||
| GBP3 | insertion | In_Frame_Ins | novel | c.894_895insTTCTATCACATTTACATGGATTTGGATTTTGGAAGGCAA | p.Tyr298_Ile299insPheTyrHisIleTyrMetAspLeuAspPheGlyArgGln | p.Y298_I299insFYHIYMDLDFGRQ | Q9H0R5 | protein_coding | TCGA-BH-A0HQ-01 | Breast | breast invasive carcinoma | Female | <65 | I/II | Hormone Therapy | arimidex | SD | ||
| GBP3 | SNV | Missense_Mutation | c.911N>A | p.Arg304Lys | p.R304K | Q9H0R5 | protein_coding | deleterious(0.03) | benign(0.021) | TCGA-IR-A3LI-01 | Cervix | cervical & endocervical cancer | Female | <65 | I/II | Chemotherapy | cisplatin | CR | |
| GBP3 | SNV | Missense_Mutation | c.1174G>A | p.Asp392Asn | p.D392N | Q9H0R5 | protein_coding | tolerated(0.18) | benign(0.071) | TCGA-IR-A3LK-01 | Cervix | cervical & endocervical cancer | Female | >=65 | I/II | Chemotherapy | cisplatin | PD | |
| GBP3 | deletion | Frame_Shift_Del | rs769821857 | c.1753delA | p.Thr585ProfsTer9 | p.T585Pfs*9 | Q9H0R5 | protein_coding | TCGA-2W-A8YY-01 | Cervix | cervical & endocervical cancer | Female | <65 | I/II | Chemotherapy | cisplatin | CR |
| Page: 1 2 3 4 5 6 7 8 |
Top |
Related drugs of malignant transformation related genes |
| Identification of chemicals and drugs interact with genes involved in malignant transfromation |
| (DGIdb 4.0) |
| Entrez ID | Symbol | Category | Interaction Types | Drug Claim Name | Drug Name | PMIDs |
| Page: 1 |

Copyright 2023-Present -The University of Texas Health Science Center at Houston |