| Tissue | Expression Dynamics | Abbreviation |
| Breast |  | IDC: Invasive ductal carcinoma |
| DCIS: Ductal carcinoma in situ |
| Precancer(BRCA1-mut): Precancerous lesion from BRCA1 mutation carriers |
| Esophagus | 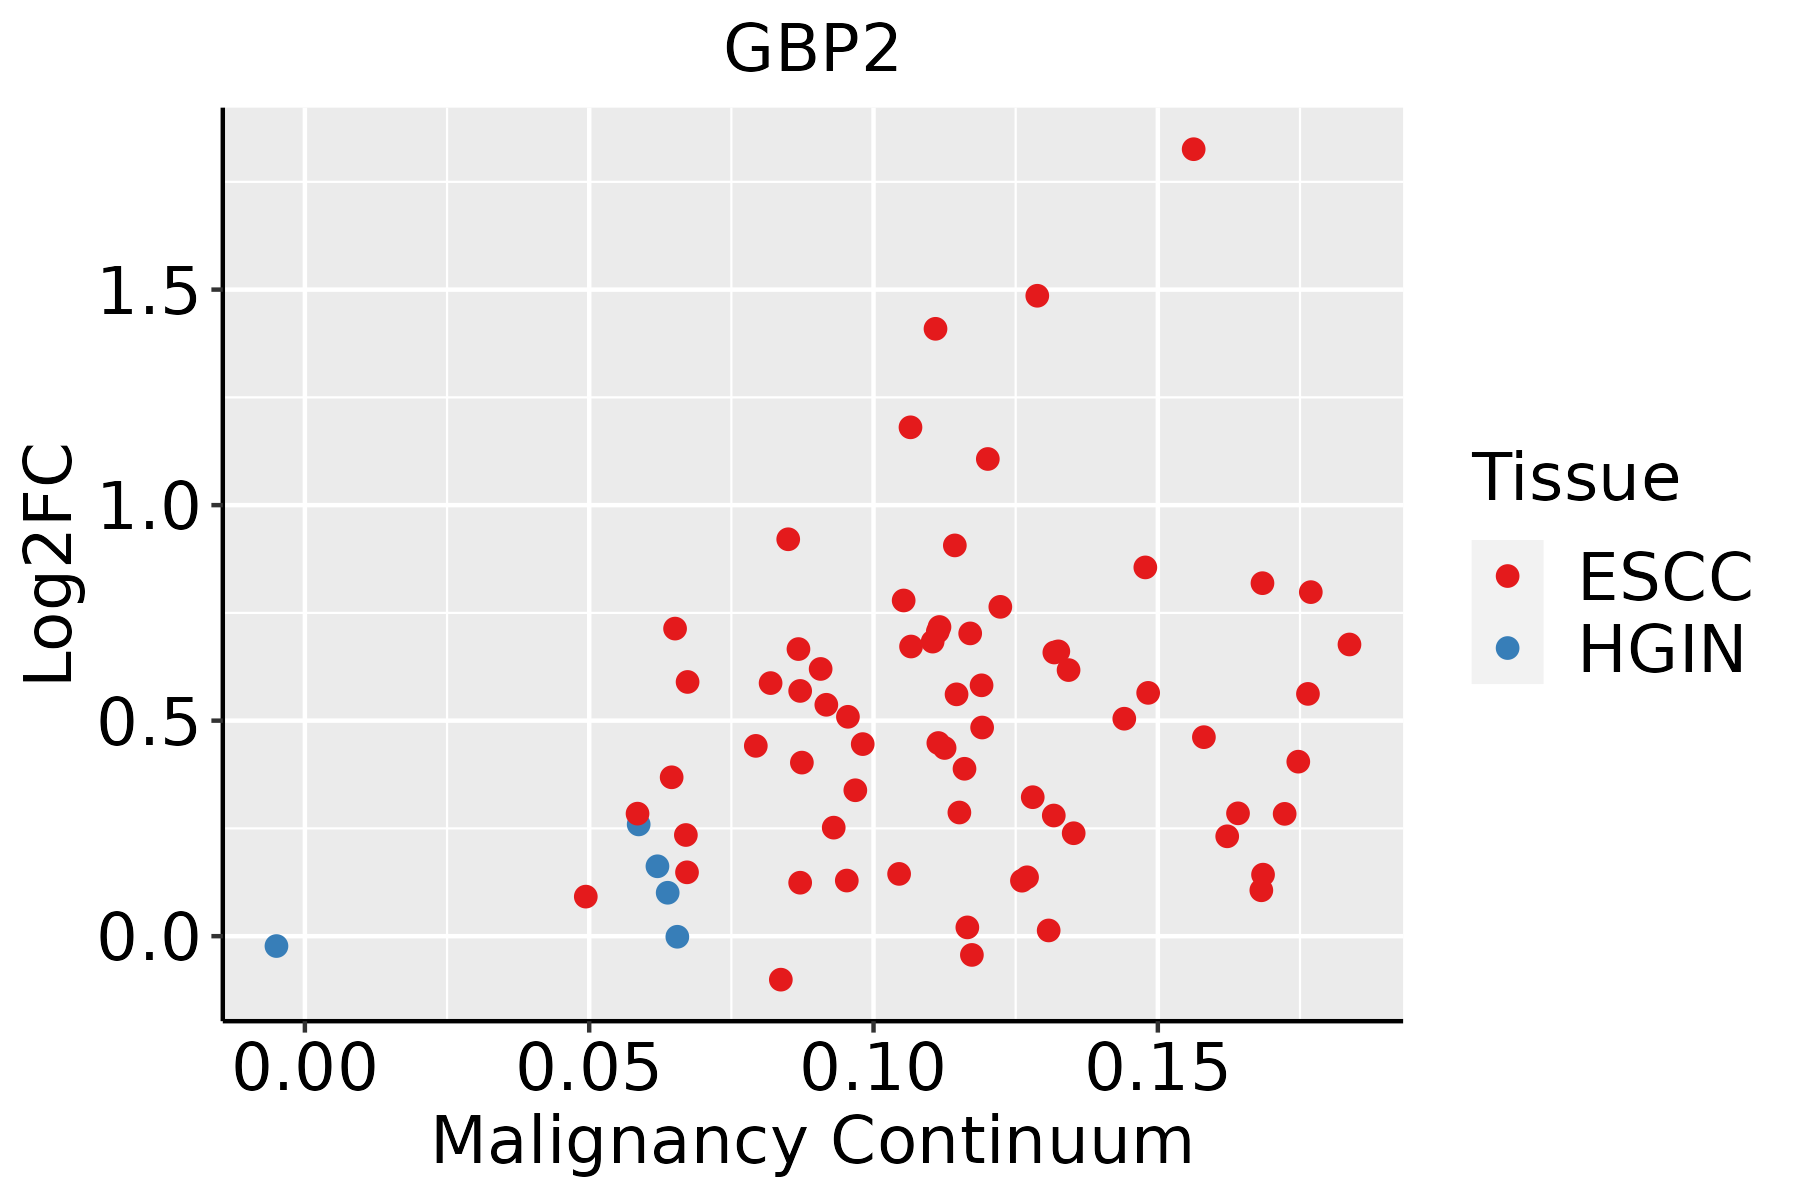 | ESCC: Esophageal squamous cell carcinoma |
| HGIN: High-grade intraepithelial neoplasias |
| LGIN: Low-grade intraepithelial neoplasias |
| Liver | 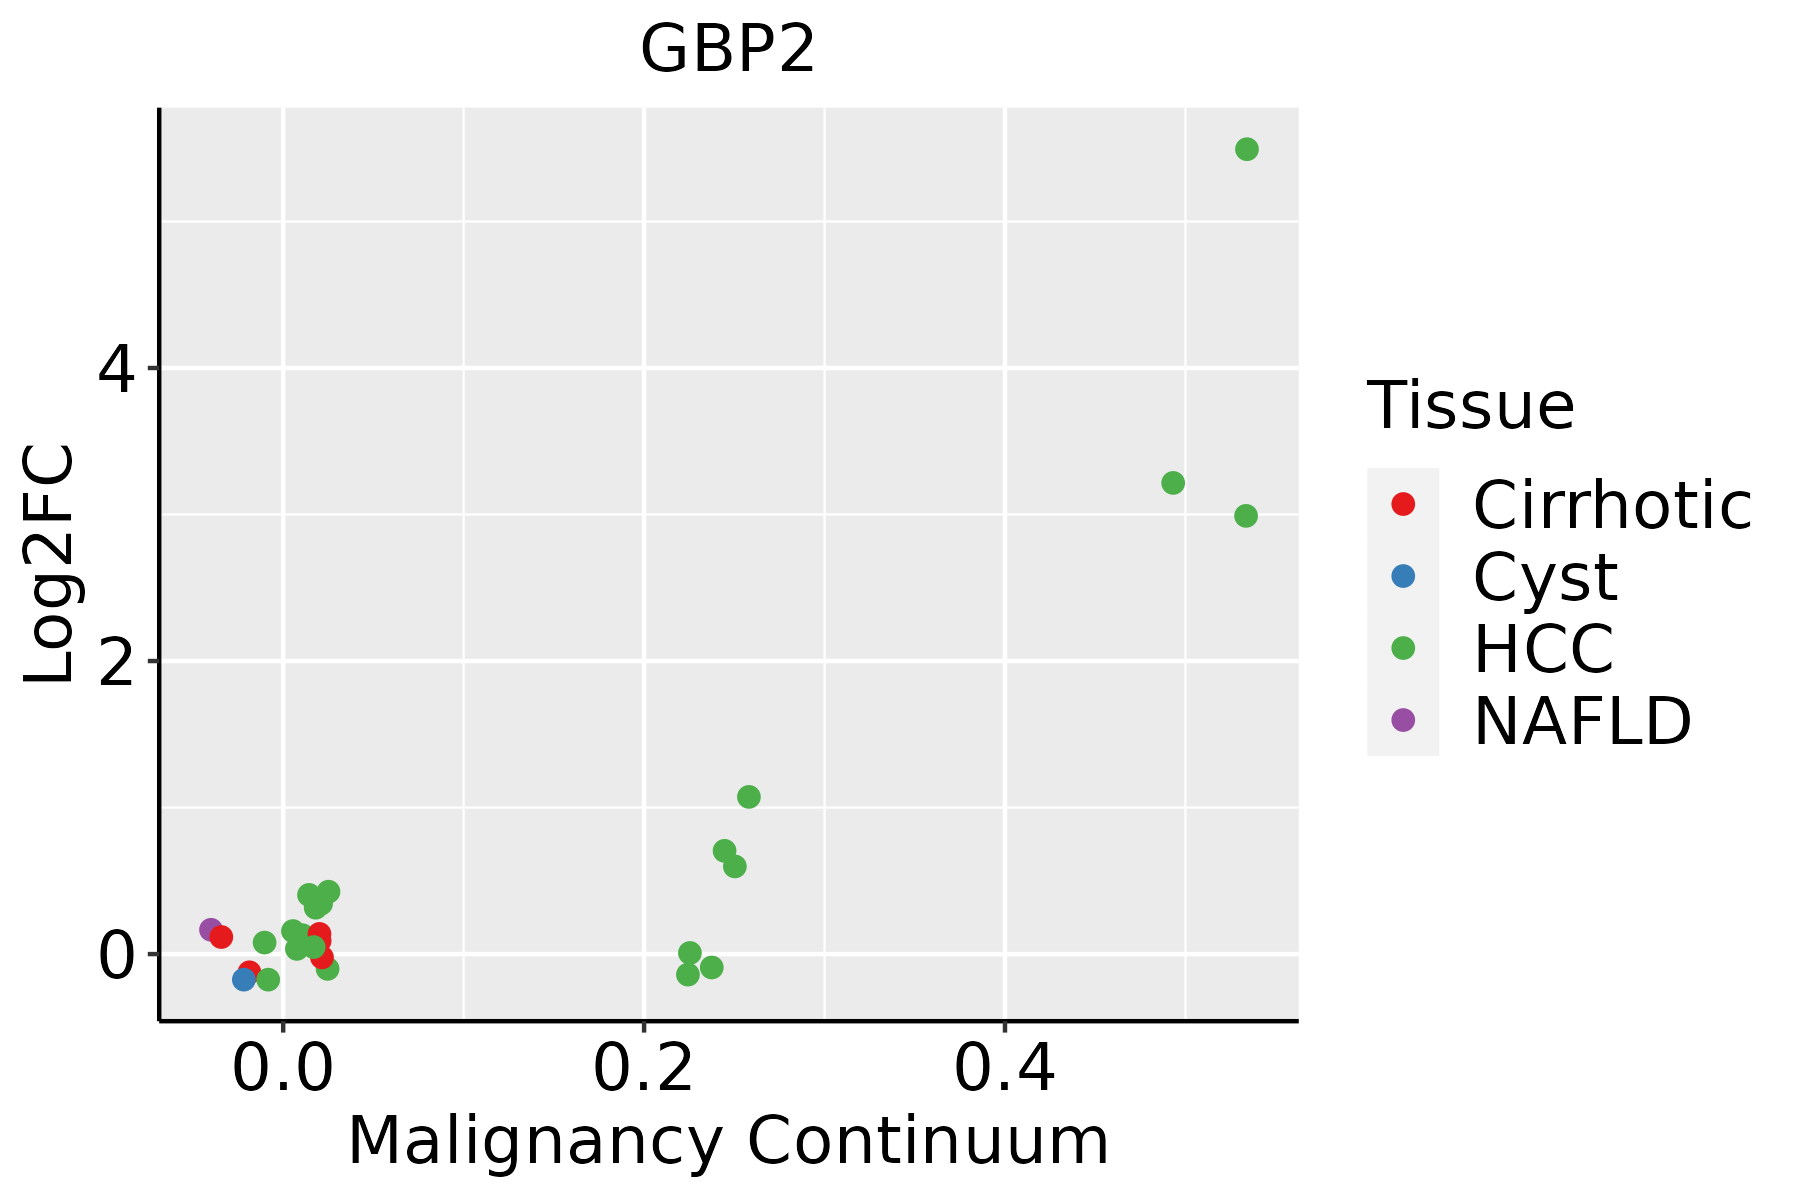 | HCC: Hepatocellular carcinoma |
| NAFLD: Non-alcoholic fatty liver disease |
| Oral Cavity | 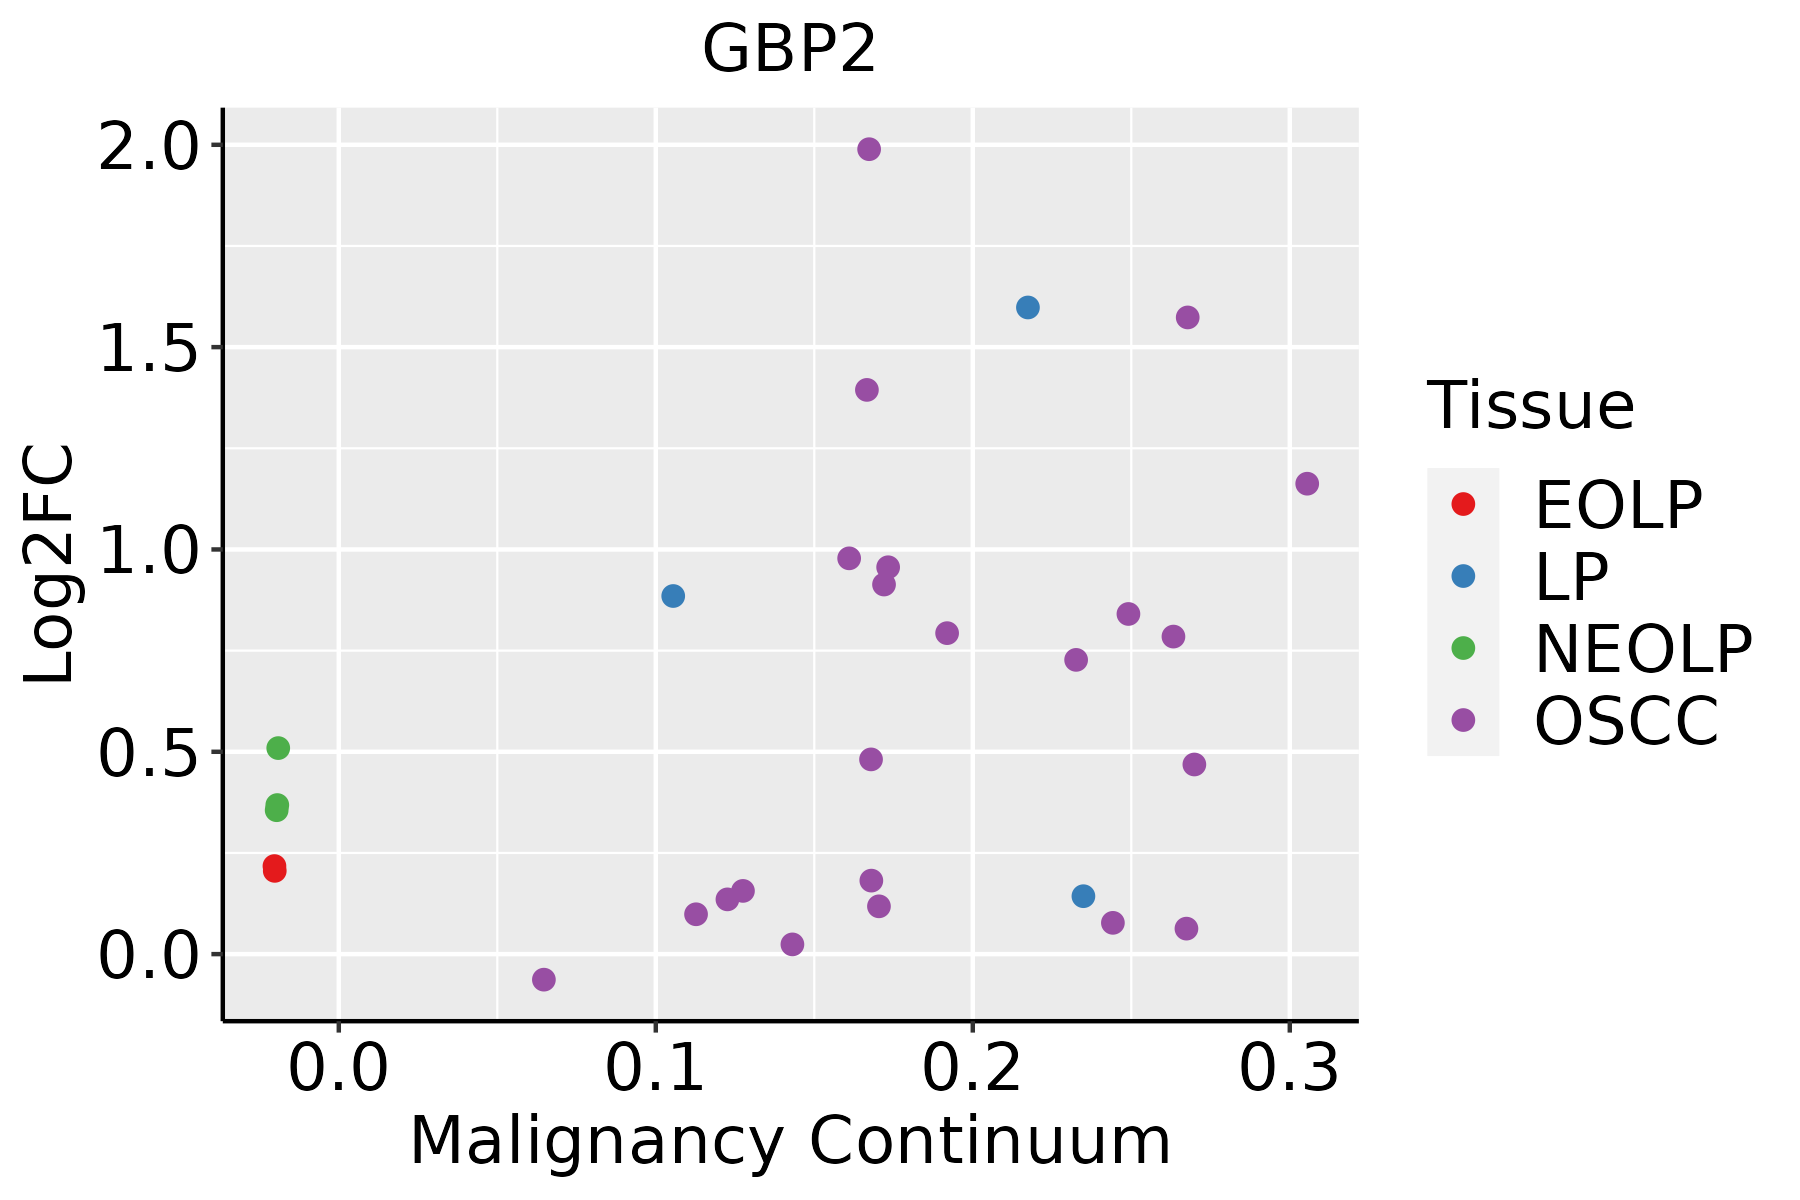 | EOLP: Erosive Oral lichen planus |
| LP: leukoplakia |
| NEOLP: Non-erosive oral lichen planus |
| OSCC: Oral squamous cell carcinoma |
| Skin | 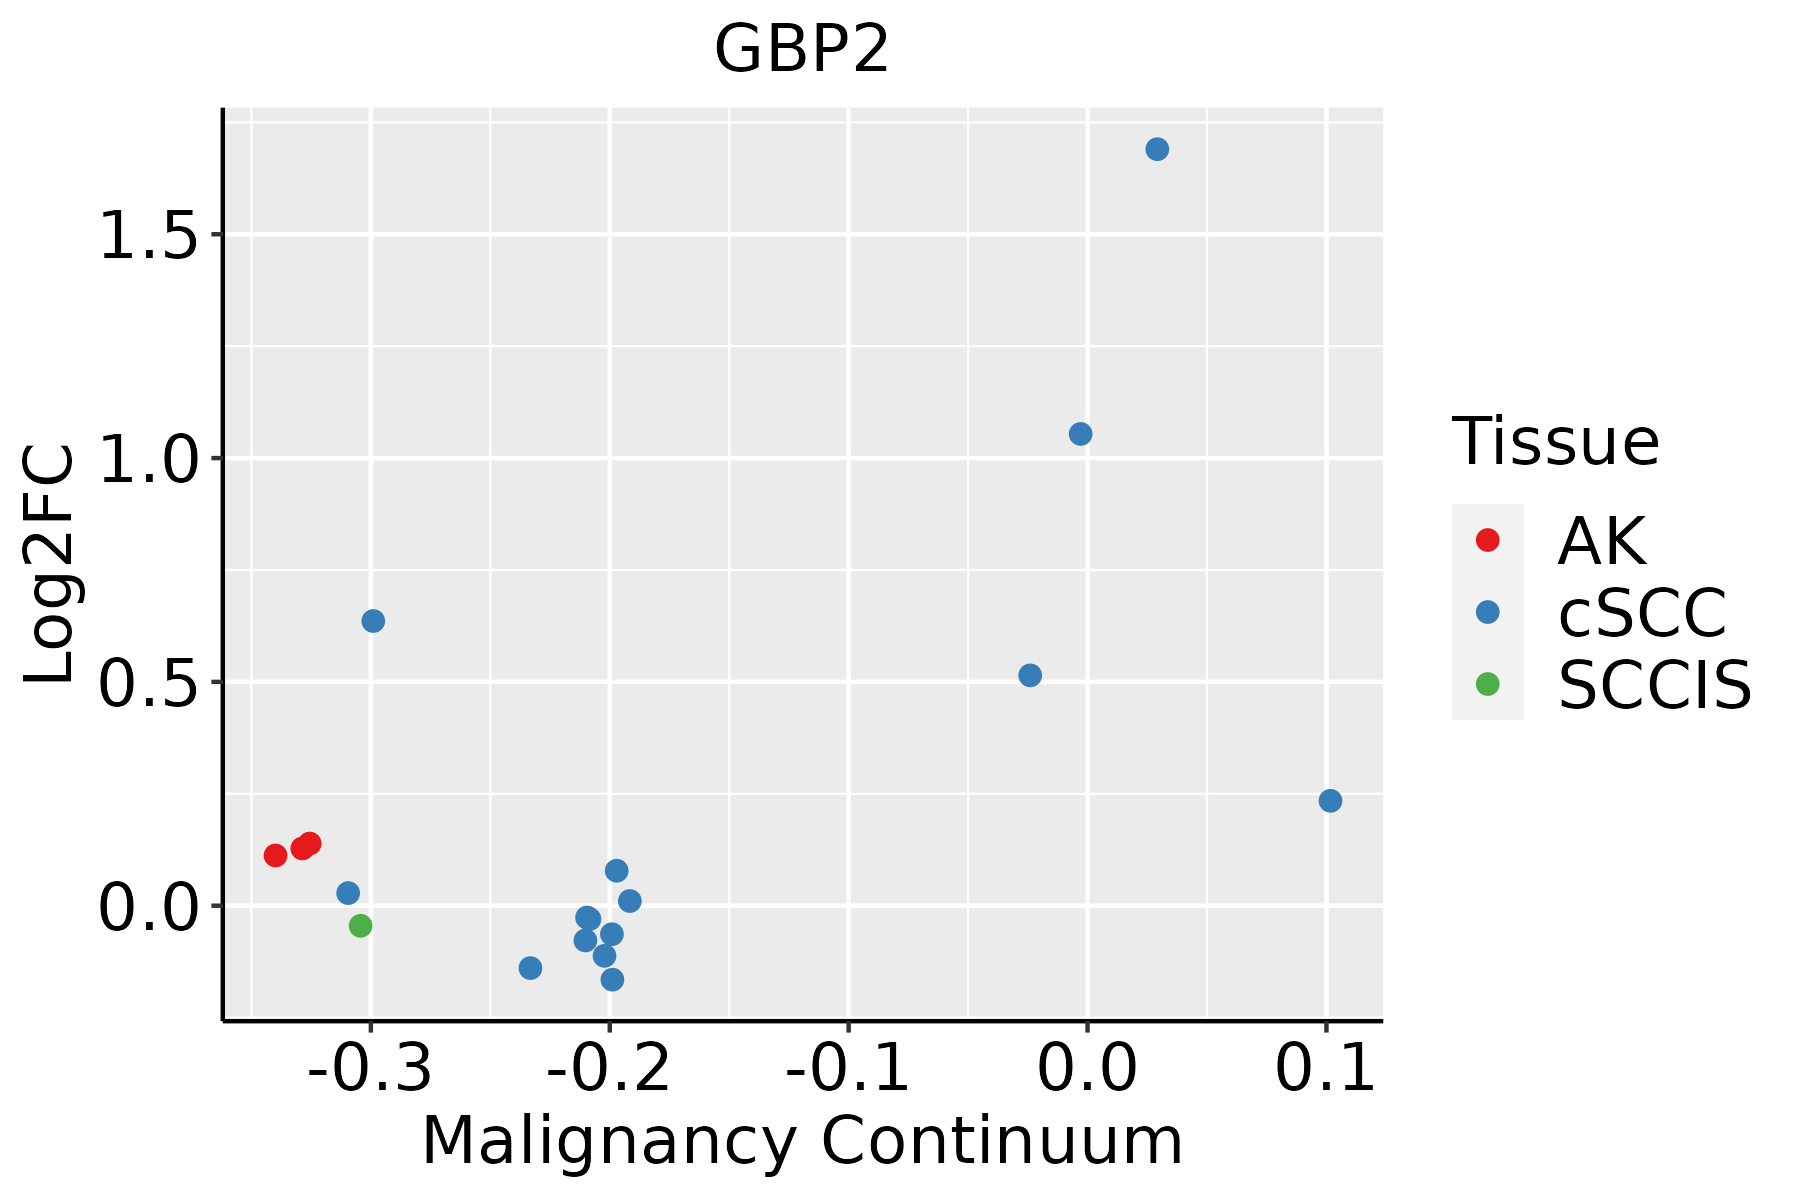 | AK: Actinic keratosis |
| cSCC: Cutaneous squamous cell carcinoma |
| SCCIS:squamous cell carcinoma in situ |
| Thyroid |  | ATC: Anaplastic thyroid cancer |
| HT: Hashimoto's thyroiditis |
| PTC: Papillary thyroid cancer |
| GO ID | Tissue | Disease Stage | Description | Gene Ratio | Bg Ratio | pvalue | p.adjust | Count |
| GO:00713568 | Breast | Precancer | cellular response to tumor necrosis factor | 28/1080 | 229/18723 | 1.42e-04 | 2.45e-03 | 28 |
| GO:00346128 | Breast | Precancer | response to tumor necrosis factor | 29/1080 | 253/18723 | 3.32e-04 | 4.70e-03 | 29 |
| GO:007135613 | Breast | IDC | cellular response to tumor necrosis factor | 35/1434 | 229/18723 | 6.64e-05 | 1.35e-03 | 35 |
| GO:003461213 | Breast | IDC | response to tumor necrosis factor | 36/1434 | 253/18723 | 2.29e-04 | 3.64e-03 | 36 |
| GO:00343414 | Breast | IDC | response to interferon-gamma | 21/1434 | 141/18723 | 2.46e-03 | 2.22e-02 | 21 |
| GO:007135622 | Breast | DCIS | cellular response to tumor necrosis factor | 33/1390 | 229/18723 | 1.84e-04 | 3.00e-03 | 33 |
| GO:003461222 | Breast | DCIS | response to tumor necrosis factor | 33/1390 | 253/18723 | 1.11e-03 | 1.21e-02 | 33 |
| GO:003434111 | Breast | DCIS | response to interferon-gamma | 20/1390 | 141/18723 | 3.83e-03 | 3.05e-02 | 20 |
| GO:003450417 | Esophagus | HGIN | protein localization to nucleus | 84/2587 | 290/18723 | 1.06e-11 | 1.24e-09 | 84 |
| GO:003450418 | Esophagus | ESCC | protein localization to nucleus | 211/8552 | 290/18723 | 4.06e-21 | 6.60e-19 | 211 |
| GO:003461220 | Esophagus | ESCC | response to tumor necrosis factor | 149/8552 | 253/18723 | 1.47e-05 | 1.33e-04 | 149 |
| GO:007135620 | Esophagus | ESCC | cellular response to tumor necrosis factor | 132/8552 | 229/18723 | 1.69e-04 | 1.11e-03 | 132 |
| GO:00343418 | Esophagus | ESCC | response to interferon-gamma | 86/8552 | 141/18723 | 1.74e-04 | 1.14e-03 | 86 |
| GO:00713466 | Esophagus | ESCC | cellular response to interferon-gamma | 69/8552 | 118/18723 | 3.44e-03 | 1.41e-02 | 69 |
| GO:003450421 | Liver | HCC | protein localization to nucleus | 194/7958 | 290/18723 | 2.84e-17 | 2.85e-15 | 194 |
| GO:00343411 | Liver | HCC | response to interferon-gamma | 82/7958 | 141/18723 | 1.25e-04 | 1.03e-03 | 82 |
| GO:00713461 | Liver | HCC | cellular response to interferon-gamma | 70/7958 | 118/18723 | 1.66e-04 | 1.32e-03 | 70 |
| GO:00705551 | Liver | HCC | response to interleukin-1 | 80/7958 | 143/18723 | 7.95e-04 | 4.77e-03 | 80 |
| GO:003461211 | Liver | HCC | response to tumor necrosis factor | 132/7958 | 253/18723 | 1.14e-03 | 6.48e-03 | 132 |
| GO:00713471 | Liver | HCC | cellular response to interleukin-1 | 61/7958 | 113/18723 | 8.98e-03 | 3.46e-02 | 61 |
| Pathway ID | Tissue | Disease Stage | Description | Gene Ratio | Bg Ratio | pvalue | p.adjust | qvalue | Count |
| hsa046219 | Esophagus | HGIN | NOD-like receptor signaling pathway | 45/1383 | 186/8465 | 3.40e-03 | 2.54e-02 | 2.02e-02 | 45 |
| hsa0462114 | Esophagus | HGIN | NOD-like receptor signaling pathway | 45/1383 | 186/8465 | 3.40e-03 | 2.54e-02 | 2.02e-02 | 45 |
| hsa0462122 | Esophagus | ESCC | NOD-like receptor signaling pathway | 116/4205 | 186/8465 | 2.90e-04 | 1.03e-03 | 5.30e-04 | 116 |
| hsa0462132 | Esophagus | ESCC | NOD-like receptor signaling pathway | 116/4205 | 186/8465 | 2.90e-04 | 1.03e-03 | 5.30e-04 | 116 |
| hsa046218 | Oral cavity | OSCC | NOD-like receptor signaling pathway | 108/3704 | 186/8465 | 5.13e-05 | 2.07e-04 | 1.05e-04 | 108 |
| hsa0462113 | Oral cavity | OSCC | NOD-like receptor signaling pathway | 108/3704 | 186/8465 | 5.13e-05 | 2.07e-04 | 1.05e-04 | 108 |
| hsa046214 | Oral cavity | EOLP | NOD-like receptor signaling pathway | 48/1218 | 186/8465 | 2.51e-05 | 1.31e-04 | 7.70e-05 | 48 |
| hsa046215 | Oral cavity | EOLP | NOD-like receptor signaling pathway | 48/1218 | 186/8465 | 2.51e-05 | 1.31e-04 | 7.70e-05 | 48 |
| hsa046216 | Oral cavity | NEOLP | NOD-like receptor signaling pathway | 39/1112 | 186/8465 | 1.79e-03 | 7.91e-03 | 4.98e-03 | 39 |
| hsa046217 | Oral cavity | NEOLP | NOD-like receptor signaling pathway | 39/1112 | 186/8465 | 1.79e-03 | 7.91e-03 | 4.98e-03 | 39 |
| Hugo Symbol | Variant Class | Variant Classification | dbSNP RS | HGVSc | HGVSp | HGVSp Short | SWISSPROT | BIOTYPE | SIFT | PolyPhen | Tumor Sample Barcode | Tissue | Histology | Sex | Age | Stage | Therapy Types | Drugs | Outcome |
| GBP2 | insertion | Nonsense_Mutation | novel | c.15_16insCATTAATGGGCTCTTTACATTGACTTTGGAGGATTACAGTCAACTG | p.Asn6HisfsTer2 | p.N6Hfs*2 | P32456 | protein_coding | | | TCGA-A8-A097-01 | Breast | breast invasive carcinoma | Female | >=65 | I/II | Hormone Therapy | tamoxiphen | SD |
| GBP2 | insertion | Frame_Shift_Ins | novel | c.750_751insGG | p.Leu251GlyfsTer2 | p.L251Gfs*2 | P32456 | protein_coding | | | TCGA-AN-A0FX-01 | Breast | breast invasive carcinoma | Female | <65 | I/II | Unknown | Unknown | SD |
| GBP2 | insertion | Nonsense_Mutation | novel | c.748_749insTATAGTATCATCTCATATTCCTTGCA | p.Gln250LeufsTer2 | p.Q250Lfs*2 | P32456 | protein_coding | | | TCGA-AN-A0FX-01 | Breast | breast invasive carcinoma | Female | <65 | I/II | Unknown | Unknown | SD |
| GBP2 | insertion | Frame_Shift_Ins | novel | c.3_4insT | p.Ala2CysfsTer14 | p.A2Cfs*14 | P32456 | protein_coding | | | TCGA-BH-A0HY-01 | Breast | breast invasive carcinoma | Female | <65 | I/II | Hormone Therapy | taxotere | CR |
| GBP2 | insertion | Frame_Shift_Ins | novel | c.2_3insTAATGGGCTCTTTACATTGACTTTGGAGGATTACA | p.Met1? | p.M1? | P32456 | protein_coding | | | TCGA-BH-A0HY-01 | Breast | breast invasive carcinoma | Female | <65 | I/II | Hormone Therapy | taxotere | CR |
| GBP2 | deletion | Frame_Shift_Del | novel | c.188delA | p.Asn63ThrfsTer5 | p.N63Tfs*5 | P32456 | protein_coding | | | TCGA-D8-A27V-01 | Breast | breast invasive carcinoma | Female | <65 | I/II | Hormone Therapy | tamoxiphen | SD |
| GBP2 | SNV | Missense_Mutation | novel | c.568N>C | p.Asp190His | p.D190H | P32456 | protein_coding | deleterious(0.05) | probably_damaging(0.939) | TCGA-C5-A2LZ-01 | Cervix | cervical & endocervical cancer | Female | >=65 | III/IV | Unknown | Unknown | PD |
| GBP2 | SNV | Missense_Mutation | novel | c.199N>G | p.Leu67Val | p.L67V | P32456 | protein_coding | tolerated(0.16) | benign(0.028) | TCGA-MA-AA41-01 | Cervix | cervical & endocervical cancer | Female | <65 | I/II | Unknown | Unknown | SD |
| GBP2 | SNV | Missense_Mutation | novel | c.1174N>A | p.Asp392Asn | p.D392N | P32456 | protein_coding | tolerated(0.18) | benign(0.071) | TCGA-VS-A952-01 | Cervix | cervical & endocervical cancer | Female | >=65 | I/II | Unknown | Unknown | SD |
| GBP2 | SNV | Missense_Mutation | novel | c.1565N>G | p.Tyr522Cys | p.Y522C | P32456 | protein_coding | deleterious(0) | probably_damaging(0.985) | TCGA-AA-3984-01 | Colorectum | colon adenocarcinoma | Female | <65 | I/II | Unknown | Unknown | SD |


