
|
|||||
|
 | |
| |
| |
| |
| |
| |
|
Gene: GBF1 |
Gene summary for GBF1 |
| Gene information | Species | Human | Gene symbol | GBF1 | Gene ID | 8729 |
| Gene name | golgi brefeldin A resistant guanine nucleotide exchange factor 1 | |
| Gene Alias | ARF1GEF | |
| Cytomap | 10q24.32 | |
| Gene Type | protein-coding | GO ID | GO:0000278 | UniProtAcc | Q92538 |
Top |
Malignant transformation analysis |
| Identification of the aberrant gene expression in precancerous and cancerous lesions by comparing the gene expression of stem-like cells in diseased tissues with normal stem cells |
| Entrez ID | Symbol | Replicates | Species | Organ | Tissue | Adj P-value | Log2FC | Malignancy |
| 8729 | GBF1 | CCI_1 | Human | Cervix | CC | 9.98e-05 | 6.29e-01 | 0.528 |
| 8729 | GBF1 | CCI_2 | Human | Cervix | CC | 9.69e-09 | 1.03e+00 | 0.5249 |
| 8729 | GBF1 | HTA11_3410_2000001011 | Human | Colorectum | AD | 2.14e-16 | -4.77e-01 | 0.0155 |
| 8729 | GBF1 | HTA11_347_2000001011 | Human | Colorectum | AD | 5.55e-11 | 6.56e-01 | -0.1954 |
| 8729 | GBF1 | HTA11_99999970781_79442 | Human | Colorectum | MSS | 4.55e-13 | -4.03e-01 | 0.294 |
| 8729 | GBF1 | HTA11_99999974143_84620 | Human | Colorectum | MSS | 8.55e-03 | -2.99e-01 | 0.3005 |
| 8729 | GBF1 | A002-C-010 | Human | Colorectum | FAP | 3.76e-02 | -3.19e-01 | 0.242 |
| 8729 | GBF1 | A001-C-207 | Human | Colorectum | FAP | 4.91e-08 | -4.81e-01 | 0.1278 |
| 8729 | GBF1 | A015-C-203 | Human | Colorectum | FAP | 2.96e-34 | -6.01e-01 | -0.1294 |
| 8729 | GBF1 | A015-C-204 | Human | Colorectum | FAP | 5.80e-07 | -4.01e-01 | -0.0228 |
| 8729 | GBF1 | A014-C-040 | Human | Colorectum | FAP | 1.21e-06 | -5.86e-01 | -0.1184 |
| 8729 | GBF1 | A002-C-201 | Human | Colorectum | FAP | 2.29e-15 | -5.08e-01 | 0.0324 |
| 8729 | GBF1 | A002-C-203 | Human | Colorectum | FAP | 2.77e-08 | -3.82e-01 | 0.2786 |
| 8729 | GBF1 | A001-C-119 | Human | Colorectum | FAP | 6.85e-10 | -5.42e-01 | -0.1557 |
| 8729 | GBF1 | A001-C-108 | Human | Colorectum | FAP | 4.08e-21 | -5.62e-01 | -0.0272 |
| 8729 | GBF1 | A002-C-205 | Human | Colorectum | FAP | 1.31e-21 | -4.83e-01 | -0.1236 |
| 8729 | GBF1 | A001-C-104 | Human | Colorectum | FAP | 3.33e-11 | -4.04e-01 | 0.0184 |
| 8729 | GBF1 | A015-C-005 | Human | Colorectum | FAP | 3.83e-04 | -3.22e-01 | -0.0336 |
| 8729 | GBF1 | A015-C-006 | Human | Colorectum | FAP | 1.17e-20 | -7.26e-01 | -0.0994 |
| 8729 | GBF1 | A015-C-106 | Human | Colorectum | FAP | 7.34e-15 | -4.11e-01 | -0.0511 |
| Page: 1 2 3 4 5 6 7 8 9 |
| Tissue | Expression Dynamics | Abbreviation |
| Cervix |  | CC: Cervix cancer |
| HSIL_HPV: HPV-infected high-grade squamous intraepithelial lesions | ||
| N_HPV: HPV-infected normal cervix | ||
| Colorectum (GSE201348) |  | FAP: Familial adenomatous polyposis |
| CRC: Colorectal cancer | ||
| Colorectum (HTA11) |  | AD: Adenomas |
| SER: Sessile serrated lesions | ||
| MSI-H: Microsatellite-high colorectal cancer | ||
| MSS: Microsatellite stable colorectal cancer | ||
| Endometrium | 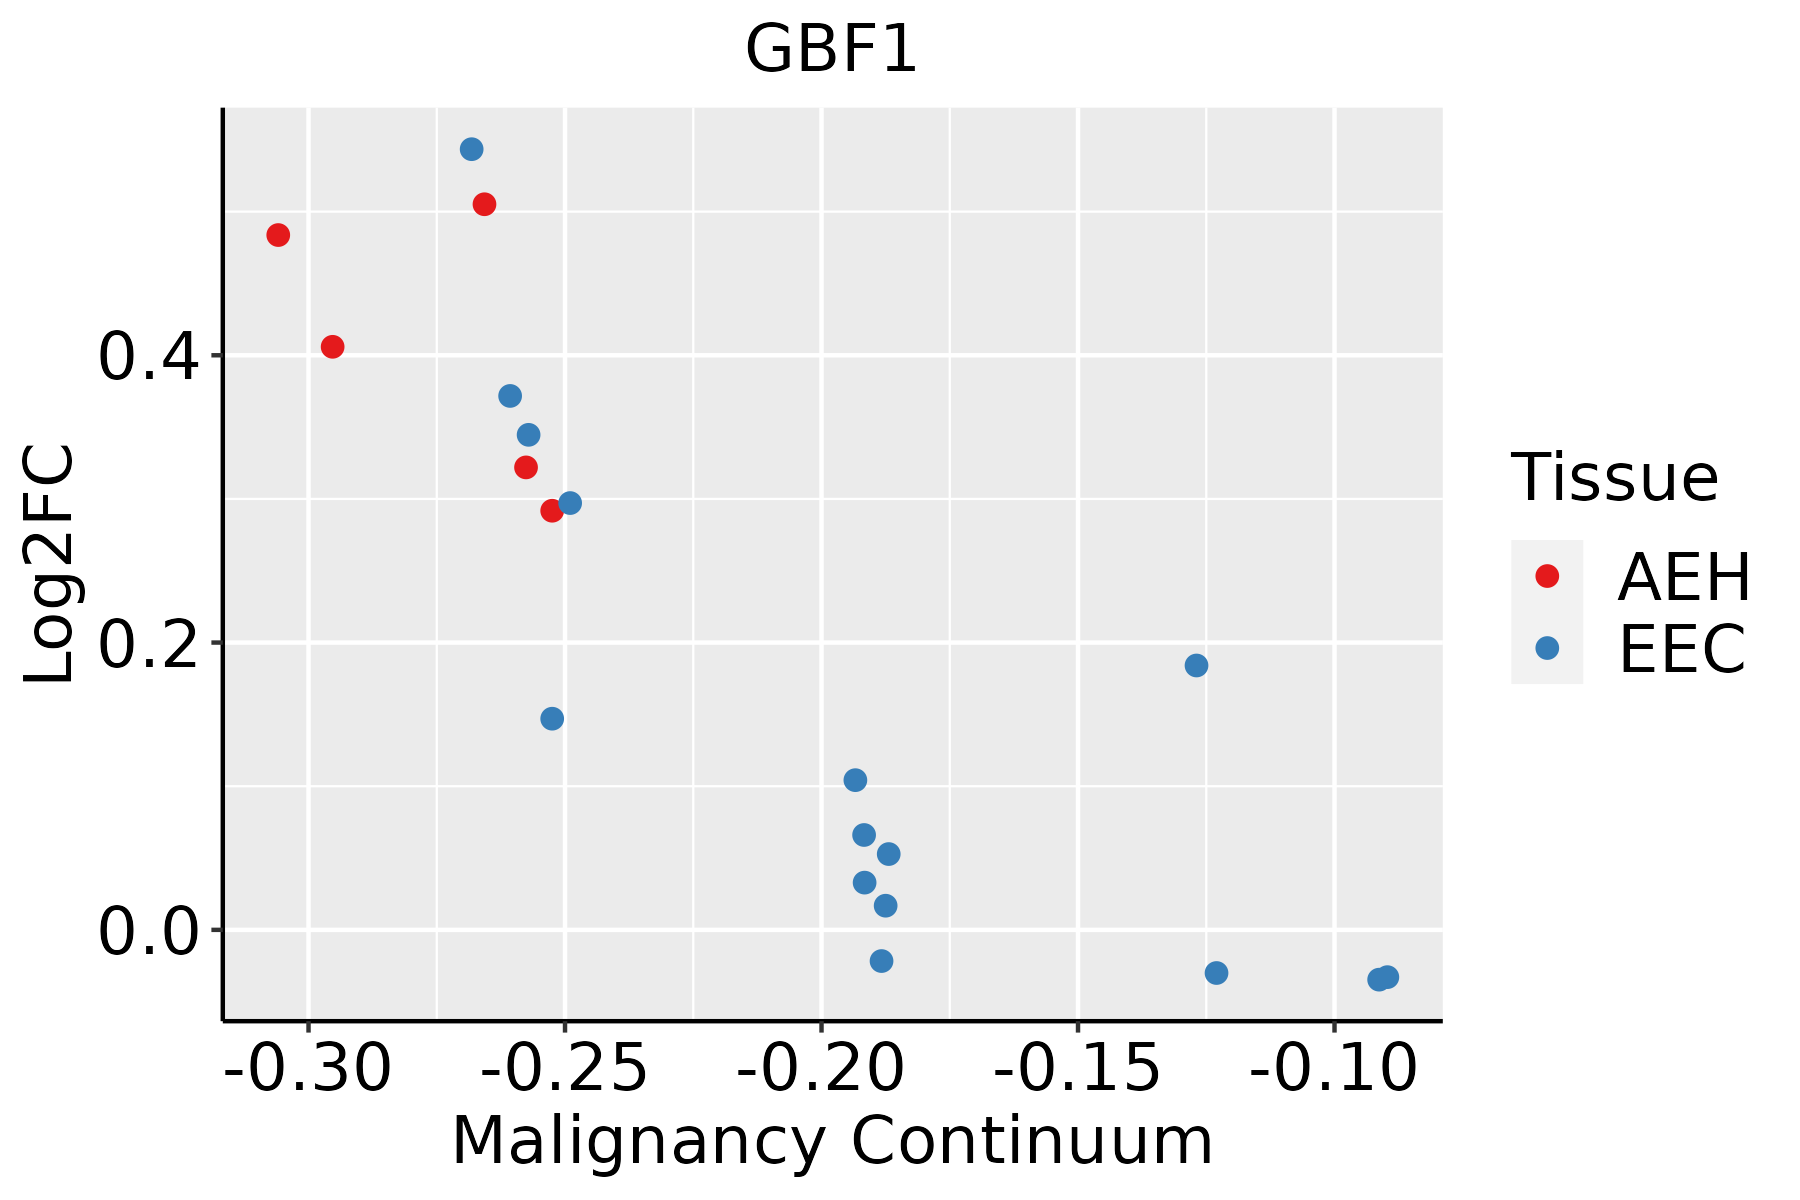 | AEH: Atypical endometrial hyperplasia |
| EEC: Endometrioid Cancer | ||
| Esophagus | 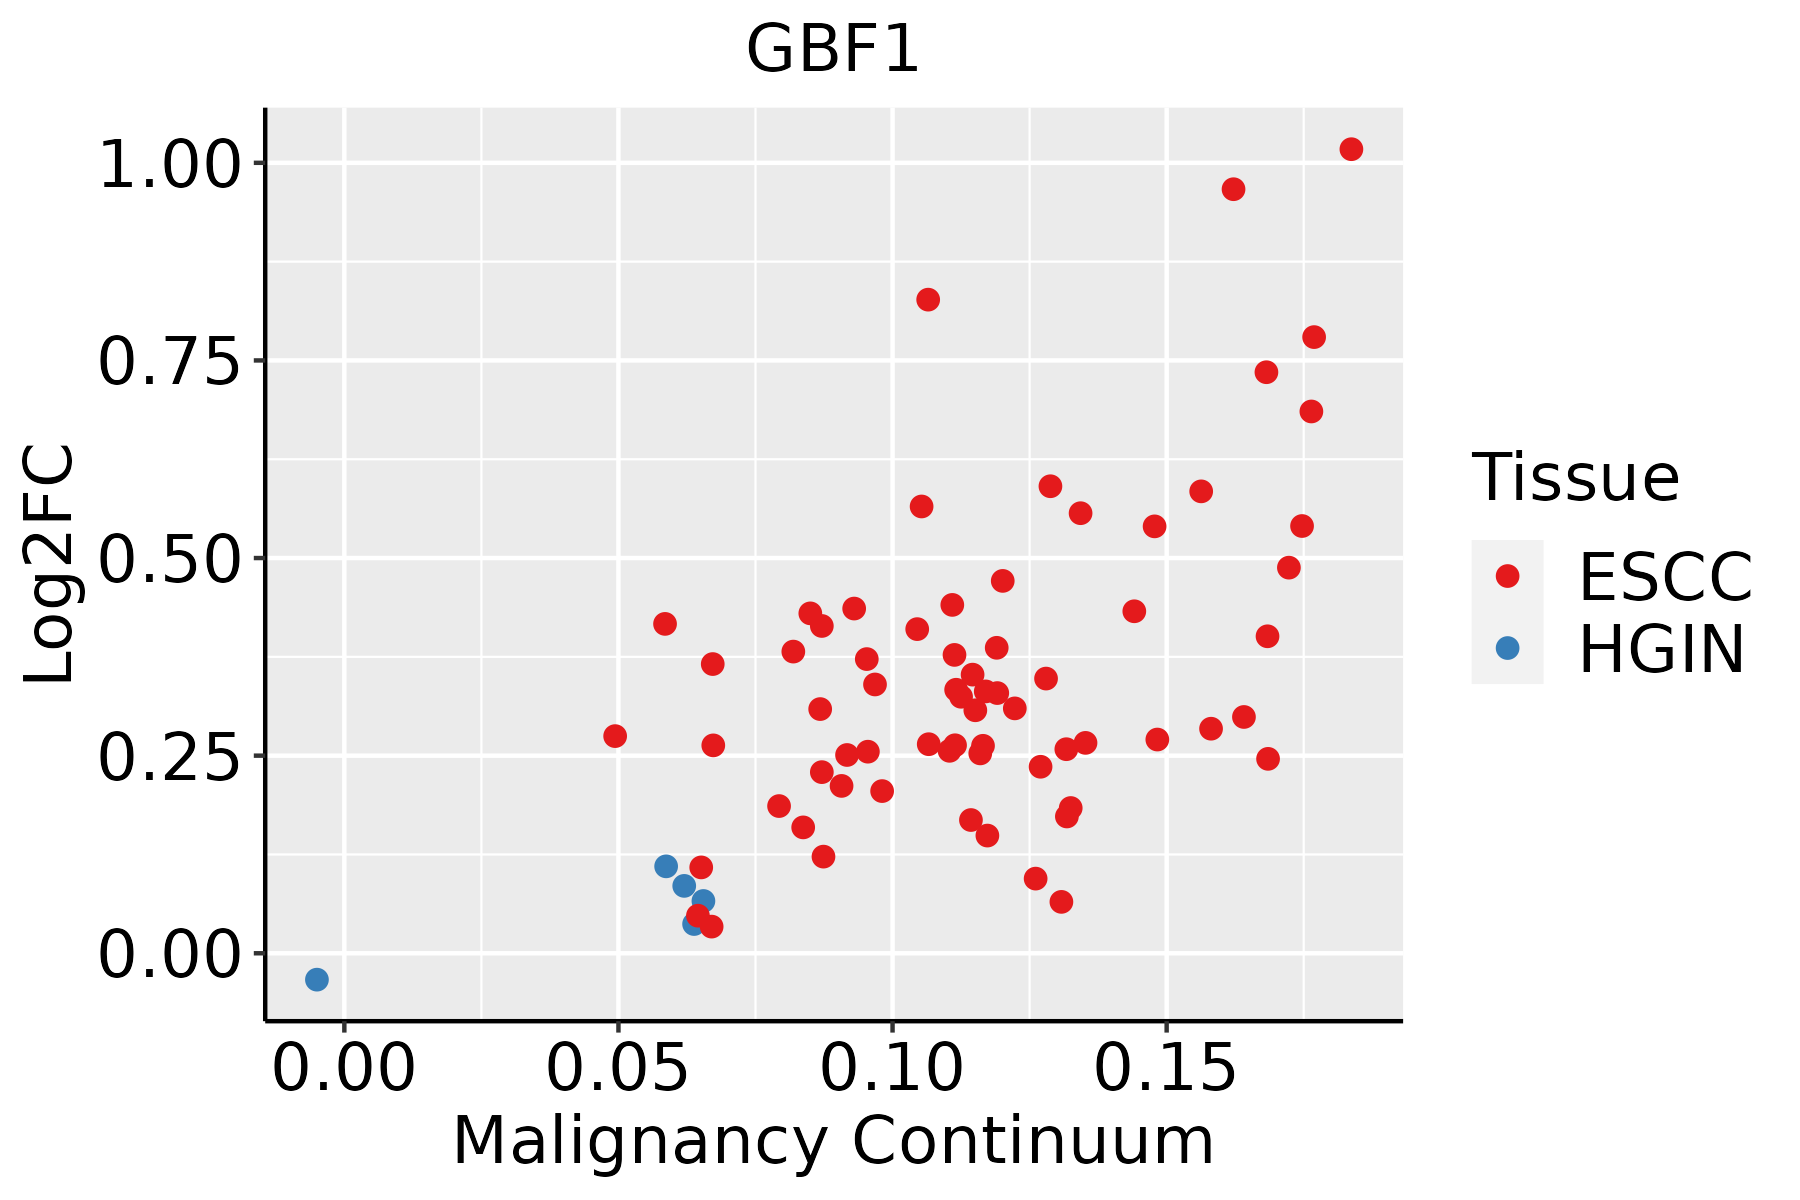 | ESCC: Esophageal squamous cell carcinoma |
| HGIN: High-grade intraepithelial neoplasias | ||
| LGIN: Low-grade intraepithelial neoplasias | ||
| Liver | 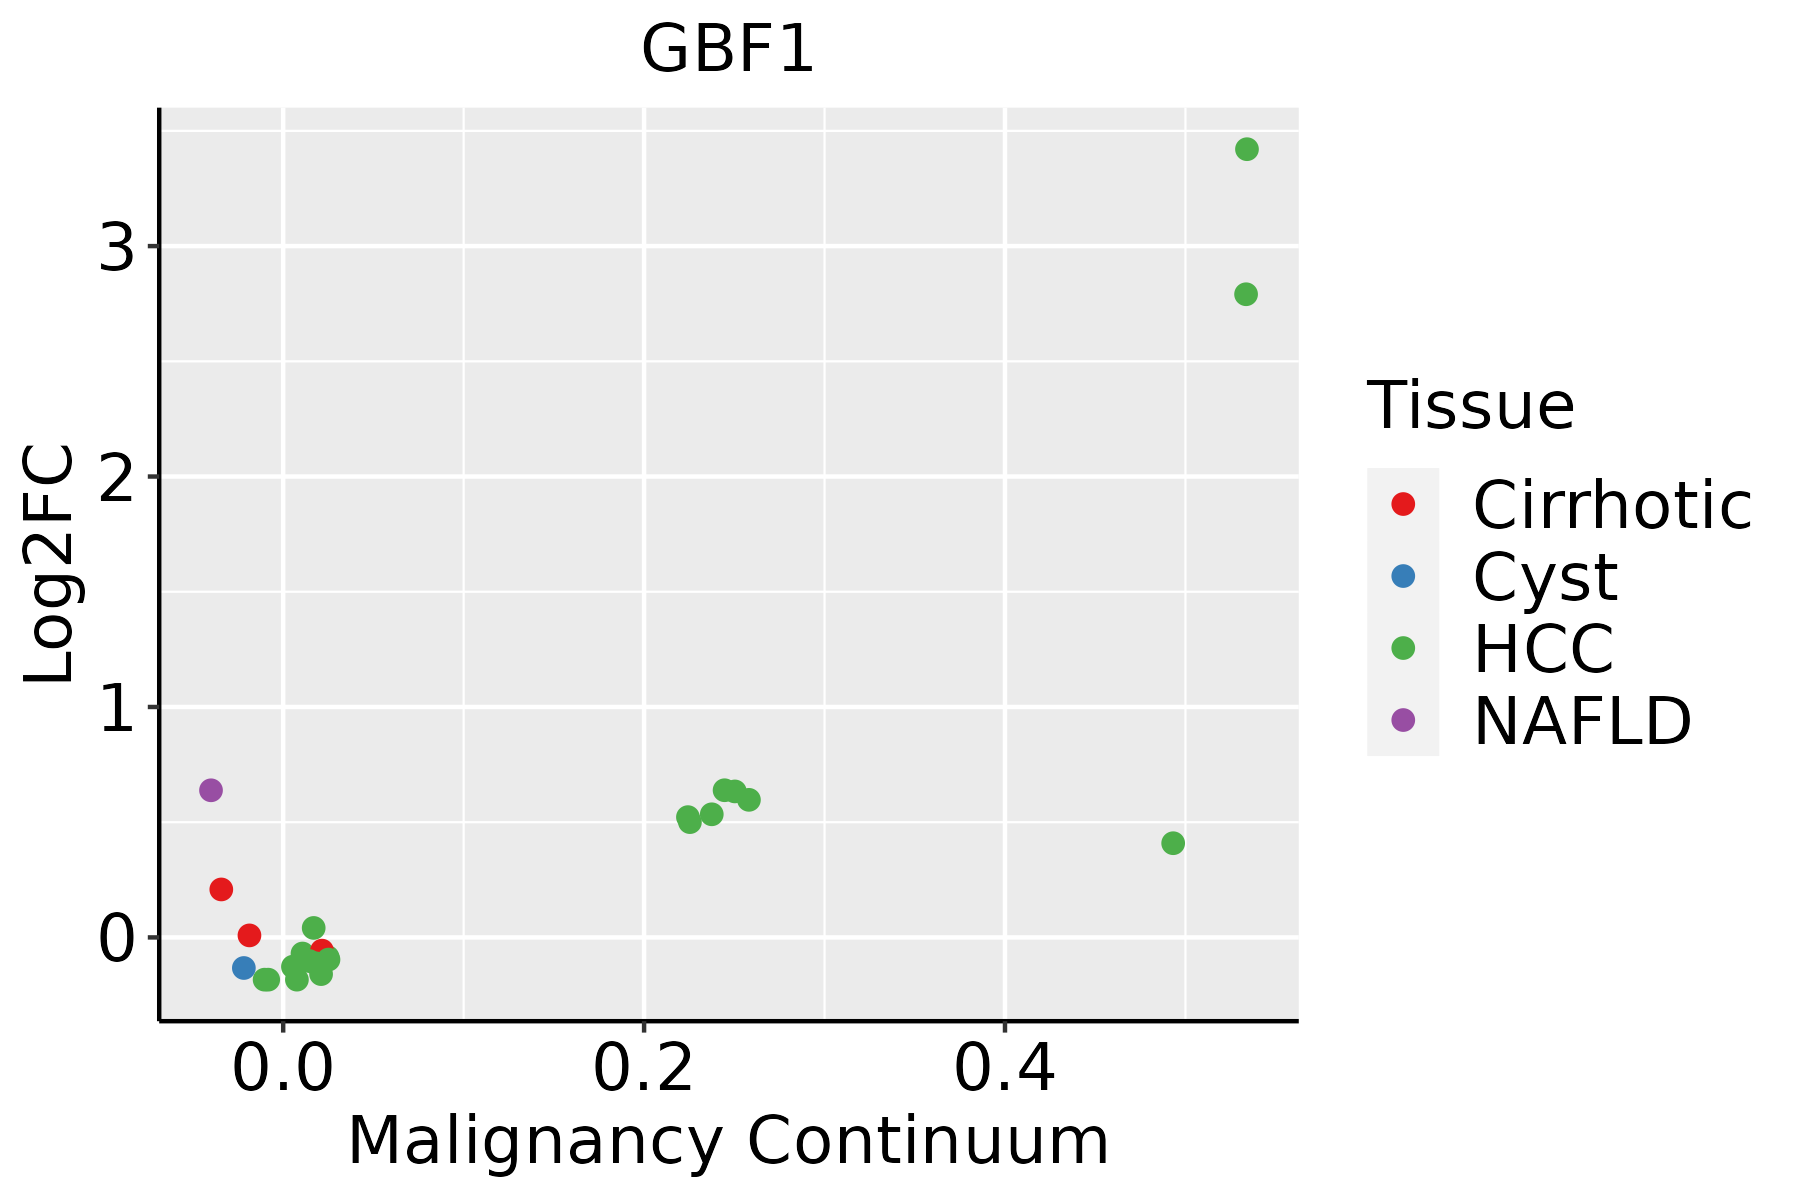 | HCC: Hepatocellular carcinoma |
| NAFLD: Non-alcoholic fatty liver disease | ||
| Lung | 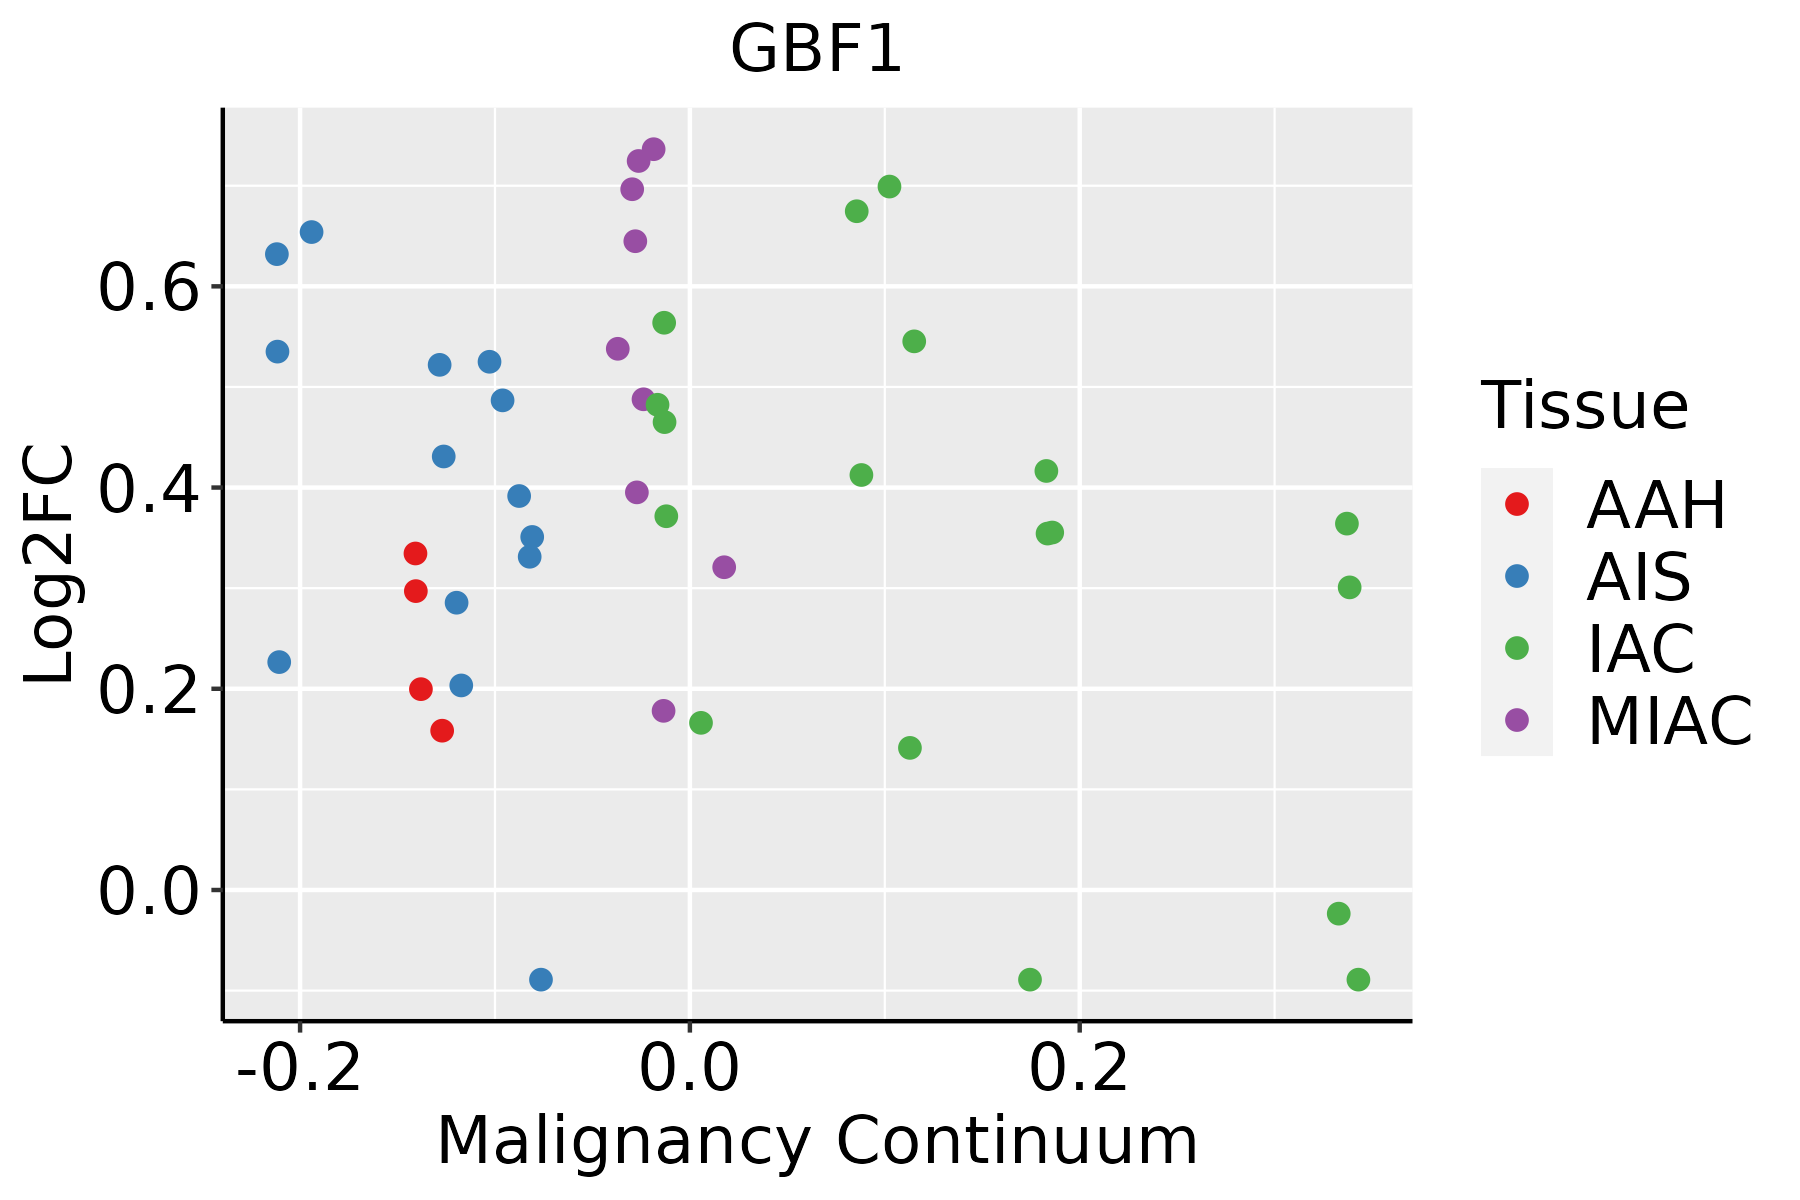 | AAH: Atypical adenomatous hyperplasia |
| AIS: Adenocarcinoma in situ | ||
| IAC: Invasive lung adenocarcinoma | ||
| MIA: Minimally invasive adenocarcinoma | ||
| Oral Cavity |  | EOLP: Erosive Oral lichen planus |
| LP: leukoplakia | ||
| NEOLP: Non-erosive oral lichen planus | ||
| OSCC: Oral squamous cell carcinoma | ||
| Thyroid |  | ATC: Anaplastic thyroid cancer |
| HT: Hashimoto's thyroiditis | ||
| PTC: Papillary thyroid cancer |
| ∗log2FC in expression of this searched gene in stem-like cells from each diseased tissue sample relative to stem-like cells in normal samples in each tissue plotted against the malignancy continuum. Samples are colored based on if they are from different disease stage. |
Top |
Malignant transformation related pathway analysis |
| Find out the enriched GO biological processes and KEGG pathways involved in transition from healthy to precancer to cancer |
| Tissue | Disease Stage | Enriched GO biological Processes |
| Colorectum | AD |  |
| Colorectum | SER |  |
| Colorectum | MSS |  |
| Colorectum | MSI-H |  |
| Colorectum | FAP |  |
| ∗Top 15 enriched GO BP terms are showed in the bar plot of each disease state in each tissue. Each row represents a significant GO biological process which is colored according to the -log10(p.adjust). |
| Page: 1 2 3 4 5 6 7 8 9 |
| GO ID | Tissue | Disease Stage | Description | Gene Ratio | Bg Ratio | pvalue | p.adjust | Count |
| GO:00071639 | Cervix | CC | establishment or maintenance of cell polarity | 63/2311 | 218/18723 | 4.25e-11 | 8.76e-09 | 63 |
| GO:00510566 | Cervix | CC | regulation of small GTPase mediated signal transduction | 75/2311 | 302/18723 | 1.54e-09 | 1.74e-07 | 75 |
| GO:00072656 | Cervix | CC | Ras protein signal transduction | 79/2311 | 337/18723 | 9.49e-09 | 7.77e-07 | 79 |
| GO:00603267 | Cervix | CC | cell chemotaxis | 73/2311 | 310/18723 | 2.82e-08 | 1.96e-06 | 73 |
| GO:00300108 | Cervix | CC | establishment of cell polarity | 42/2311 | 143/18723 | 4.30e-08 | 2.62e-06 | 42 |
| GO:00975298 | Cervix | CC | myeloid leukocyte migration | 56/2311 | 220/18723 | 7.21e-08 | 4.15e-06 | 56 |
| GO:00305957 | Cervix | CC | leukocyte chemotaxis | 57/2311 | 230/18723 | 1.48e-07 | 7.07e-06 | 57 |
| GO:00716218 | Cervix | CC | granulocyte chemotaxis | 37/2311 | 125/18723 | 2.16e-07 | 9.56e-06 | 37 |
| GO:00509007 | Cervix | CC | leukocyte migration | 78/2311 | 369/18723 | 1.09e-06 | 3.80e-05 | 78 |
| GO:00975308 | Cervix | CC | granulocyte migration | 39/2311 | 148/18723 | 2.67e-06 | 7.87e-05 | 39 |
| GO:00305938 | Cervix | CC | neutrophil chemotaxis | 30/2311 | 103/18723 | 4.24e-06 | 1.09e-04 | 30 |
| GO:00073466 | Cervix | CC | regulation of mitotic cell cycle | 88/2311 | 457/18723 | 1.26e-05 | 2.60e-04 | 88 |
| GO:00465785 | Cervix | CC | regulation of Ras protein signal transduction | 44/2311 | 189/18723 | 2.05e-05 | 3.73e-04 | 44 |
| GO:00096158 | Cervix | CC | response to virus | 73/2311 | 367/18723 | 2.22e-05 | 3.95e-04 | 73 |
| GO:19902666 | Cervix | CC | neutrophil migration | 32/2311 | 122/18723 | 2.25e-05 | 4.00e-04 | 32 |
| GO:000690010 | Cervix | CC | vesicle budding from membrane | 20/2311 | 61/18723 | 2.50e-05 | 4.28e-04 | 20 |
| GO:00516567 | Cervix | CC | establishment of organelle localization | 76/2311 | 390/18723 | 3.17e-05 | 5.21e-04 | 76 |
| GO:00068927 | Cervix | CC | post-Golgi vesicle-mediated transport | 28/2311 | 104/18723 | 4.31e-05 | 6.61e-04 | 28 |
| GO:002241110 | Cervix | CC | cellular component disassembly | 83/2311 | 443/18723 | 6.04e-05 | 8.68e-04 | 83 |
| GO:00161977 | Cervix | CC | endosomal transport | 48/2311 | 230/18723 | 1.65e-04 | 1.97e-03 | 48 |
| Page: 1 2 3 4 5 6 7 8 9 10 11 12 13 14 15 16 17 18 19 20 21 22 23 24 25 |
| Pathway ID | Tissue | Disease Stage | Description | Gene Ratio | Bg Ratio | pvalue | p.adjust | qvalue | Count |
| hsa0414418 | Cervix | CC | Endocytosis | 64/1267 | 251/8465 | 6.97e-06 | 6.10e-05 | 3.61e-05 | 64 |
| hsa0414419 | Cervix | CC | Endocytosis | 64/1267 | 251/8465 | 6.97e-06 | 6.10e-05 | 3.61e-05 | 64 |
| hsa04144 | Colorectum | AD | Endocytosis | 111/2092 | 251/8465 | 5.95e-12 | 1.42e-10 | 9.08e-11 | 111 |
| hsa041441 | Colorectum | AD | Endocytosis | 111/2092 | 251/8465 | 5.95e-12 | 1.42e-10 | 9.08e-11 | 111 |
| hsa041444 | Colorectum | MSS | Endocytosis | 102/1875 | 251/8465 | 1.85e-11 | 4.43e-10 | 2.71e-10 | 102 |
| hsa041445 | Colorectum | MSS | Endocytosis | 102/1875 | 251/8465 | 1.85e-11 | 4.43e-10 | 2.71e-10 | 102 |
| hsa041446 | Colorectum | FAP | Endocytosis | 78/1404 | 251/8465 | 6.20e-09 | 2.96e-07 | 1.80e-07 | 78 |
| hsa041447 | Colorectum | FAP | Endocytosis | 78/1404 | 251/8465 | 6.20e-09 | 2.96e-07 | 1.80e-07 | 78 |
| hsa041448 | Colorectum | CRC | Endocytosis | 65/1091 | 251/8465 | 1.27e-08 | 1.06e-06 | 7.19e-07 | 65 |
| hsa041449 | Colorectum | CRC | Endocytosis | 65/1091 | 251/8465 | 1.27e-08 | 1.06e-06 | 7.19e-07 | 65 |
| hsa0414420 | Endometrium | AEH | Endocytosis | 56/1197 | 251/8465 | 2.58e-04 | 2.15e-03 | 1.57e-03 | 56 |
| hsa04144110 | Endometrium | AEH | Endocytosis | 56/1197 | 251/8465 | 2.58e-04 | 2.15e-03 | 1.57e-03 | 56 |
| hsa0414424 | Endometrium | EEC | Endocytosis | 57/1237 | 251/8465 | 3.34e-04 | 2.82e-03 | 2.10e-03 | 57 |
| hsa0414434 | Endometrium | EEC | Endocytosis | 57/1237 | 251/8465 | 3.34e-04 | 2.82e-03 | 2.10e-03 | 57 |
| hsa04144210 | Esophagus | ESCC | Endocytosis | 186/4205 | 251/8465 | 9.74e-16 | 4.66e-14 | 2.39e-14 | 186 |
| hsa0414437 | Esophagus | ESCC | Endocytosis | 186/4205 | 251/8465 | 9.74e-16 | 4.66e-14 | 2.39e-14 | 186 |
| hsa0414422 | Liver | HCC | Endocytosis | 178/4020 | 251/8465 | 2.03e-14 | 5.22e-13 | 2.91e-13 | 178 |
| hsa0414432 | Liver | HCC | Endocytosis | 178/4020 | 251/8465 | 2.03e-14 | 5.22e-13 | 2.91e-13 | 178 |
| hsa0414414 | Lung | IAC | Endocytosis | 51/1053 | 251/8465 | 2.25e-04 | 2.54e-03 | 1.68e-03 | 51 |
| hsa0414415 | Lung | IAC | Endocytosis | 51/1053 | 251/8465 | 2.25e-04 | 2.54e-03 | 1.68e-03 | 51 |
| Page: 1 2 |
Top |
Cell-cell communication analysis |
| Identification of potential cell-cell interactions between two cell types and their ligand-receptor pairs for different disease states |
| Ligand | Receptor | LRpair | Pathway | Tissue | Disease Stage |
| Page: 1 |
Top |
Single-cell gene regulatory network inference analysis |
| Find out the significant the regulons (TFs) and the target genes of each regulon across cell types for different disease states |
| TF | Cell Type | Tissue | Disease Stage | Target Gene | RSS | Regulon Activity |
| ∗The dot plots of a searched regulon are shown for all cell subpopulations in each disease state of each tissue based on the regulon specific score inferred using pySCENIC and by calculating the average expression. |
| Page: 1 |
Top |
Somatic mutation of malignant transformation related genes |
| Annotation of somatic variants for genes involved in malignant transformation |
| Hugo Symbol | Variant Class | Variant Classification | dbSNP RS | HGVSc | HGVSp | HGVSp Short | SWISSPROT | BIOTYPE | SIFT | PolyPhen | Tumor Sample Barcode | Tissue | Histology | Sex | Age | Stage | Therapy Types | Drugs | Outcome |
| GBF1 | SNV | Missense_Mutation | novel | c.4940N>A | p.Ile1647Asn | p.I1647N | Q92538 | protein_coding | deleterious(0) | probably_damaging(0.986) | TCGA-AC-A4ZE-01 | Breast | breast invasive carcinoma | Female | <65 | I/II | Unknown | Unknown | SD |
| GBF1 | SNV | Missense_Mutation | rs374309391 | c.3280N>T | p.Arg1094Trp | p.R1094W | Q92538 | protein_coding | deleterious(0) | probably_damaging(0.972) | TCGA-AN-A046-01 | Breast | breast invasive carcinoma | Female | >=65 | I/II | Unknown | Unknown | SD |
| GBF1 | SNV | Missense_Mutation | c.5206N>G | p.Leu1736Val | p.L1736V | Q92538 | protein_coding | tolerated_low_confidence(0.44) | benign(0.006) | TCGA-AO-A0J4-01 | Breast | breast invasive carcinoma | Female | <65 | I/II | Chemotherapy | doxorubicin | SD | |
| GBF1 | SNV | Missense_Mutation | c.3286C>T | p.Pro1096Ser | p.P1096S | Q92538 | protein_coding | deleterious(0.01) | benign(0.168) | TCGA-AO-A128-01 | Breast | breast invasive carcinoma | Female | <65 | I/II | Chemotherapy | doxorubicin | SD | |
| GBF1 | SNV | Missense_Mutation | novel | c.3123A>T | p.Gln1041His | p.Q1041H | Q92538 | protein_coding | deleterious(0.01) | benign(0.365) | TCGA-B6-A0RE-01 | Breast | breast invasive carcinoma | Female | <65 | I/II | Unknown | Unknown | SD |
| GBF1 | SNV | Missense_Mutation | novel | c.3151G>A | p.Glu1051Lys | p.E1051K | Q92538 | protein_coding | deleterious(0) | probably_damaging(0.971) | TCGA-BH-A0B6-01 | Breast | breast invasive carcinoma | Female | <65 | I/II | Unknown | Unknown | SD |
| GBF1 | SNV | Missense_Mutation | c.1845N>G | p.Ile615Met | p.I615M | Q92538 | protein_coding | tolerated(0.27) | benign(0) | TCGA-BH-A0HA-01 | Breast | breast invasive carcinoma | Female | <65 | I/II | Unknown | Unknown | SD | |
| GBF1 | SNV | Missense_Mutation | c.4597N>C | p.Asp1533His | p.D1533H | Q92538 | protein_coding | deleterious(0.01) | probably_damaging(0.995) | TCGA-C8-A26V-01 | Breast | breast invasive carcinoma | Female | <65 | III/IV | Hormone Therapy | tamoxiphen | CR | |
| GBF1 | SNV | Missense_Mutation | c.364N>A | p.Val122Met | p.V122M | Q92538 | protein_coding | tolerated(0.22) | possibly_damaging(0.846) | TCGA-C8-A26X-01 | Breast | breast invasive carcinoma | Female | <65 | I/II | Chemotherapy | 5-fluorouracil | CR | |
| GBF1 | SNV | Missense_Mutation | c.2717N>T | p.Arg906Leu | p.R906L | Q92538 | protein_coding | deleterious(0) | probably_damaging(0.982) | TCGA-E2-A14R-01 | Breast | breast invasive carcinoma | Female | <65 | I/II | Chemotherapy | doxorubicin | PD |
| Page: 1 2 3 4 5 6 7 8 9 10 11 12 13 14 15 16 17 18 |
Top |
Related drugs of malignant transformation related genes |
| Identification of chemicals and drugs interact with genes involved in malignant transfromation |
| (DGIdb 4.0) |
| Entrez ID | Symbol | Category | Interaction Types | Drug Claim Name | Drug Name | PMIDs |
| Page: 1 |

Copyright 2023-Present -The University of Texas Health Science Center at Houston |