Schematic overview of the cellular and molecular mechanisms involved in the cancer progression, including the proposed cellular and molecular mechanisms in cancer cells trajectory. AT1: alveolar type 1 cells; AT2: alveolar type 2 cells; AAH: atypical adenomatous hyperplasia; AIS: adenocarcinoma in situ; MIA: minimally invasive adenocarcinoma; IA: invasive adenocarcinoma; EMT: epithelial-mesenchymal transition

Home

Download

Statistics

Help

Contact

Center for Computational Systems Medicine
leaf

Gene summary

leaf

Malignant transformation analysis

leaf

Malignant transformation related pathway analysis

leaf

Cell-cell communication analysis

leaf

Single-cell gene regulatory network inference analysis

leaf

Somatic mutation of malignant transformation related genes

leaf

Related drugs of malignant transformation related genes

Gene: GBE1

Gene summary for GBE1

check button Gene summary.

Gene informationSpeciesHuman
Gene symbol

GBE1

Gene ID

2632

Gene name1,4-alpha-glucan branching enzyme 1
Gene AliasAPBD
Cytomap3p12.2
Gene Typeprotein-coding
GO ID

GO:0000271

UniProtAcc

Q04446


Top

Malignant transformation analysis

check button Identification of the aberrant gene expression in precancerous and cancerous lesions by comparing the gene expression of stem-like cells in diseased tissues with normal stem cells
check button Malignant transformation involving gene list.
Entrez IDSymbolReplicatesSpeciesOrganTissueAdj P-valueLog2FCMalignancy
2632GBE1AEH-subject1HumanEndometriumAEH8.11e-104.03e-01-0.3059
2632GBE1AEH-subject2HumanEndometriumAEH9.13e-053.46e-01-0.2525
2632GBE1AEH-subject3HumanEndometriumAEH8.29e-052.67e-01-0.2576
2632GBE1EEC-subject1HumanEndometriumEEC1.64e-084.11e-01-0.2682
2632GBE1EEC-subject2HumanEndometriumEEC4.14e-032.05e-01-0.2607
2632GBE1GSM6177620_NYU_UCEC1_lib1_lib1HumanEndometriumEEC7.32e-057.85e-02-0.1869
2632GBE1GSM6177620_NYU_UCEC1_lib2_lib2HumanEndometriumEEC1.23e-038.40e-02-0.1875
2632GBE1GSM6177620_NYU_UCEC1_lib3_lib3HumanEndometriumEEC1.52e-048.96e-03-0.1883
2632GBE1GSM6177621_NYU_UCEC2_lib1_lib1HumanEndometriumEEC1.99e-521.03e+00-0.1934
2632GBE1GSM6177622_NYU_UCEC3_lib1_lib1HumanEndometriumEEC1.07e-09-5.85e-02-0.1917
2632GBE1GSM6177622_NYU_UCEC3_lib2_lib2HumanEndometriumEEC4.86e-09-6.18e-02-0.1916
2632GBE1LZE4THumanEsophagusESCC1.51e-123.87e-010.0811
2632GBE1LZE8THumanEsophagusESCC3.24e-102.82e-010.067
2632GBE1P2T-EHumanEsophagusESCC5.11e-211.28e-010.1177
2632GBE1P4T-EHumanEsophagusESCC6.76e-071.78e-010.1323
2632GBE1P5T-EHumanEsophagusESCC1.87e-031.15e-010.1327
2632GBE1P8T-EHumanEsophagusESCC5.44e-106.04e-020.0889
2632GBE1P9T-EHumanEsophagusESCC7.89e-151.52e-010.1131
2632GBE1P10T-EHumanEsophagusESCC7.85e-181.76e-010.116
2632GBE1P11T-EHumanEsophagusESCC6.23e-144.20e-010.1426
Page: 1 2 3 4 5 6 

check button Transcriptomic changes along malignancy continuum.
TissueExpression DynamicsAbbreviation
EndometriumThe image shows the transcriptomic changes along malignancy continuum.log2FC in expression of this searched gene in stem-like cells from each diseased tissue sample relative to stem-like cells in normal samples in each tissue plotted against the malignancy continuum. Samples are colored based on if they are from different disease stage.
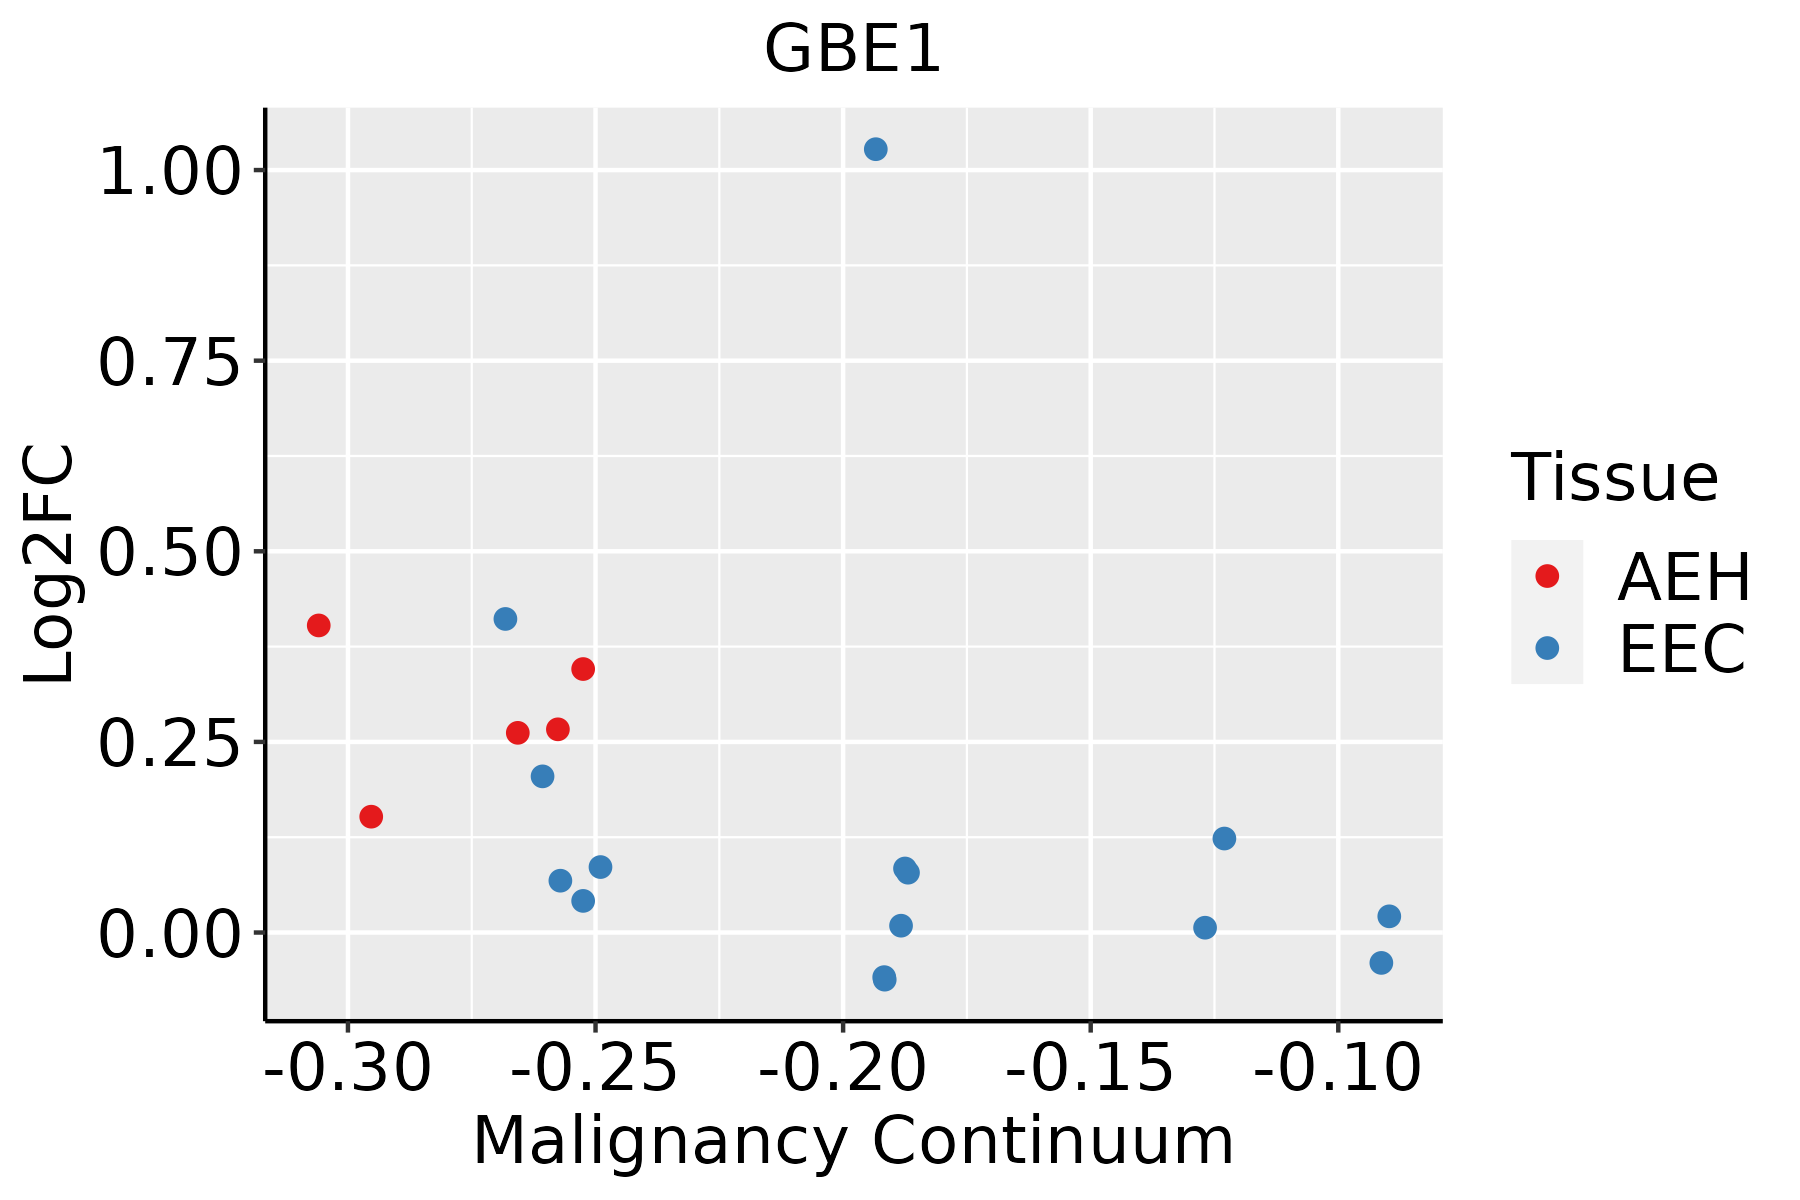
AEH: Atypical endometrial hyperplasia
EEC: Endometrioid Cancer
EsophagusThe image shows the transcriptomic changes along malignancy continuum.log2FC in expression of this searched gene in stem-like cells from each diseased tissue sample relative to stem-like cells in normal samples in each tissue plotted against the malignancy continuum. Samples are colored based on if they are from different disease stage.
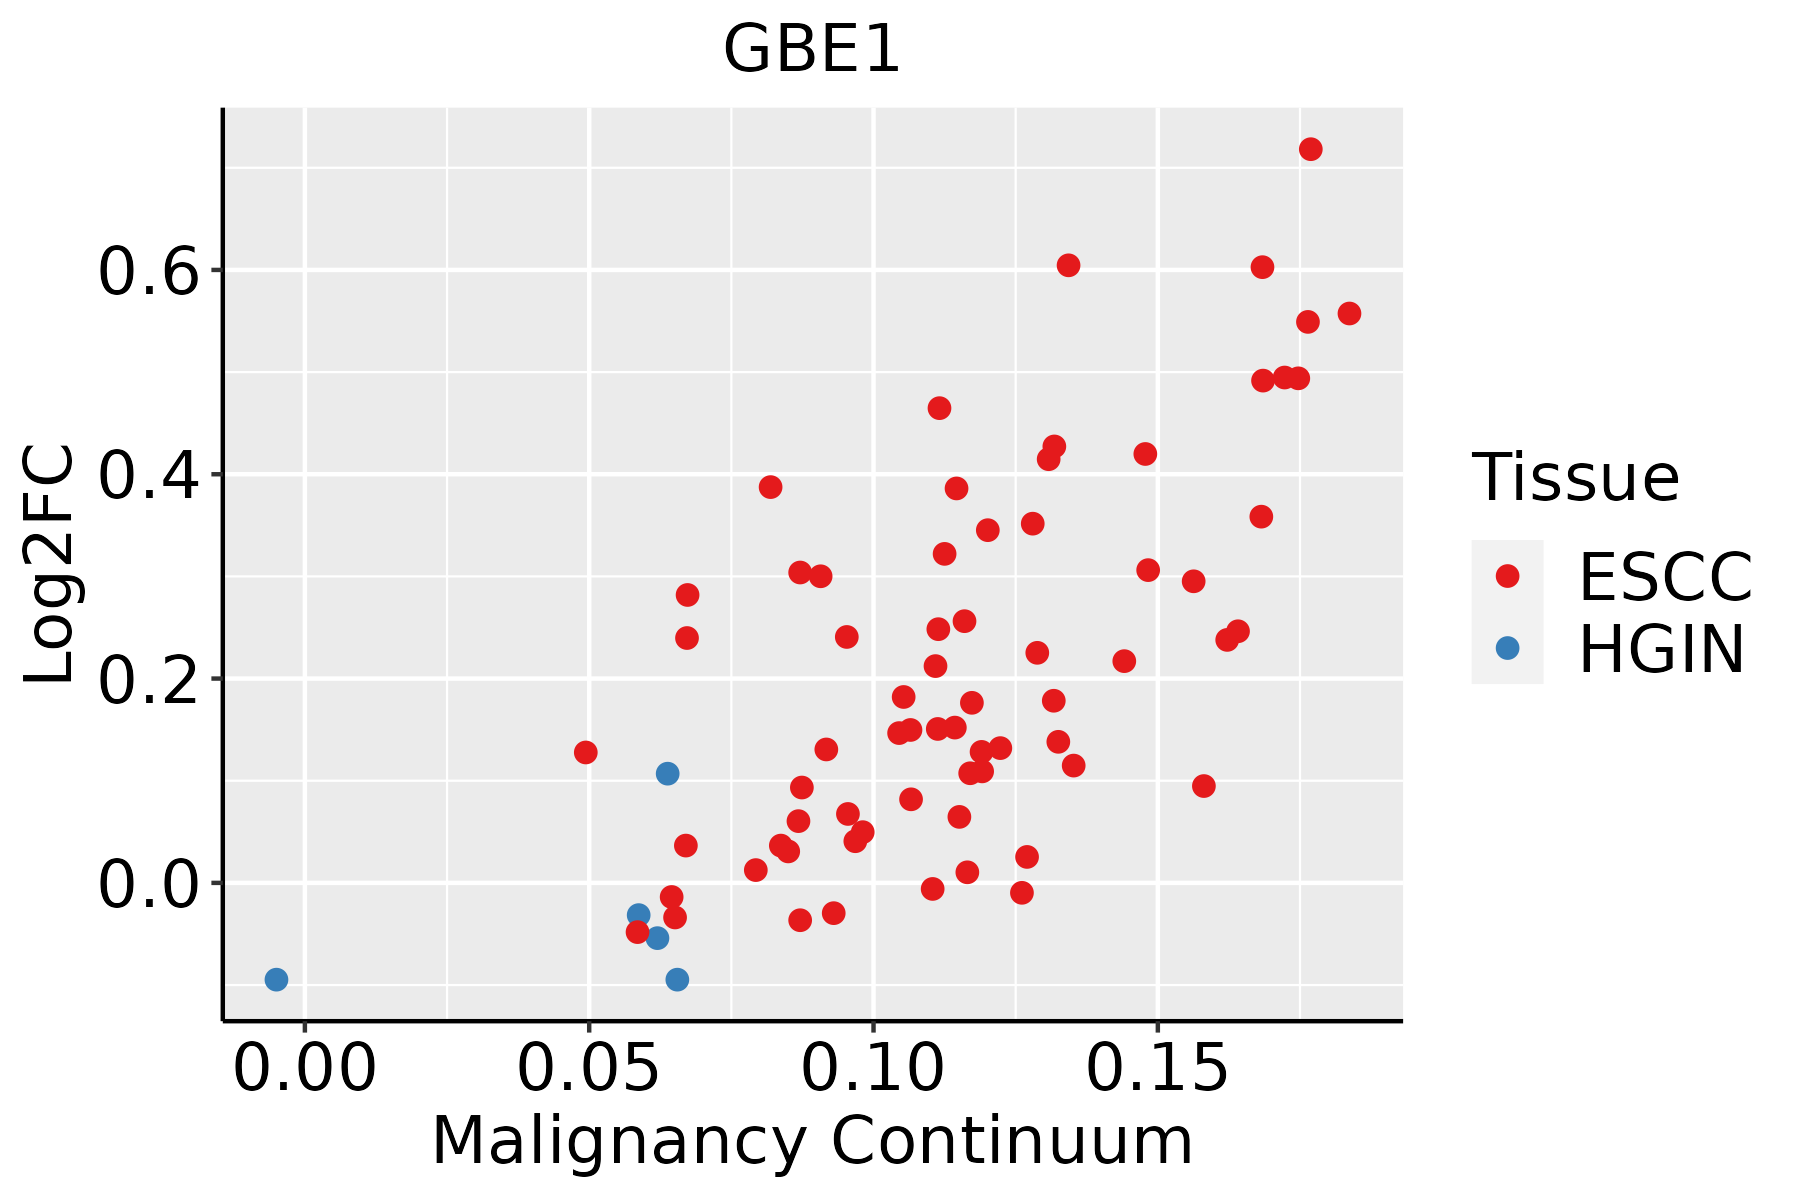
ESCC: Esophageal squamous cell carcinoma
HGIN: High-grade intraepithelial neoplasias
LGIN: Low-grade intraepithelial neoplasias
LiverThe image shows the transcriptomic changes along malignancy continuum.log2FC in expression of this searched gene in stem-like cells from each diseased tissue sample relative to stem-like cells in normal samples in each tissue plotted against the malignancy continuum. Samples are colored based on if they are from different disease stage.
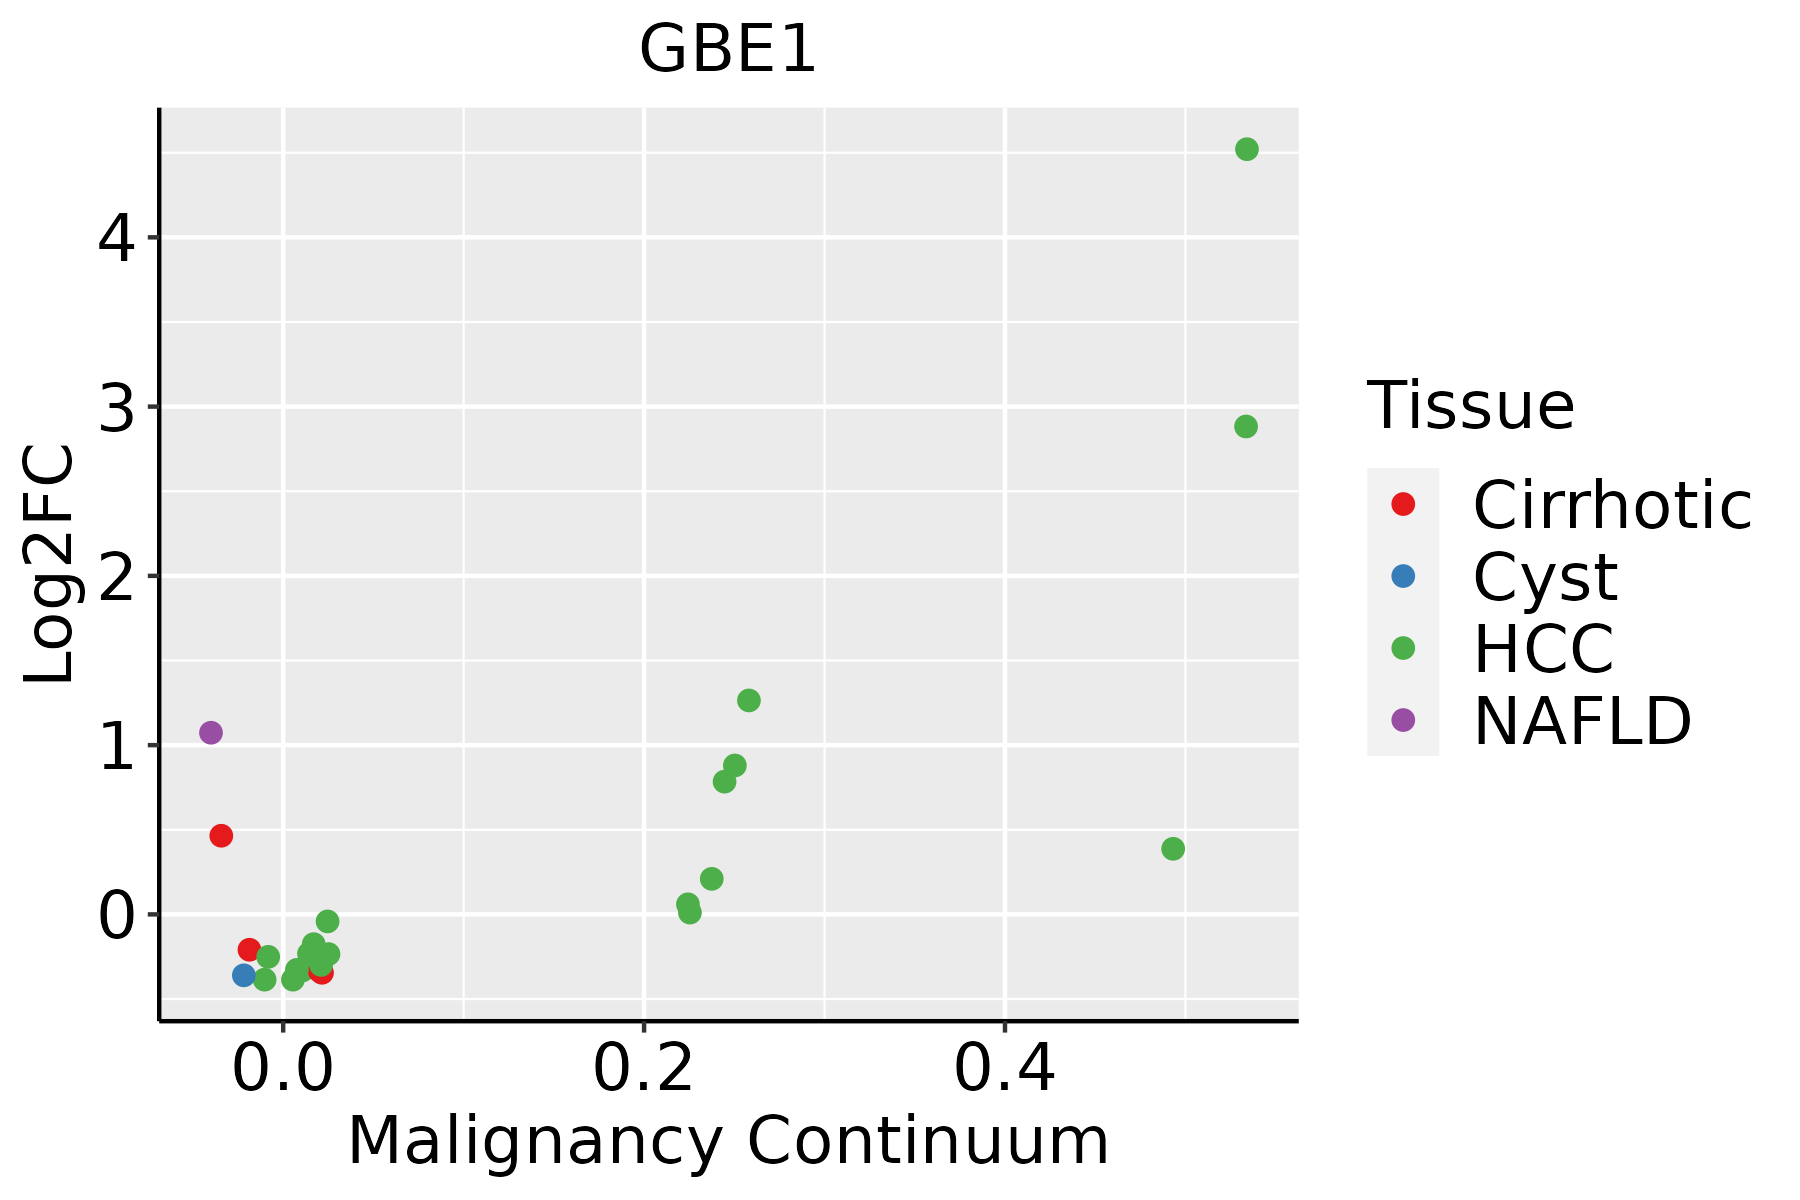
HCC: Hepatocellular carcinoma
NAFLD: Non-alcoholic fatty liver disease
LungThe image shows the transcriptomic changes along malignancy continuum.log2FC in expression of this searched gene in stem-like cells from each diseased tissue sample relative to stem-like cells in normal samples in each tissue plotted against the malignancy continuum. Samples are colored based on if they are from different disease stage.
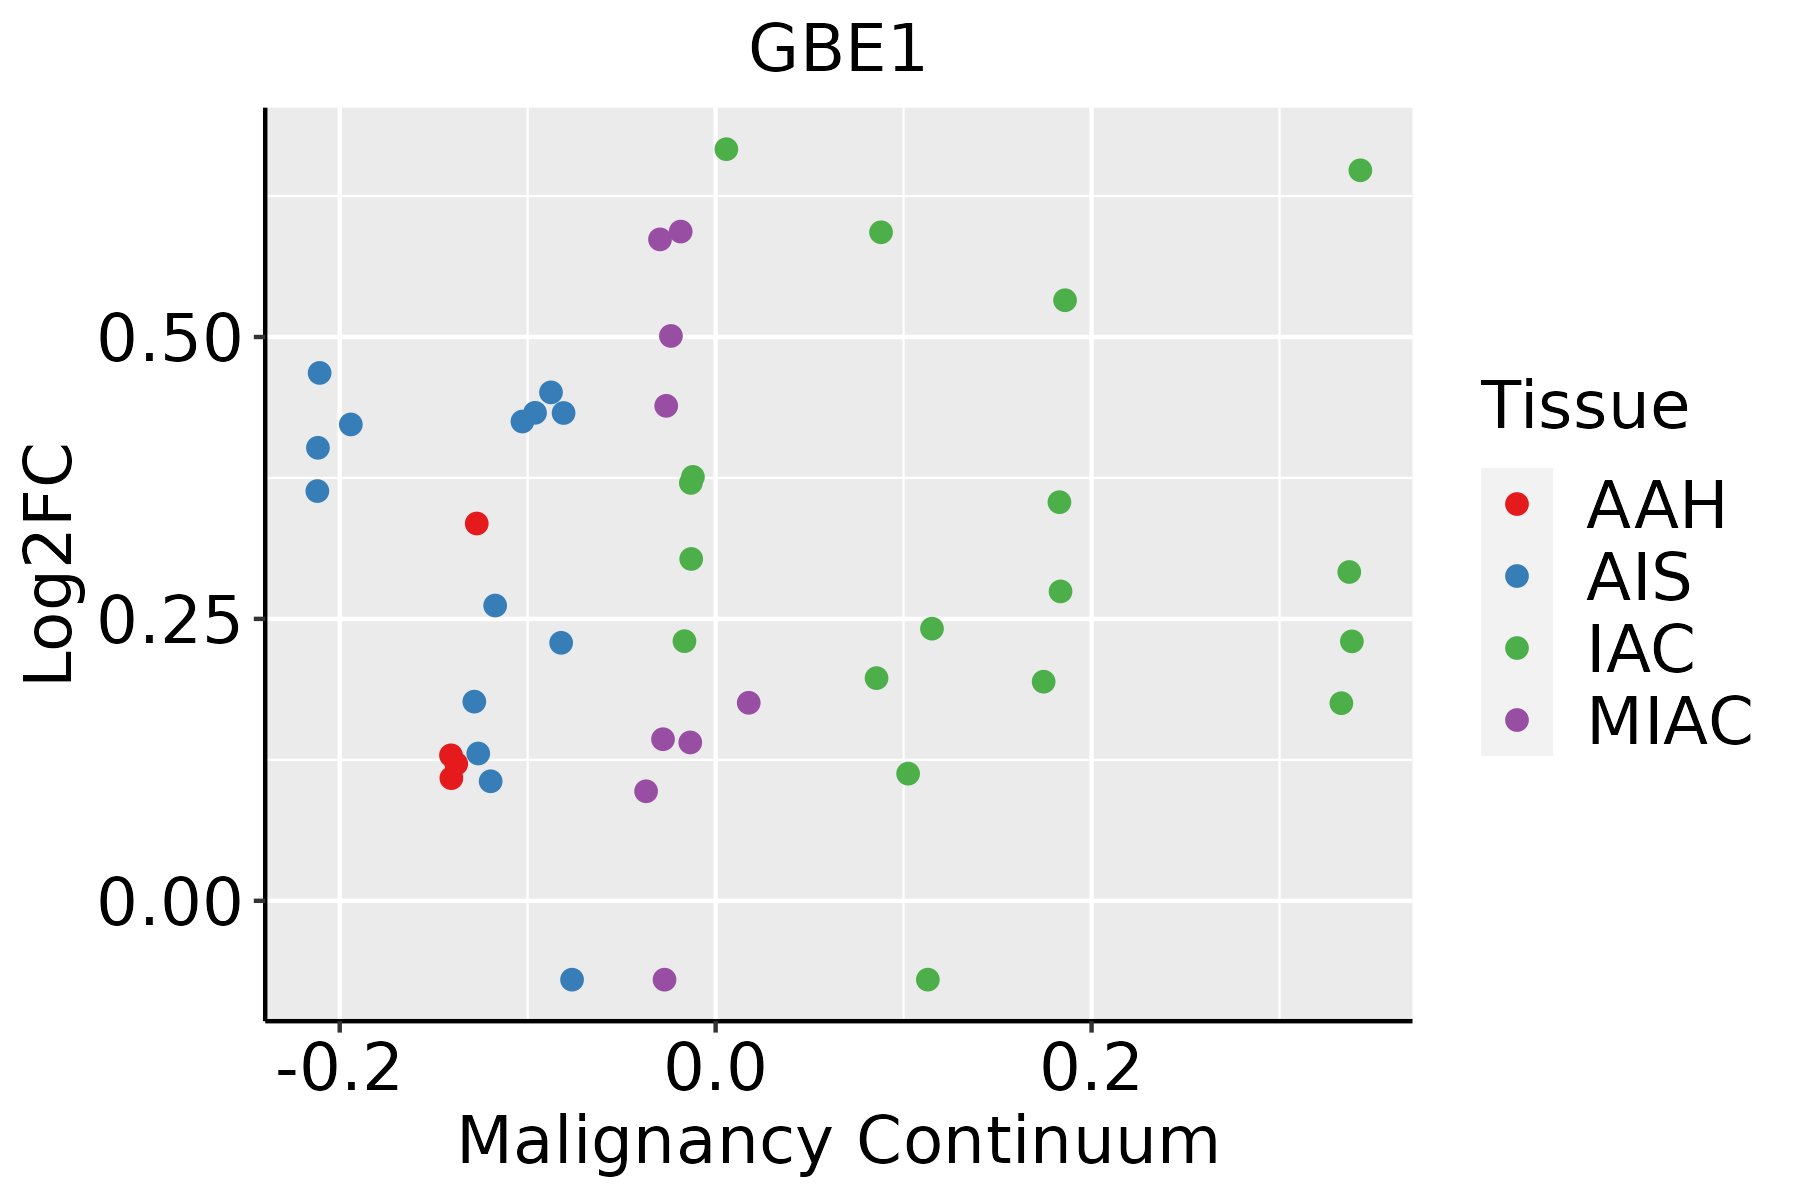
AAH: Atypical adenomatous hyperplasia
AIS: Adenocarcinoma in situ
IAC: Invasive lung adenocarcinoma
MIA: Minimally invasive adenocarcinoma
SkinThe image shows the transcriptomic changes along malignancy continuum.log2FC in expression of this searched gene in stem-like cells from each diseased tissue sample relative to stem-like cells in normal samples in each tissue plotted against the malignancy continuum. Samples are colored based on if they are from different disease stage.
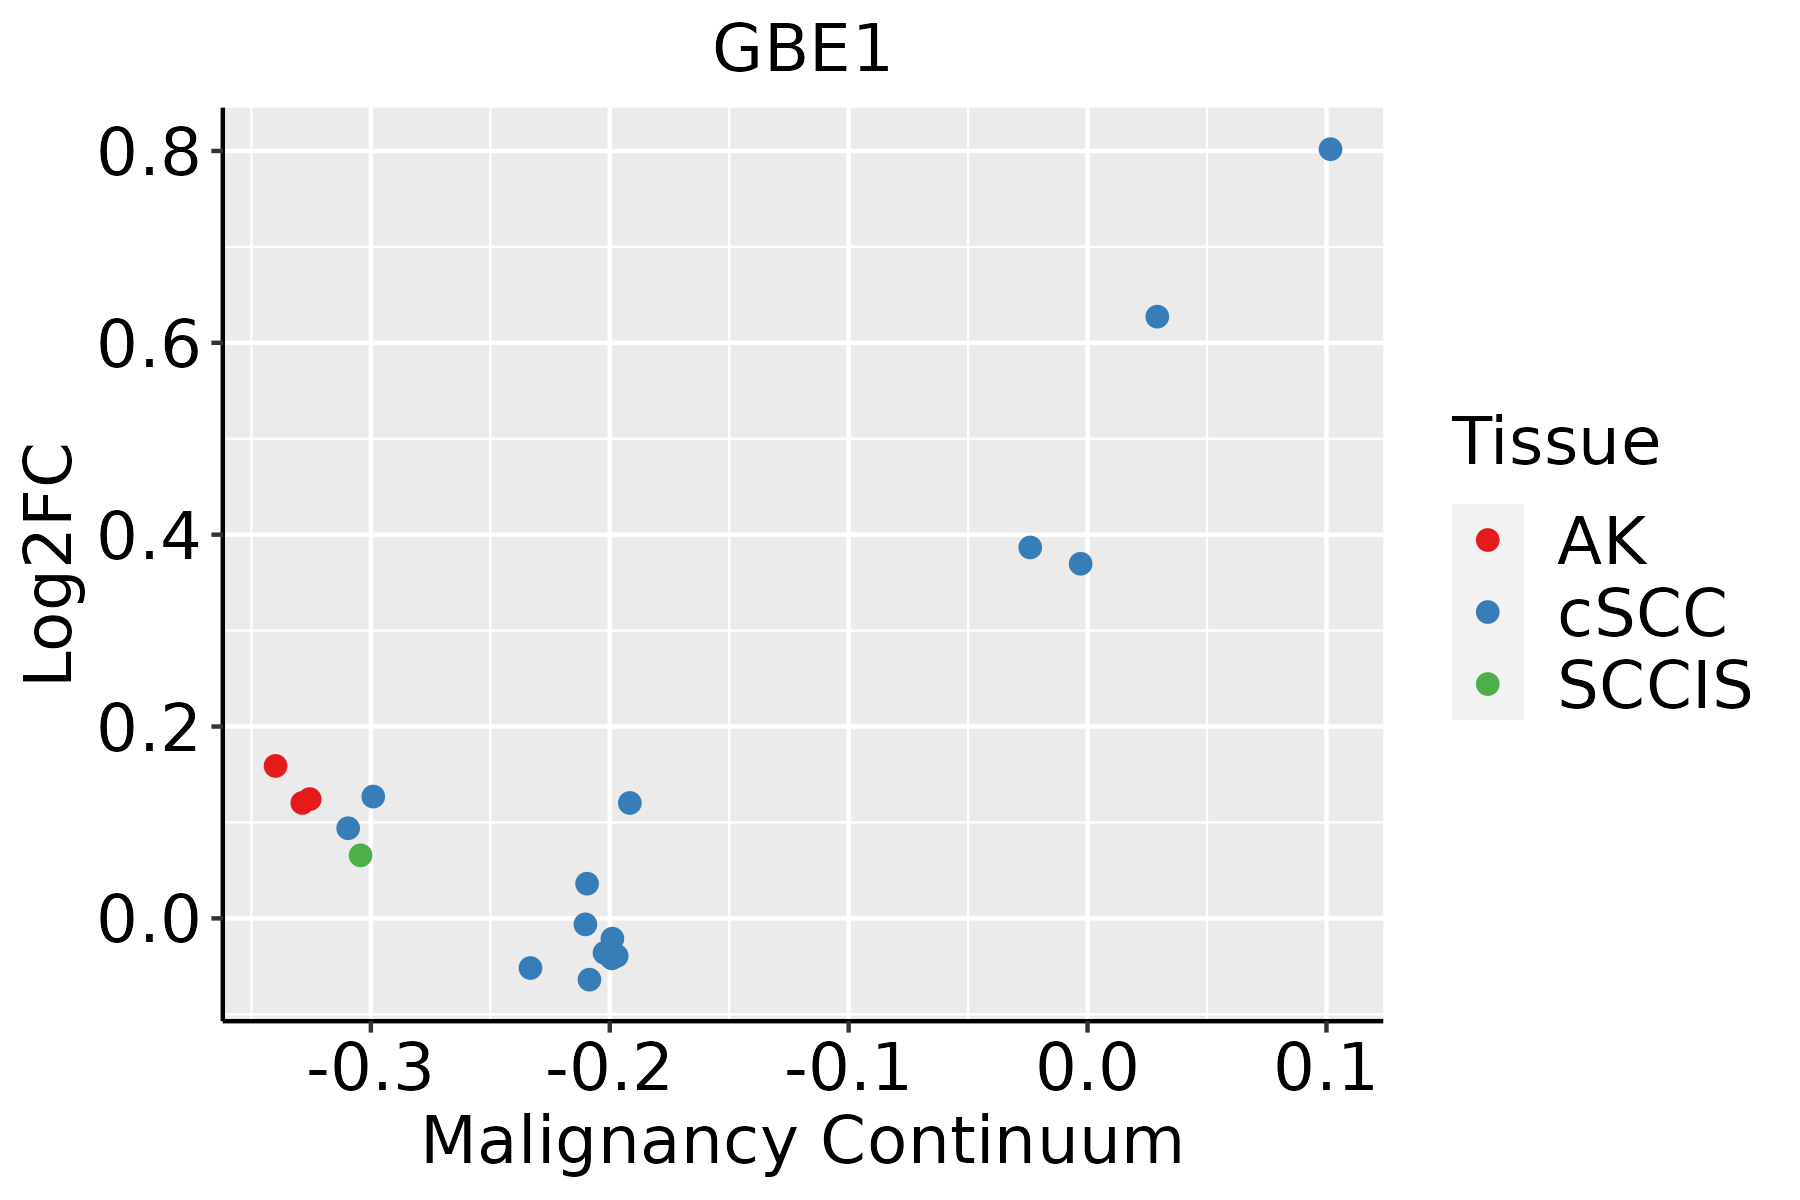
AK: Actinic keratosis
cSCC: Cutaneous squamous cell carcinoma
SCCIS:squamous cell carcinoma in situ
ThyroidThe image shows the transcriptomic changes along malignancy continuum.log2FC in expression of this searched gene in stem-like cells from each diseased tissue sample relative to stem-like cells in normal samples in each tissue plotted against the malignancy continuum. Samples are colored based on if they are from different disease stage.
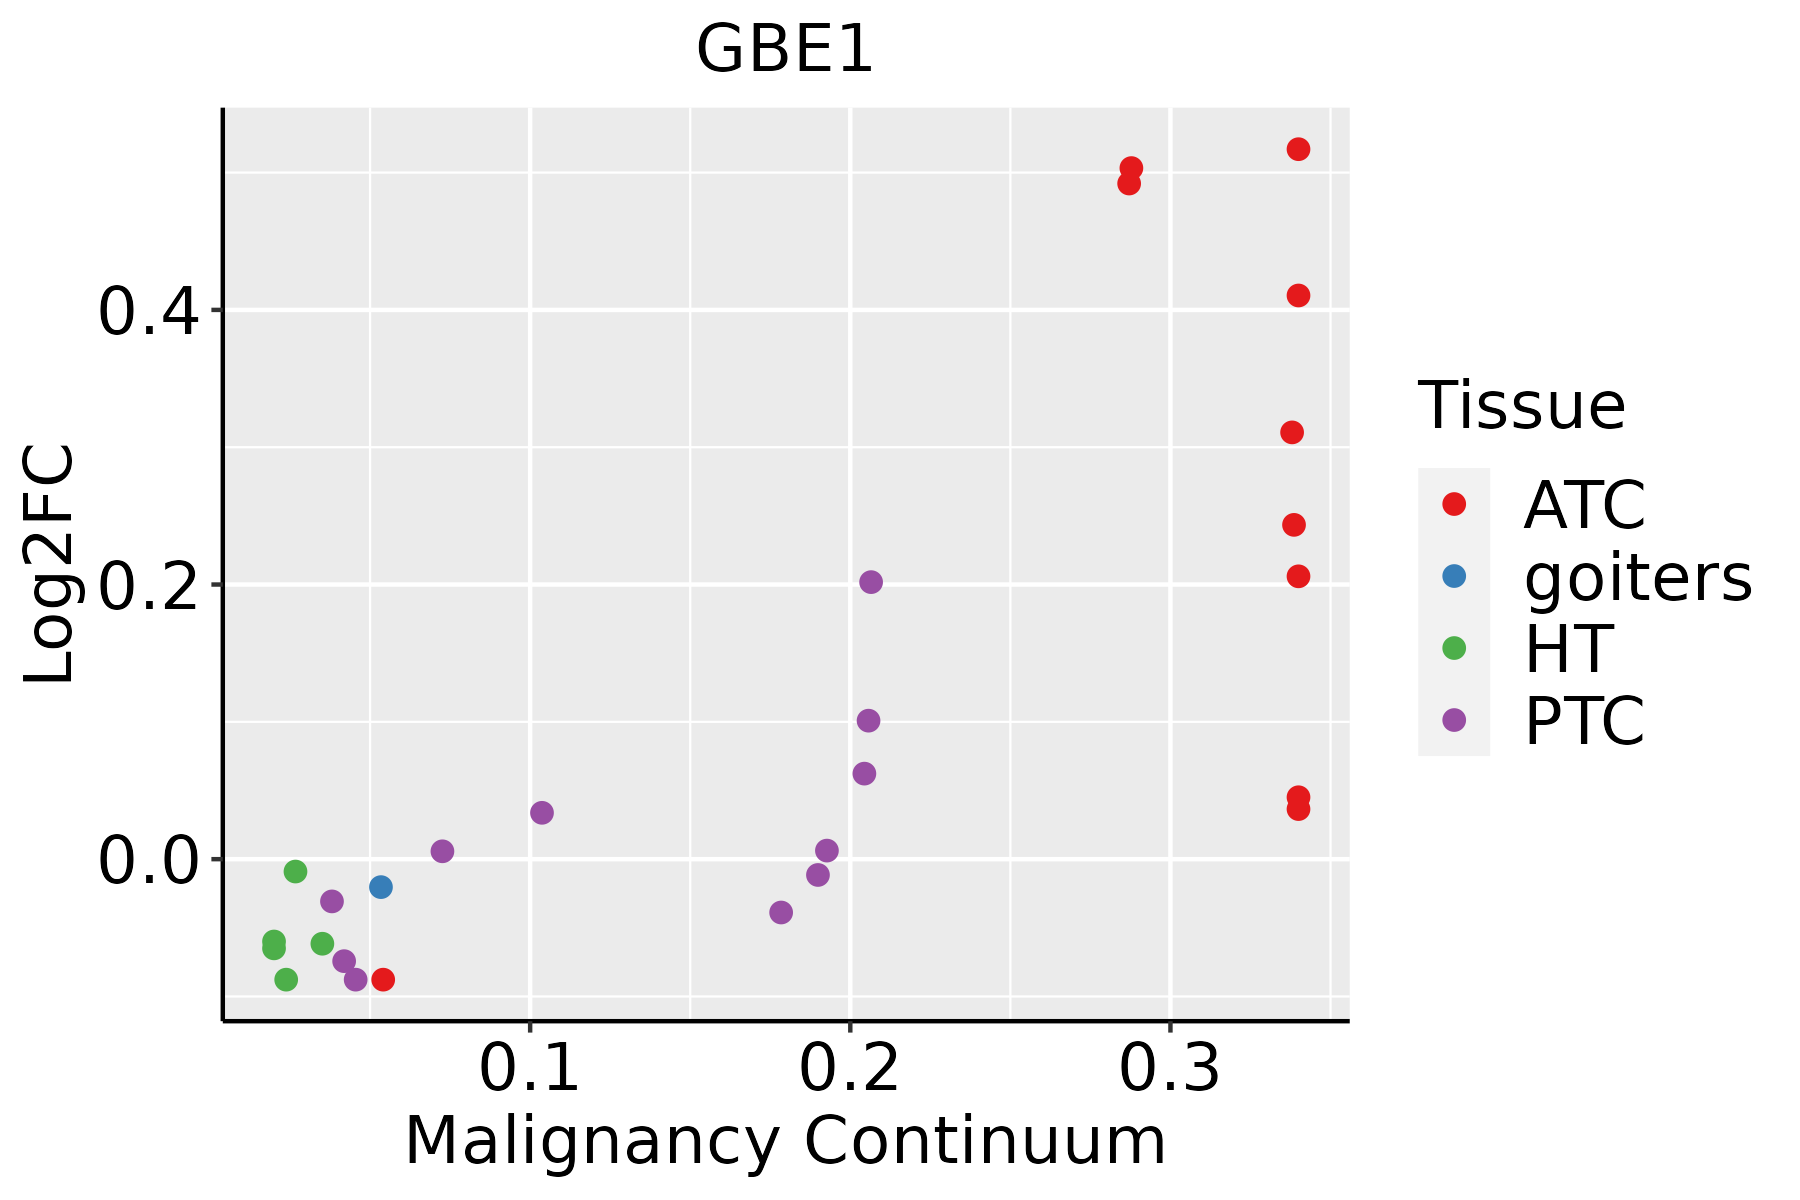
ATC: Anaplastic thyroid cancer
HT: Hashimoto's thyroiditis
PTC: Papillary thyroid cancer
∗log2FC in expression of this searched gene in stem-like cells from each diseased tissue sample relative to stem-like cells in normal samples in each tissue plotted against the malignancy continuum. Samples are colored based on if they are from different disease stage.

Top

Malignant transformation related pathway analysis

check buttonFind out the enriched GO biological processes and KEGG pathways involved in transition from healthy to precancer to cancer
check button Figure of enriched GO biological processes.
TissueDisease StageEnriched GO biological Processes
ColorectumADGO analysis - Figure of enriched GO biological processes: Top 15 enriched GO BP terms are showed in the bar plot of each disease state in each tissue. Each row represents a significant GO biological process which is colored according to the -log10(p.adjust).
ColorectumSERGO analysis - Figure of enriched GO biological processes: Top 15 enriched GO BP terms are showed in the bar plot of each disease state in each tissue. Each row represents a significant GO biological process which is colored according to the -log10(p.adjust).
ColorectumMSSGO analysis - Figure of enriched GO biological processes: Top 15 enriched GO BP terms are showed in the bar plot of each disease state in each tissue. Each row represents a significant GO biological process which is colored according to the -log10(p.adjust).
ColorectumMSI-HGO analysis - Figure of enriched GO biological processes: Top 15 enriched GO BP terms are showed in the bar plot of each disease state in each tissue. Each row represents a significant GO biological process which is colored according to the -log10(p.adjust).
ColorectumFAPGO analysis - Figure of enriched GO biological processes: Top 15 enriched GO BP terms are showed in the bar plot of each disease state in each tissue. Each row represents a significant GO biological process which is colored according to the -log10(p.adjust).
∗Top 15 enriched GO BP terms are showed in the bar plot of each disease state in each tissue. Each row represents a significant GO biological process which is colored according to the -log10(p.adjust).
Page: 1 2 3 4 5 6 7 8 9 

check button Enriched GO biological processes.
GO IDTissueDisease StageDescriptionGene RatioBg Ratiopvaluep.adjustCount
GO:001598010EndometriumAEHenergy derivation by oxidation of organic compounds93/2100318/187238.51e-195.10e-1693
GO:000609110EndometriumAEHgeneration of precursor metabolites and energy121/2100490/187231.65e-178.23e-15121
GO:190121416EndometriumAEHregulation of neuron death51/2100319/187235.82e-033.55e-0251
GO:007099716EndometriumAEHneuron death56/2100361/187237.51e-034.26e-0256
GO:001598015EndometriumEECenergy derivation by oxidation of organic compounds97/2168318/187235.37e-203.58e-1797
GO:000609115EndometriumEECgeneration of precursor metabolites and energy125/2168490/187233.76e-181.88e-15125
GO:007099717EndometriumEECneuron death60/2168361/187232.49e-031.83e-0260
GO:190121417EndometriumEECregulation of neuron death54/2168319/187232.67e-031.93e-0254
GO:0006091110EsophagusESCCgeneration of precursor metabolites and energy331/8552490/187233.86e-238.45e-21331
GO:0015980110EsophagusESCCenergy derivation by oxidation of organic compounds220/8552318/187231.20e-171.09e-15220
GO:0070997111EsophagusESCCneuron death216/8552361/187233.49e-086.45e-07216
GO:0051402110EsophagusESCCneuron apoptotic process148/8552246/187233.08e-063.47e-05148
GO:1901214111EsophagusESCCregulation of neuron death186/8552319/187233.35e-063.73e-05186
GO:00442626EsophagusESCCcellular carbohydrate metabolic process160/8552283/187231.43e-049.66e-04160
GO:00160514EsophagusESCCcarbohydrate biosynthetic process117/8552202/187232.96e-041.79e-03117
GO:004352317EsophagusESCCregulation of neuron apoptotic process122/8552212/187233.21e-041.90e-03122
GO:190121516EsophagusESCCnegative regulation of neuron death115/8552208/187233.24e-031.34e-02115
GO:00346372EsophagusESCCcellular carbohydrate biosynthetic process46/855278/187231.24e-024.13e-0246
GO:00060917LiverNAFLDgeneration of precursor metabolites and energy84/1882490/187237.03e-073.95e-0584
GO:00442623LiverNAFLDcellular carbohydrate metabolic process55/1882283/187231.27e-066.01e-0555
Page: 1 2 3 4 5 

check button Enriched KEGG pathways.
Pathway IDTissueDisease StageDescriptionGene RatioBg Ratiopvaluep.adjustqvalueCount
Page: 1 

Top

Cell-cell communication analysis

check buttonIdentification of potential cell-cell interactions between two cell types and their ligand-receptor pairs for different disease states
LigandReceptorLRpairPathwayTissueDisease Stage
Page: 1 

Top

Single-cell gene regulatory network inference analysis

check buttonFind out the significant the regulons (TFs) and the target genes of each regulon across cell types for different disease states
TFCell TypeTissueDisease StageTarget GeneRSSRegulon Activity
∗The dot plots of a searched regulon are shown for all cell subpopulations in each disease state of each tissue based on the regulon specific score inferred using pySCENIC and by calculating the average expression.
Page: 1 

Top

Somatic mutation of malignant transformation related genes

check buttonAnnotation of somatic variants for genes involved in malignant transformation
Hugo SymbolVariant ClassVariant ClassificationdbSNP RSHGVScHGVSpHGVSp ShortSWISSPROTBIOTYPESIFTPolyPhenTumor Sample BarcodeTissueHistologySexAgeStageTherapy TypesDrugsOutcome
GBE1SNVMissense_Mutationnovelc.249N>Ap.Asp83Glup.D83EQ04446protein_codingtolerated(0.19)benign(0.031)TCGA-A7-A6VY-01Breastbreast invasive carcinomaFemale<65I/IIChemotherapycyclophosphamideCR
GBE1SNVMissense_Mutationnovelc.1054N>Tp.Asp352Tyrp.D352YQ04446protein_codingdeleterious(0)probably_damaging(1)TCGA-AN-A046-01Breastbreast invasive carcinomaFemale>=65I/IIUnknownUnknownSD
GBE1SNVMissense_Mutationc.605N>Gp.Ser202Cysp.S202CQ04446protein_codingtolerated(0.26)benign(0.003)TCGA-AO-A0JM-01Breastbreast invasive carcinomaFemale<65I/IIChemotherapydoxorubicinSD
GBE1SNVMissense_Mutationnovelc.1442A>Tp.Asp481Valp.D481VQ04446protein_codingdeleterious(0)probably_damaging(1)TCGA-AQ-A54O-01Breastbreast invasive carcinomaMale<65I/IIChemotherapyadriamycinCR
GBE1SNVMissense_Mutationrs772802187c.1825N>Ap.Glu609Lysp.E609KQ04446protein_codingdeleterious(0)possibly_damaging(0.703)TCGA-BH-A0AW-01Breastbreast invasive carcinomaFemale<65I/IIChemotherapycarboplatinSD
GBE1SNVMissense_Mutationc.1853N>Cp.Arg618Thrp.R618TQ04446protein_codingdeleterious(0)probably_damaging(1)TCGA-C8-A134-01Breastbreast invasive carcinomaFemale<65I/IIChemotherapy5-fluorouracilCR
GBE1SNVMissense_Mutationnovelc.848N>Cp.Val283Alap.V283AQ04446protein_codingdeleterious(0)probably_damaging(0.993)TCGA-GI-A2C9-01Breastbreast invasive carcinomaFemale<65I/IIUnspecificSD
GBE1SNVMissense_Mutationrs200580762c.1388N>Tp.Thr463Metp.T463MQ04446protein_codingdeleterious(0.02)probably_damaging(0.981)TCGA-OL-A66N-01Breastbreast invasive carcinomaFemale<65III/IVUnknownUnknownSD
GBE1SNVMissense_Mutationrs780840389c.1580N>Tp.Thr527Metp.T527MQ04446protein_codingdeleterious(0)probably_damaging(0.995)TCGA-S3-AA0Z-01Breastbreast invasive carcinomaFemale<65I/IIAncillaryneulastaCR
GBE1deletionFrame_Shift_Delnovelc.1852delNp.Arg618GlufsTer33p.R618Efs*33Q04446protein_codingTCGA-D8-A27V-01Breastbreast invasive carcinomaFemale<65I/IIHormone TherapytamoxiphenSD
Page: 1 2 3 4 5 6 7 8 

Top

Related drugs of malignant transformation related genes

check buttonIdentification of chemicals and drugs interact with genes involved in malignant transfromation
(DGIdb 4.0)
Entrez IDSymbolCategoryInteraction TypesDrug Claim NameDrug NamePMIDs
Page: 1