
|
|||||
|
 | |
| |
| |
| |
| |
| |
|
Gene: GBA |
Gene summary for GBA |
| Gene information | Species | Human | Gene symbol | GBA | Gene ID | 2629 |
| Gene name | glucosylceramidase beta | |
| Gene Alias | GBA1 | |
| Cytomap | 1q22 | |
| Gene Type | protein-coding | GO ID | GO:0000165 | UniProtAcc | A0A068F658 |
Top |
Malignant transformation analysis |
| Identification of the aberrant gene expression in precancerous and cancerous lesions by comparing the gene expression of stem-like cells in diseased tissues with normal stem cells |
| Entrez ID | Symbol | Replicates | Species | Organ | Tissue | Adj P-value | Log2FC | Malignancy |
| 2629 | GBA | LZE4T | Human | Esophagus | ESCC | 3.78e-08 | 2.23e-01 | 0.0811 |
| 2629 | GBA | LZE5T | Human | Esophagus | ESCC | 1.40e-06 | 3.27e-01 | 0.0514 |
| 2629 | GBA | LZE7T | Human | Esophagus | ESCC | 9.32e-08 | 3.09e-01 | 0.0667 |
| 2629 | GBA | LZE8T | Human | Esophagus | ESCC | 6.71e-04 | 1.58e-01 | 0.067 |
| 2629 | GBA | LZE20T | Human | Esophagus | ESCC | 1.97e-04 | 1.77e-01 | 0.0662 |
| 2629 | GBA | LZE22T | Human | Esophagus | ESCC | 1.48e-05 | 4.06e-01 | 0.068 |
| 2629 | GBA | LZE24T | Human | Esophagus | ESCC | 8.28e-18 | 4.00e-01 | 0.0596 |
| 2629 | GBA | LZE21T | Human | Esophagus | ESCC | 8.02e-04 | 3.13e-01 | 0.0655 |
| 2629 | GBA | LZE6T | Human | Esophagus | ESCC | 1.71e-05 | 2.57e-01 | 0.0845 |
| 2629 | GBA | P1T-E | Human | Esophagus | ESCC | 1.05e-09 | 4.22e-01 | 0.0875 |
| 2629 | GBA | P2T-E | Human | Esophagus | ESCC | 5.95e-29 | 4.51e-01 | 0.1177 |
| 2629 | GBA | P4T-E | Human | Esophagus | ESCC | 1.01e-26 | 5.30e-01 | 0.1323 |
| 2629 | GBA | P5T-E | Human | Esophagus | ESCC | 8.08e-19 | 3.05e-01 | 0.1327 |
| 2629 | GBA | P8T-E | Human | Esophagus | ESCC | 2.56e-16 | 2.84e-01 | 0.0889 |
| 2629 | GBA | P9T-E | Human | Esophagus | ESCC | 4.90e-17 | 3.59e-01 | 0.1131 |
| 2629 | GBA | P10T-E | Human | Esophagus | ESCC | 8.84e-05 | 1.28e-01 | 0.116 |
| 2629 | GBA | P11T-E | Human | Esophagus | ESCC | 2.94e-14 | 4.93e-01 | 0.1426 |
| 2629 | GBA | P12T-E | Human | Esophagus | ESCC | 6.56e-15 | 2.78e-01 | 0.1122 |
| 2629 | GBA | P15T-E | Human | Esophagus | ESCC | 5.63e-18 | 3.42e-01 | 0.1149 |
| 2629 | GBA | P16T-E | Human | Esophagus | ESCC | 2.86e-20 | 3.56e-01 | 0.1153 |
| Page: 1 2 3 4 5 |
| Tissue | Expression Dynamics | Abbreviation |
| Esophagus |  | ESCC: Esophageal squamous cell carcinoma |
| HGIN: High-grade intraepithelial neoplasias | ||
| LGIN: Low-grade intraepithelial neoplasias | ||
| Liver | 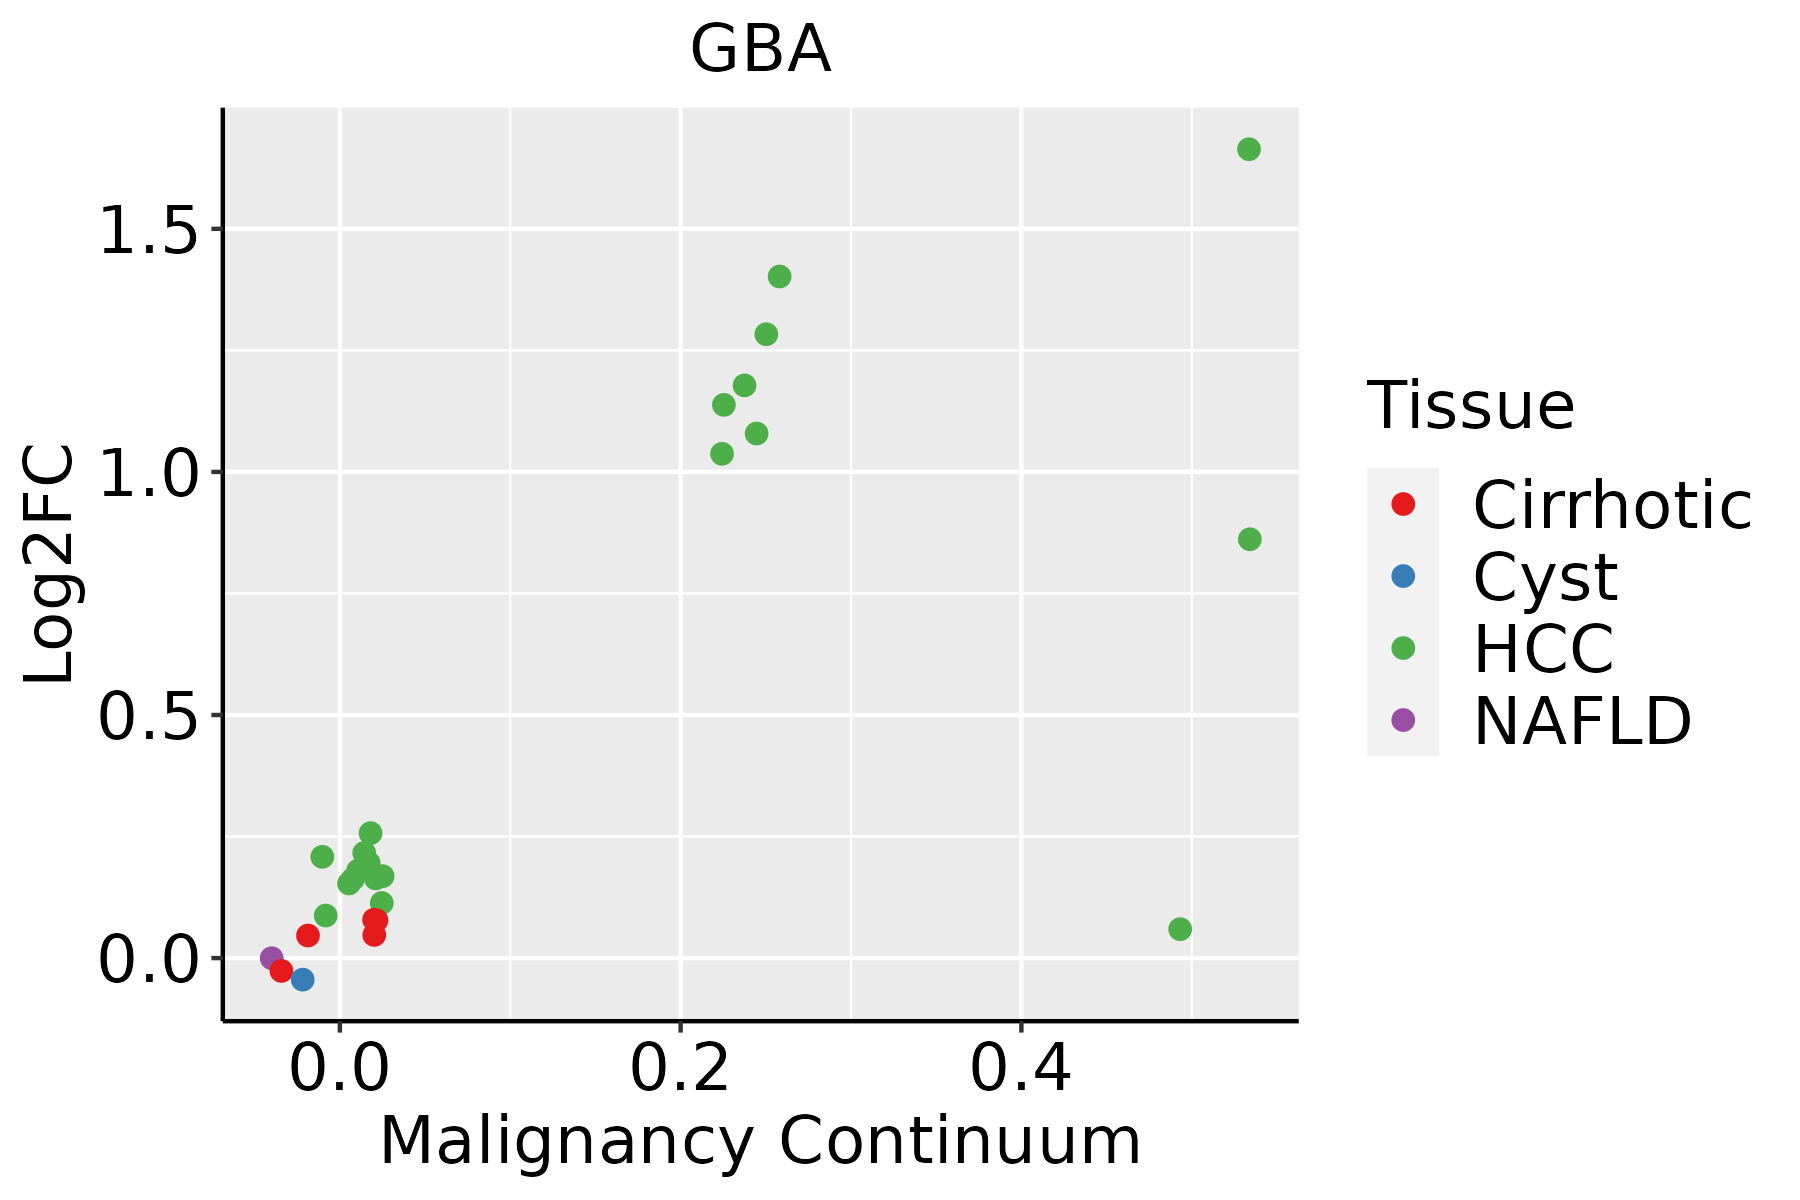 | HCC: Hepatocellular carcinoma |
| NAFLD: Non-alcoholic fatty liver disease | ||
| Oral Cavity |  | EOLP: Erosive Oral lichen planus |
| LP: leukoplakia | ||
| NEOLP: Non-erosive oral lichen planus | ||
| OSCC: Oral squamous cell carcinoma |
| ∗log2FC in expression of this searched gene in stem-like cells from each diseased tissue sample relative to stem-like cells in normal samples in each tissue plotted against the malignancy continuum. Samples are colored based on if they are from different disease stage. |
Top |
Malignant transformation related pathway analysis |
| Find out the enriched GO biological processes and KEGG pathways involved in transition from healthy to precancer to cancer |
| Tissue | Disease Stage | Enriched GO biological Processes |
| Colorectum | AD |  |
| Colorectum | SER |  |
| Colorectum | MSS |  |
| Colorectum | MSI-H |  |
| Colorectum | FAP |  |
| ∗Top 15 enriched GO BP terms are showed in the bar plot of each disease state in each tissue. Each row represents a significant GO biological process which is colored according to the -log10(p.adjust). |
| Page: 1 2 3 4 5 6 7 8 9 |
| GO ID | Tissue | Disease Stage | Description | Gene Ratio | Bg Ratio | pvalue | p.adjust | Count |
| GO:0010498111 | Esophagus | ESCC | proteasomal protein catabolic process | 369/8552 | 490/18723 | 1.13e-41 | 1.80e-38 | 369 |
| GO:0043161111 | Esophagus | ESCC | proteasome-mediated ubiquitin-dependent protein catabolic process | 312/8552 | 412/18723 | 3.53e-36 | 4.48e-33 | 312 |
| GO:0042176111 | Esophagus | ESCC | regulation of protein catabolic process | 280/8552 | 391/18723 | 8.65e-26 | 2.39e-23 | 280 |
| GO:001623617 | Esophagus | ESCC | macroautophagy | 216/8552 | 291/18723 | 1.94e-23 | 4.57e-21 | 216 |
| GO:0022411111 | Esophagus | ESCC | cellular component disassembly | 305/8552 | 443/18723 | 1.94e-23 | 4.57e-21 | 305 |
| GO:0006091110 | Esophagus | ESCC | generation of precursor metabolites and energy | 331/8552 | 490/18723 | 3.86e-23 | 8.45e-21 | 331 |
| GO:0009896111 | Esophagus | ESCC | positive regulation of catabolic process | 332/8552 | 492/18723 | 4.36e-23 | 9.22e-21 | 332 |
| GO:0031331111 | Esophagus | ESCC | positive regulation of cellular catabolic process | 292/8552 | 427/18723 | 8.67e-22 | 1.53e-19 | 292 |
| GO:0045333110 | Esophagus | ESCC | cellular respiration | 173/8552 | 230/18723 | 4.53e-20 | 5.99e-18 | 173 |
| GO:1903362111 | Esophagus | ESCC | regulation of cellular protein catabolic process | 188/8552 | 255/18723 | 5.12e-20 | 6.62e-18 | 188 |
| GO:0045862111 | Esophagus | ESCC | positive regulation of proteolysis | 256/8552 | 372/18723 | 7.88e-20 | 9.43e-18 | 256 |
| GO:001050617 | Esophagus | ESCC | regulation of autophagy | 220/8552 | 317/18723 | 6.72e-18 | 6.36e-16 | 220 |
| GO:0015980110 | Esophagus | ESCC | energy derivation by oxidation of organic compounds | 220/8552 | 318/18723 | 1.20e-17 | 1.09e-15 | 220 |
| GO:1903050111 | Esophagus | ESCC | regulation of proteolysis involved in cellular protein catabolic process | 163/8552 | 221/18723 | 1.44e-17 | 1.27e-15 | 163 |
| GO:0061136111 | Esophagus | ESCC | regulation of proteasomal protein catabolic process | 142/8552 | 187/18723 | 2.40e-17 | 2.00e-15 | 142 |
| GO:0045732111 | Esophagus | ESCC | positive regulation of protein catabolic process | 167/8552 | 231/18723 | 1.47e-16 | 1.14e-14 | 167 |
| GO:0022900110 | Esophagus | ESCC | electron transport chain | 133/8552 | 175/18723 | 2.18e-16 | 1.67e-14 | 133 |
| GO:0043254111 | Esophagus | ESCC | regulation of protein-containing complex assembly | 278/8552 | 428/18723 | 3.81e-16 | 2.77e-14 | 278 |
| GO:0032434111 | Esophagus | ESCC | regulation of proteasomal ubiquitin-dependent protein catabolic process | 107/8552 | 134/18723 | 4.06e-16 | 2.93e-14 | 107 |
| GO:2000058111 | Esophagus | ESCC | regulation of ubiquitin-dependent protein catabolic process | 125/8552 | 164/18723 | 1.17e-15 | 7.76e-14 | 125 |
| Page: 1 2 3 4 5 6 7 8 9 10 11 12 13 14 15 16 17 18 19 20 21 22 23 24 25 26 |
| Pathway ID | Tissue | Disease Stage | Description | Gene Ratio | Bg Ratio | pvalue | p.adjust | qvalue | Count |
| hsa0414222 | Esophagus | ESCC | Lysosome | 102/4205 | 132/8465 | 5.11e-11 | 7.13e-10 | 3.65e-10 | 102 |
| hsa006003 | Esophagus | ESCC | Sphingolipid metabolism | 36/4205 | 53/8465 | 5.41e-03 | 1.36e-02 | 6.99e-03 | 36 |
| hsa0414232 | Esophagus | ESCC | Lysosome | 102/4205 | 132/8465 | 5.11e-11 | 7.13e-10 | 3.65e-10 | 102 |
| hsa0060012 | Esophagus | ESCC | Sphingolipid metabolism | 36/4205 | 53/8465 | 5.41e-03 | 1.36e-02 | 6.99e-03 | 36 |
| hsa041422 | Liver | HCC | Lysosome | 100/4020 | 132/8465 | 2.32e-11 | 4.31e-10 | 2.40e-10 | 100 |
| hsa00511 | Liver | HCC | Other glycan degradation | 15/4020 | 18/8465 | 1.96e-03 | 6.91e-03 | 3.84e-03 | 15 |
| hsa00600 | Liver | HCC | Sphingolipid metabolism | 34/4020 | 53/8465 | 1.06e-02 | 2.71e-02 | 1.51e-02 | 34 |
| hsa041423 | Liver | HCC | Lysosome | 100/4020 | 132/8465 | 2.32e-11 | 4.31e-10 | 2.40e-10 | 100 |
| hsa005111 | Liver | HCC | Other glycan degradation | 15/4020 | 18/8465 | 1.96e-03 | 6.91e-03 | 3.84e-03 | 15 |
| hsa006001 | Liver | HCC | Sphingolipid metabolism | 34/4020 | 53/8465 | 1.06e-02 | 2.71e-02 | 1.51e-02 | 34 |
| hsa041425 | Oral cavity | OSCC | Lysosome | 87/3704 | 132/8465 | 1.97e-07 | 1.35e-06 | 6.86e-07 | 87 |
| hsa006002 | Oral cavity | OSCC | Sphingolipid metabolism | 33/3704 | 53/8465 | 5.00e-03 | 1.20e-02 | 6.13e-03 | 33 |
| hsa0414212 | Oral cavity | OSCC | Lysosome | 87/3704 | 132/8465 | 1.97e-07 | 1.35e-06 | 6.86e-07 | 87 |
| hsa0060011 | Oral cavity | OSCC | Sphingolipid metabolism | 33/3704 | 53/8465 | 5.00e-03 | 1.20e-02 | 6.13e-03 | 33 |
| hsa0414221 | Oral cavity | LP | Lysosome | 67/2418 | 132/8465 | 5.13e-08 | 7.77e-07 | 5.01e-07 | 67 |
| hsa0414231 | Oral cavity | LP | Lysosome | 67/2418 | 132/8465 | 5.13e-08 | 7.77e-07 | 5.01e-07 | 67 |
| Page: 1 |
Top |
Cell-cell communication analysis |
| Identification of potential cell-cell interactions between two cell types and their ligand-receptor pairs for different disease states |
| Ligand | Receptor | LRpair | Pathway | Tissue | Disease Stage |
| Page: 1 |
Top |
Single-cell gene regulatory network inference analysis |
| Find out the significant the regulons (TFs) and the target genes of each regulon across cell types for different disease states |
| TF | Cell Type | Tissue | Disease Stage | Target Gene | RSS | Regulon Activity |
| ∗The dot plots of a searched regulon are shown for all cell subpopulations in each disease state of each tissue based on the regulon specific score inferred using pySCENIC and by calculating the average expression. |
| Page: 1 |
Top |
Somatic mutation of malignant transformation related genes |
| Annotation of somatic variants for genes involved in malignant transformation |
| Hugo Symbol | Variant Class | Variant Classification | dbSNP RS | HGVSc | HGVSp | HGVSp Short | SWISSPROT | BIOTYPE | SIFT | PolyPhen | Tumor Sample Barcode | Tissue | Histology | Sex | Age | Stage | Therapy Types | Drugs | Outcome |
| GBA | SNV | Missense_Mutation | c.1448N>C | p.Leu483Pro | p.L483P | P04062 | protein_coding | deleterious(0.02) | possibly_damaging(0.821) | TCGA-A2-A3XU-01 | Breast | breast invasive carcinoma | Female | <65 | I/II | Hormone Therapy | arimidex | PD | |
| GBA | SNV | Missense_Mutation | novel | c.46N>G | p.Ser16Gly | p.S16G | P04062 | protein_coding | tolerated_low_confidence(1) | benign(0) | TCGA-AQ-A7U7-01 | Breast | breast invasive carcinoma | Female | <65 | III/IV | Targeted Molecular therapy | rituximab | CR |
| GBA | SNV | Missense_Mutation | c.840N>C | p.Leu280Phe | p.L280F | P04062 | protein_coding | tolerated(0.28) | benign(0) | TCGA-C8-A278-01 | Breast | breast invasive carcinoma | Female | <65 | III/IV | Hormone Therapy | tamoxiphen | SD | |
| GBA | insertion | Frame_Shift_Ins | novel | c.232_233insATACTCTCCTATTGACTCGGACT | p.Arg78HisfsTer21 | p.R78Hfs*21 | P04062 | protein_coding | TCGA-AN-A0FT-01 | Breast | breast invasive carcinoma | Female | <65 | I/II | Unknown | Unknown | SD | ||
| GBA | SNV | Missense_Mutation | c.1072C>G | p.Pro358Ala | p.P358A | P04062 | protein_coding | deleterious(0.02) | possibly_damaging(0.732) | TCGA-VS-A958-01 | Cervix | cervical & endocervical cancer | Female | <65 | I/II | Chemotherapy | cisplatin | CR | |
| GBA | SNV | Missense_Mutation | rs759983265 | c.23N>C | p.Arg8Thr | p.R8T | P04062 | protein_coding | deleterious_low_confidence(0.05) | benign(0.007) | TCGA-VS-A9UZ-01 | Cervix | cervical & endocervical cancer | Female | <65 | I/II | Unknown | Unknown | SD |
| GBA | SNV | Missense_Mutation | rs79696831 | c.971G>A | p.Arg324His | p.R324H | P04062 | protein_coding | deleterious(0) | probably_damaging(0.998) | TCGA-AZ-6601-01 | Colorectum | colon adenocarcinoma | Male | >=65 | I/II | Unknown | Unknown | PD |
| GBA | SNV | Missense_Mutation | c.1342N>C | p.Asp448His | p.D448H | P04062 | protein_coding | tolerated(0.05) | benign(0.093) | TCGA-EI-6882-01 | Colorectum | rectum adenocarcinoma | Male | <65 | I/II | Unknown | Unknown | SD | |
| GBA | SNV | Missense_Mutation | c.1300N>T | p.Arg434Cys | p.R434C | P04062 | protein_coding | deleterious(0) | possibly_damaging(0.647) | TCGA-A5-A0G2-01 | Endometrium | uterine corpus endometrioid carcinoma | Female | <65 | III/IV | Unknown | Unknown | SD | |
| GBA | SNV | Missense_Mutation | c.688N>A | p.Val230Met | p.V230M | P04062 | protein_coding | tolerated(0.84) | benign(0.011) | TCGA-A5-A0GW-01 | Endometrium | uterine corpus endometrioid carcinoma | Female | <65 | I/II | Unknown | Unknown | SD |
| Page: 1 2 3 4 5 6 |
Top |
Related drugs of malignant transformation related genes |
| Identification of chemicals and drugs interact with genes involved in malignant transfromation |
| (DGIdb 4.0) |
| Entrez ID | Symbol | Category | Interaction Types | Drug Claim Name | Drug Name | PMIDs |
| 2629 | GBA | DRUGGABLE GENOME, ENZYME | GNF-PF-4085 | CHEMBL528181 | ||
| 2629 | GBA | DRUGGABLE GENOME, ENZYME | APTIGANEL HYDROCHLORIDE | APTIGANEL HYDROCHLORIDE | ||
| 2629 | GBA | DRUGGABLE GENOME, ENZYME | AFEGOSTAT | AFEGOSTAT | 21250698 | |
| 2629 | GBA | DRUGGABLE GENOME, ENZYME | 404859139 | AMBROXOL | ||
| 2629 | GBA | DRUGGABLE GENOME, ENZYME | SJ000170251 | CHEMBL603154 | ||
| 2629 | GBA | DRUGGABLE GENOME, ENZYME | GENISTEIN | GENISTEIN | ||
| 2629 | GBA | DRUGGABLE GENOME, ENZYME | SULFANITRAN | SULFANITRAN | ||
| 2629 | GBA | DRUGGABLE GENOME, ENZYME | CHLORHEXIDINE | CHLORHEXIDINE | ||
| 2629 | GBA | DRUGGABLE GENOME, ENZYME | DNDI1417773 | CHEMBL1379900 | ||
| 2629 | GBA | DRUGGABLE GENOME, ENZYME | GNF-PF-2094 | CHEMBL578928 |
| Page: 1 2 3 4 |

Copyright 2023-Present -The University of Texas Health Science Center at Houston |