
|
|||||
|
 | |
| |
| |
| |
| |
| |
|
Gene: GATM |
Gene summary for GATM |
| Gene information | Species | Human | Gene symbol | GATM | Gene ID | 2628 |
| Gene name | glycine amidinotransferase | |
| Gene Alias | AGAT | |
| Cytomap | 15q21.1 | |
| Gene Type | protein-coding | GO ID | GO:0001659 | UniProtAcc | A0A140VK19 |
Top |
Malignant transformation analysis |
| Identification of the aberrant gene expression in precancerous and cancerous lesions by comparing the gene expression of stem-like cells in diseased tissues with normal stem cells |
| Entrez ID | Symbol | Replicates | Species | Organ | Tissue | Adj P-value | Log2FC | Malignancy |
| 2628 | GATM | HTA11_99999970781_79442 | Human | Colorectum | MSS | 2.33e-43 | 1.15e+00 | 0.294 |
| 2628 | GATM | HTA11_99999965062_69753 | Human | Colorectum | MSI-H | 2.84e-05 | 7.34e-01 | 0.3487 |
| 2628 | GATM | LZE4T | Human | Esophagus | ESCC | 3.72e-02 | -5.69e-02 | 0.0811 |
| 2628 | GATM | P2T-E | Human | Esophagus | ESCC | 3.74e-07 | -6.31e-02 | 0.1177 |
| 2628 | GATM | P4T-E | Human | Esophagus | ESCC | 2.16e-21 | 8.81e-01 | 0.1323 |
| 2628 | GATM | P5T-E | Human | Esophagus | ESCC | 9.72e-06 | -8.13e-02 | 0.1327 |
| 2628 | GATM | P8T-E | Human | Esophagus | ESCC | 6.98e-09 | 1.83e-01 | 0.0889 |
| 2628 | GATM | P12T-E | Human | Esophagus | ESCC | 1.03e-61 | 1.99e+00 | 0.1122 |
| 2628 | GATM | P15T-E | Human | Esophagus | ESCC | 7.66e-05 | 9.27e-03 | 0.1149 |
| 2628 | GATM | P16T-E | Human | Esophagus | ESCC | 3.33e-09 | 3.71e-03 | 0.1153 |
| 2628 | GATM | P19T-E | Human | Esophagus | ESCC | 1.85e-02 | 4.60e-01 | 0.1662 |
| 2628 | GATM | P20T-E | Human | Esophagus | ESCC | 9.03e-09 | 2.29e-01 | 0.1124 |
| 2628 | GATM | P23T-E | Human | Esophagus | ESCC | 1.05e-03 | 2.37e-01 | 0.108 |
| 2628 | GATM | P24T-E | Human | Esophagus | ESCC | 4.42e-09 | -9.33e-03 | 0.1287 |
| 2628 | GATM | P26T-E | Human | Esophagus | ESCC | 1.23e-46 | 1.34e+00 | 0.1276 |
| 2628 | GATM | P27T-E | Human | Esophagus | ESCC | 1.48e-14 | 3.90e-01 | 0.1055 |
| 2628 | GATM | P28T-E | Human | Esophagus | ESCC | 7.62e-06 | 9.70e-02 | 0.1149 |
| 2628 | GATM | P31T-E | Human | Esophagus | ESCC | 2.89e-02 | -1.43e-01 | 0.1251 |
| 2628 | GATM | P32T-E | Human | Esophagus | ESCC | 1.36e-03 | -1.17e-01 | 0.1666 |
| 2628 | GATM | P36T-E | Human | Esophagus | ESCC | 3.20e-02 | 2.94e-02 | 0.1187 |
| Page: 1 2 3 4 5 |
| Tissue | Expression Dynamics | Abbreviation |
| Colorectum (GSE201348) |  | FAP: Familial adenomatous polyposis |
| CRC: Colorectal cancer | ||
| Colorectum (HTA11) |  | AD: Adenomas |
| SER: Sessile serrated lesions | ||
| MSI-H: Microsatellite-high colorectal cancer | ||
| MSS: Microsatellite stable colorectal cancer | ||
| Esophagus | 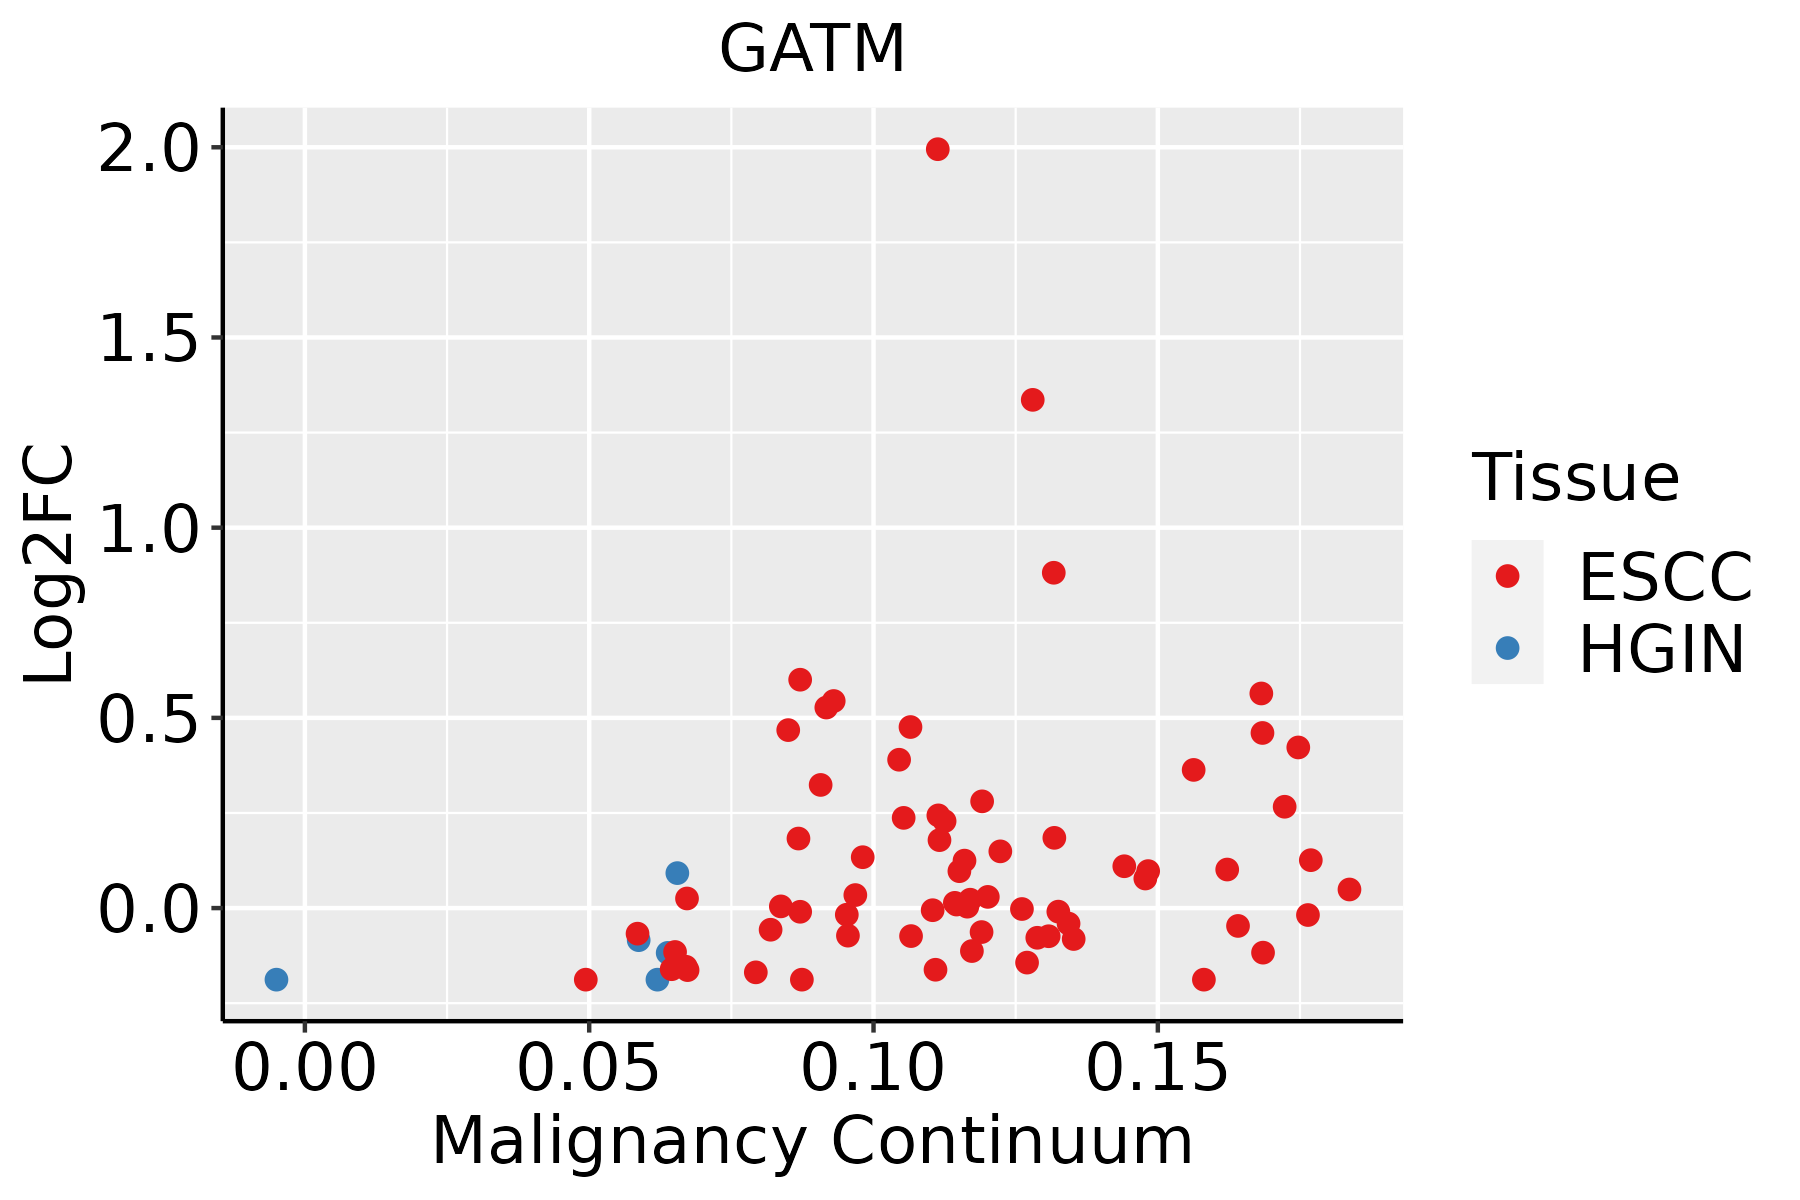 | ESCC: Esophageal squamous cell carcinoma |
| HGIN: High-grade intraepithelial neoplasias | ||
| LGIN: Low-grade intraepithelial neoplasias | ||
| Liver |  | HCC: Hepatocellular carcinoma |
| NAFLD: Non-alcoholic fatty liver disease | ||
| Oral Cavity | 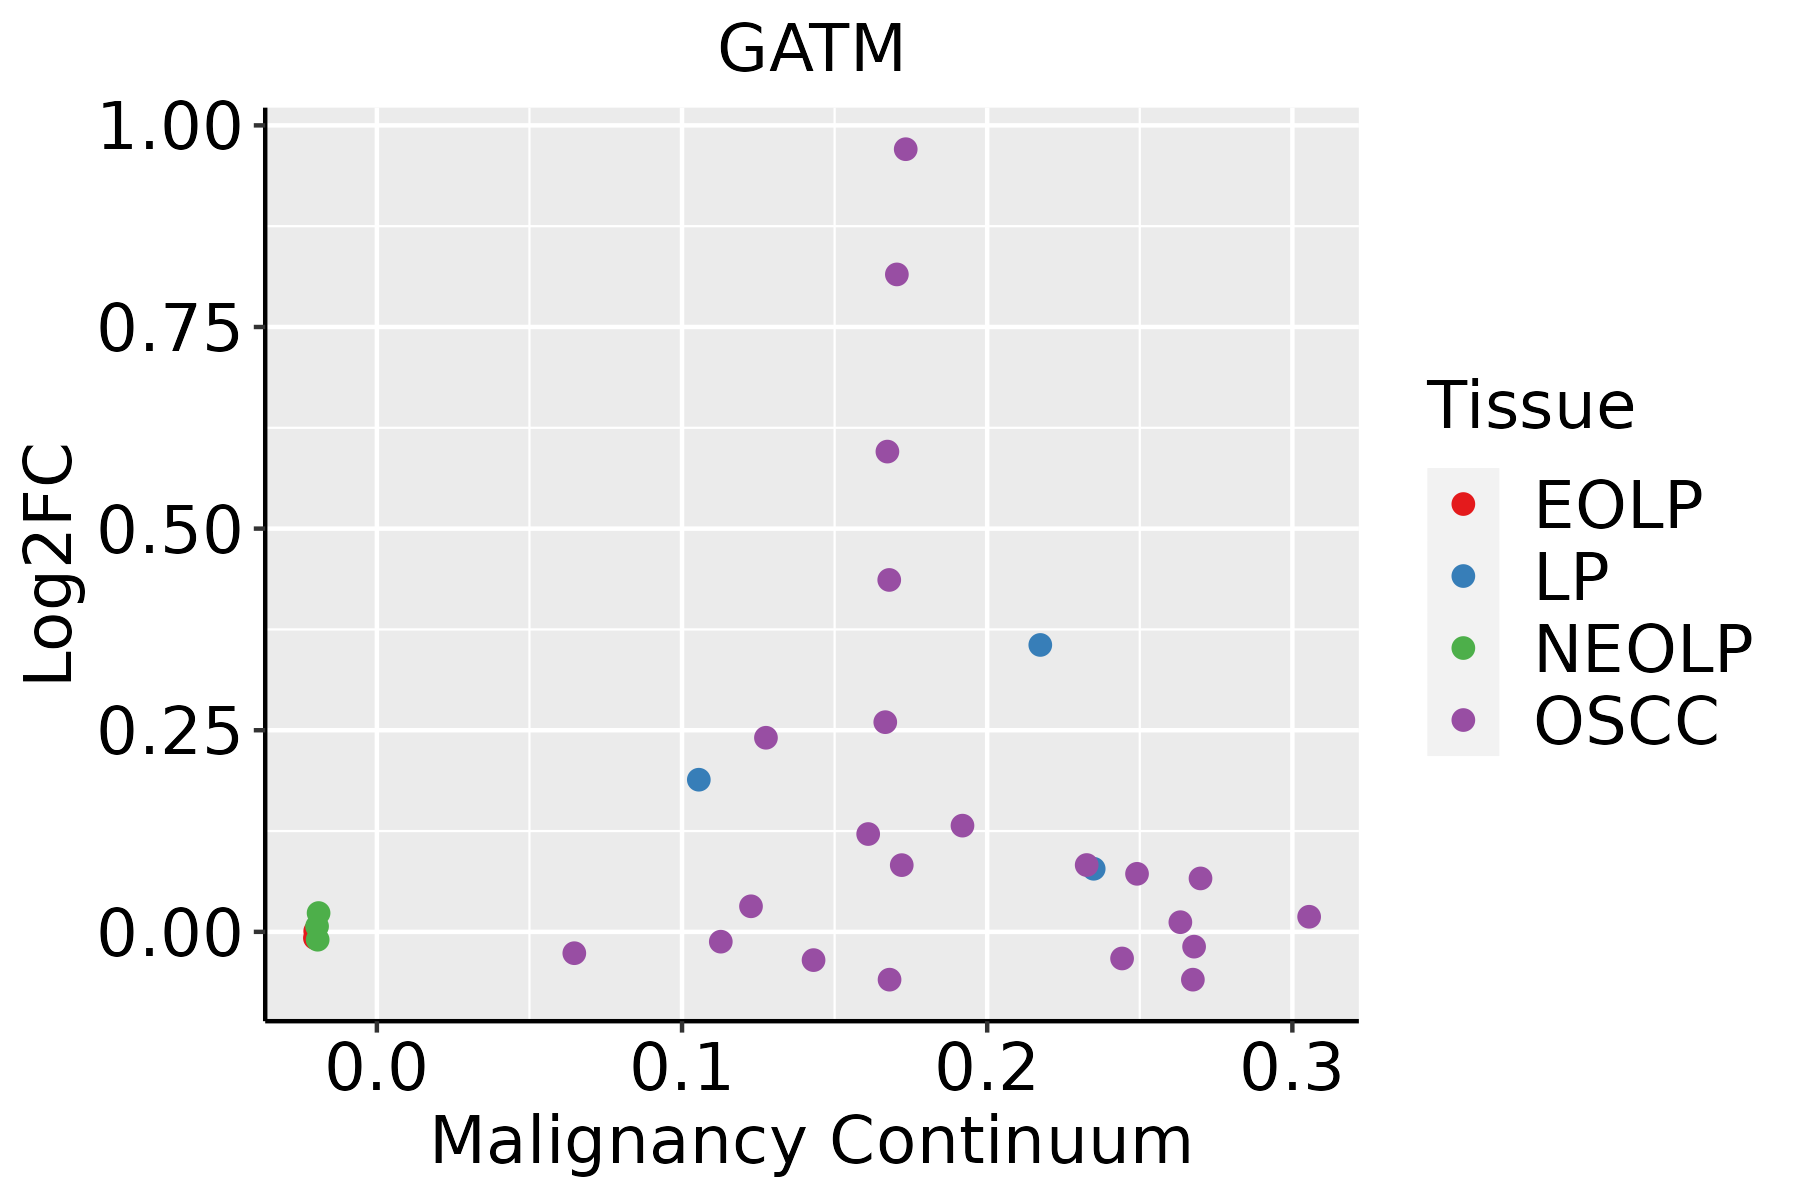 | EOLP: Erosive Oral lichen planus |
| LP: leukoplakia | ||
| NEOLP: Non-erosive oral lichen planus | ||
| OSCC: Oral squamous cell carcinoma | ||
| Skin | 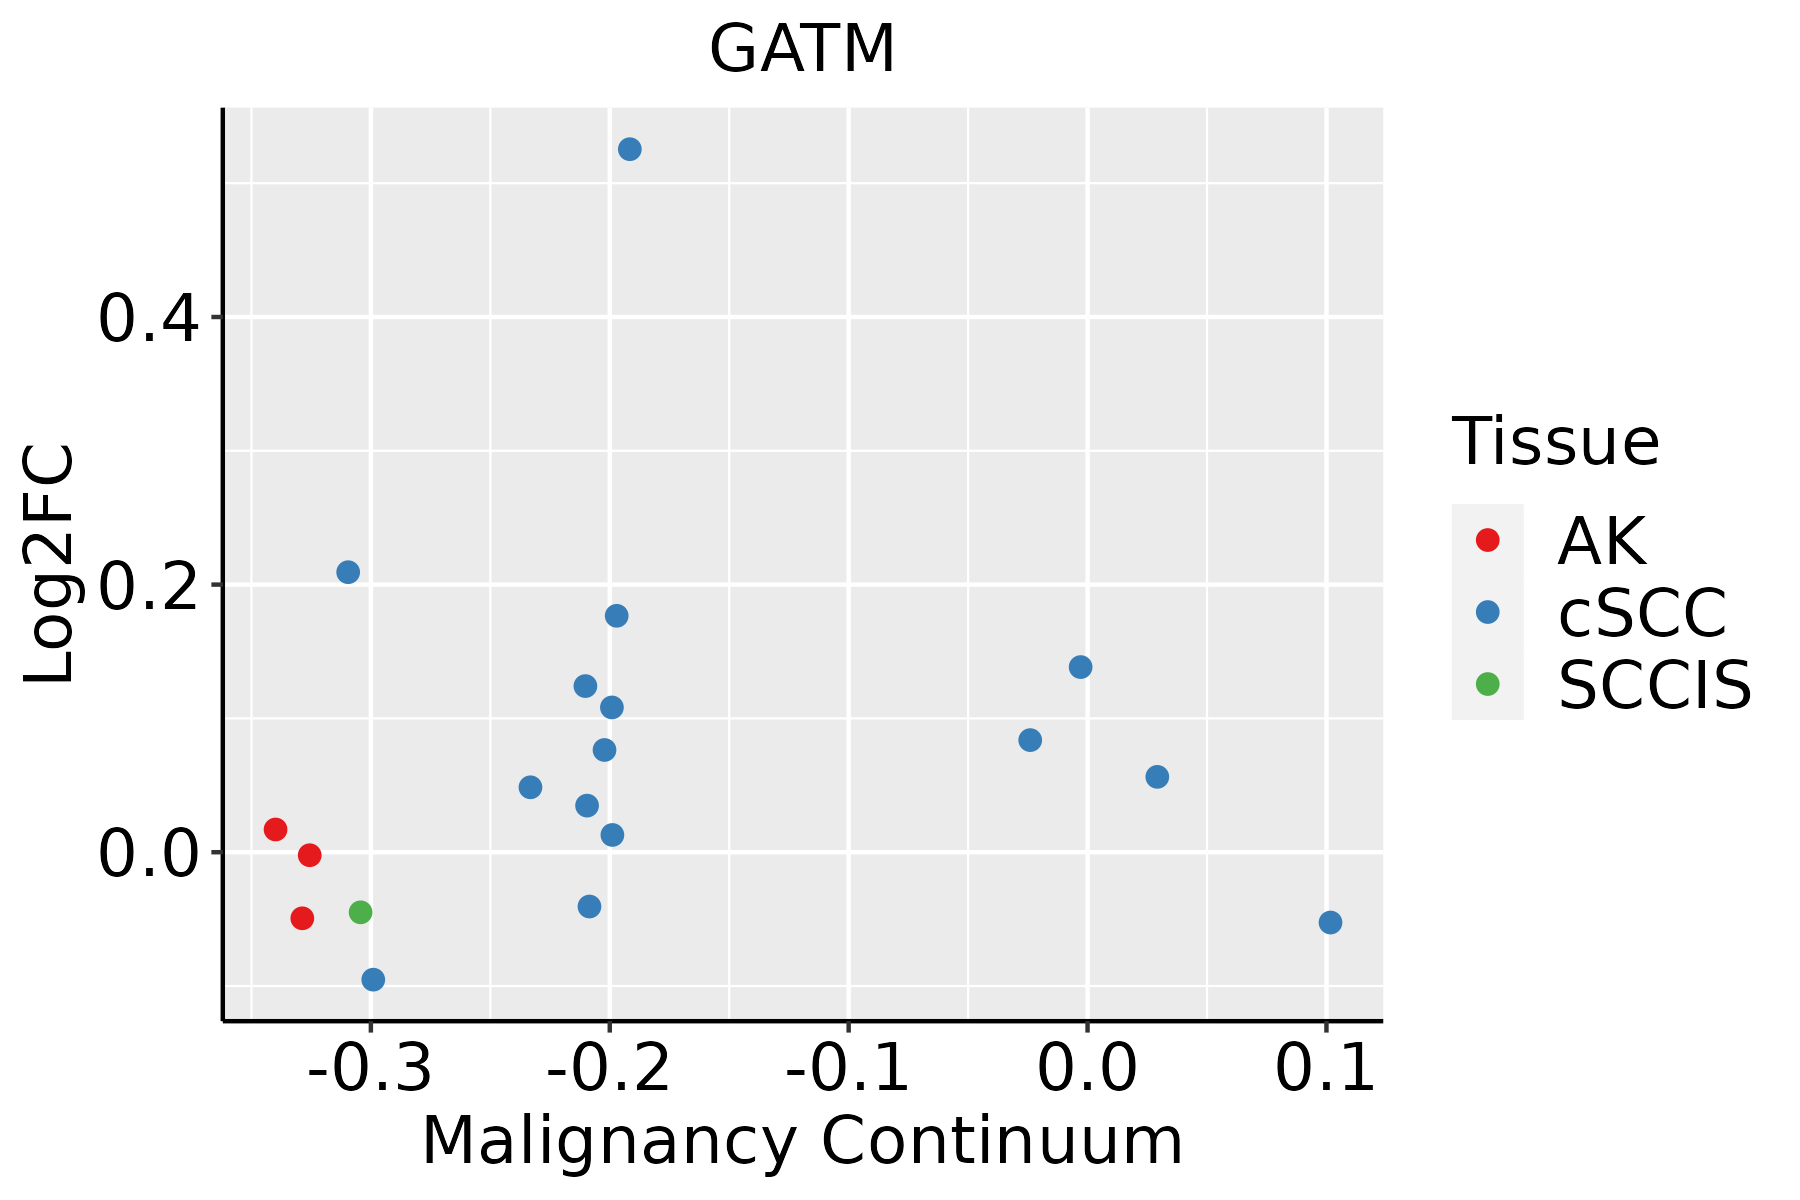 | AK: Actinic keratosis |
| cSCC: Cutaneous squamous cell carcinoma | ||
| SCCIS:squamous cell carcinoma in situ |
| ∗log2FC in expression of this searched gene in stem-like cells from each diseased tissue sample relative to stem-like cells in normal samples in each tissue plotted against the malignancy continuum. Samples are colored based on if they are from different disease stage. |
Top |
Malignant transformation related pathway analysis |
| Find out the enriched GO biological processes and KEGG pathways involved in transition from healthy to precancer to cancer |
| Tissue | Disease Stage | Enriched GO biological Processes |
| Colorectum | AD |  |
| Colorectum | SER |  |
| Colorectum | MSS |  |
| Colorectum | MSI-H |  |
| Colorectum | FAP |  |
| ∗Top 15 enriched GO BP terms are showed in the bar plot of each disease state in each tissue. Each row represents a significant GO biological process which is colored according to the -log10(p.adjust). |
| Page: 1 2 3 4 5 6 7 8 9 |
| GO ID | Tissue | Disease Stage | Description | Gene Ratio | Bg Ratio | pvalue | p.adjust | Count |
| GO:00423981 | Colorectum | MSS | cellular modified amino acid biosynthetic process | 20/3467 | 46/18723 | 8.26e-05 | 1.35e-03 | 20 |
| GO:00065751 | Colorectum | MSS | cellular modified amino acid metabolic process | 55/3467 | 188/18723 | 2.16e-04 | 3.01e-03 | 55 |
| GO:00030121 | Colorectum | MSS | muscle system process | 105/3467 | 452/18723 | 6.39e-03 | 4.26e-02 | 105 |
| GO:0046394 | Colorectum | MSS | carboxylic acid biosynthetic process | 76/3467 | 314/18723 | 6.71e-03 | 4.38e-02 | 76 |
| GO:0016053 | Colorectum | MSS | organic acid biosynthetic process | 76/3467 | 316/18723 | 7.88e-03 | 4.84e-02 | 76 |
| GO:00423982 | Colorectum | MSI-H | cellular modified amino acid biosynthetic process | 10/1319 | 46/18723 | 1.14e-03 | 1.90e-02 | 10 |
| GO:00065752 | Colorectum | MSI-H | cellular modified amino acid metabolic process | 25/1319 | 188/18723 | 1.61e-03 | 2.39e-02 | 25 |
| GO:00463941 | Colorectum | MSI-H | carboxylic acid biosynthetic process | 36/1319 | 314/18723 | 2.68e-03 | 3.48e-02 | 36 |
| GO:00160531 | Colorectum | MSI-H | organic acid biosynthetic process | 36/1319 | 316/18723 | 2.98e-03 | 3.78e-02 | 36 |
| GO:00065757 | Esophagus | ESCC | cellular modified amino acid metabolic process | 112/8552 | 188/18723 | 8.31e-05 | 6.06e-04 | 112 |
| GO:00423986 | Esophagus | ESCC | cellular modified amino acid biosynthetic process | 34/8552 | 46/18723 | 9.39e-05 | 6.70e-04 | 34 |
| GO:00463948 | Esophagus | ESCC | carboxylic acid biosynthetic process | 175/8552 | 314/18723 | 1.98e-04 | 1.26e-03 | 175 |
| GO:00160538 | Esophagus | ESCC | organic acid biosynthetic process | 175/8552 | 316/18723 | 3.04e-04 | 1.82e-03 | 175 |
| GO:01201624 | Esophagus | ESCC | positive regulation of cold-induced thermogenesis | 57/8552 | 97/18723 | 6.43e-03 | 2.35e-02 | 57 |
| GO:01061066 | Esophagus | ESCC | cold-induced thermogenesis | 80/8552 | 144/18723 | 1.07e-02 | 3.65e-02 | 80 |
| GO:01201616 | Esophagus | ESCC | regulation of cold-induced thermogenesis | 80/8552 | 144/18723 | 1.07e-02 | 3.65e-02 | 80 |
| GO:00160535 | Liver | NAFLD | organic acid biosynthetic process | 77/1882 | 316/18723 | 1.03e-13 | 6.69e-11 | 77 |
| GO:00463945 | Liver | NAFLD | carboxylic acid biosynthetic process | 75/1882 | 314/18723 | 6.37e-13 | 3.39e-10 | 75 |
| GO:00723303 | Liver | NAFLD | monocarboxylic acid biosynthetic process | 46/1882 | 214/18723 | 5.06e-07 | 3.07e-05 | 46 |
| GO:19908452 | Liver | NAFLD | adaptive thermogenesis | 28/1882 | 157/18723 | 1.91e-03 | 1.93e-02 | 28 |
| Page: 1 2 3 |
| Pathway ID | Tissue | Disease Stage | Description | Gene Ratio | Bg Ratio | pvalue | p.adjust | qvalue | Count |
| hsa003304 | Colorectum | MSS | Arginine and proline metabolism | 23/1875 | 50/8465 | 1.52e-04 | 1.24e-03 | 7.61e-04 | 23 |
| hsa003305 | Colorectum | MSS | Arginine and proline metabolism | 23/1875 | 50/8465 | 1.52e-04 | 1.24e-03 | 7.61e-04 | 23 |
| hsa00260 | Liver | Cirrhotic | Glycine, serine and threonine metabolism | 22/2530 | 40/8465 | 7.85e-04 | 4.51e-03 | 2.78e-03 | 22 |
| hsa003308 | Liver | Cirrhotic | Arginine and proline metabolism | 25/2530 | 50/8465 | 2.18e-03 | 9.41e-03 | 5.80e-03 | 25 |
| hsa002601 | Liver | Cirrhotic | Glycine, serine and threonine metabolism | 22/2530 | 40/8465 | 7.85e-04 | 4.51e-03 | 2.78e-03 | 22 |
| hsa0033011 | Liver | Cirrhotic | Arginine and proline metabolism | 25/2530 | 50/8465 | 2.18e-03 | 9.41e-03 | 5.80e-03 | 25 |
| Page: 1 |
Top |
Cell-cell communication analysis |
| Identification of potential cell-cell interactions between two cell types and their ligand-receptor pairs for different disease states |
| Ligand | Receptor | LRpair | Pathway | Tissue | Disease Stage |
| Page: 1 |
Top |
Single-cell gene regulatory network inference analysis |
| Find out the significant the regulons (TFs) and the target genes of each regulon across cell types for different disease states |
| TF | Cell Type | Tissue | Disease Stage | Target Gene | RSS | Regulon Activity |
| ∗The dot plots of a searched regulon are shown for all cell subpopulations in each disease state of each tissue based on the regulon specific score inferred using pySCENIC and by calculating the average expression. |
| Page: 1 |
Top |
Somatic mutation of malignant transformation related genes |
| Annotation of somatic variants for genes involved in malignant transformation |
| Hugo Symbol | Variant Class | Variant Classification | dbSNP RS | HGVSc | HGVSp | HGVSp Short | SWISSPROT | BIOTYPE | SIFT | PolyPhen | Tumor Sample Barcode | Tissue | Histology | Sex | Age | Stage | Therapy Types | Drugs | Outcome |
| GATM | SNV | Missense_Mutation | c.377N>T | p.Glu126Val | p.E126V | P50440 | protein_coding | deleterious(0) | probably_damaging(0.953) | TCGA-A2-A0YG-01 | Breast | breast invasive carcinoma | Female | <65 | III/IV | Chemotherapy | cytoxan | SD | |
| GATM | SNV | Missense_Mutation | c.856N>T | p.Ala286Ser | p.A286S | P50440 | protein_coding | tolerated(0.07) | benign(0.007) | TCGA-AN-A0AT-01 | Breast | breast invasive carcinoma | Female | <65 | I/II | Unknown | Unknown | SD | |
| GATM | SNV | Missense_Mutation | c.785G>T | p.Gly262Val | p.G262V | P50440 | protein_coding | deleterious(0) | probably_damaging(1) | TCGA-B6-A0RS-01 | Breast | breast invasive carcinoma | Female | <65 | I/II | Unknown | Unknown | PD | |
| GATM | deletion | Frame_Shift_Del | novel | c.326delN | p.Lys109SerfsTer12 | p.K109Sfs*12 | P50440 | protein_coding | TCGA-D8-A27V-01 | Breast | breast invasive carcinoma | Female | <65 | I/II | Hormone Therapy | tamoxiphen | SD | ||
| GATM | SNV | Missense_Mutation | c.77N>A | p.Arg26Gln | p.R26Q | P50440 | protein_coding | tolerated_low_confidence(0.24) | benign(0.123) | TCGA-VS-AA62-01 | Cervix | cervical & endocervical cancer | Female | <65 | I/II | Chemotherapy | cisplatin | PD | |
| GATM | SNV | Missense_Mutation | c.1207N>A | p.Gly403Arg | p.G403R | P50440 | protein_coding | deleterious(0) | probably_damaging(1) | TCGA-AA-3710-01 | Colorectum | colon adenocarcinoma | Female | >=65 | I/II | Unknown | Unknown | SD | |
| GATM | SNV | Missense_Mutation | c.614N>G | p.His205Arg | p.H205R | P50440 | protein_coding | tolerated(1) | benign(0) | TCGA-CM-6172-01 | Colorectum | colon adenocarcinoma | Female | >=65 | III/IV | Ancillary | leucovorin | SD | |
| GATM | SNV | Missense_Mutation | c.566N>A | p.Arg189His | p.R189H | P50440 | protein_coding | deleterious(0) | probably_damaging(0.999) | TCGA-G4-6588-01 | Colorectum | colon adenocarcinoma | Female | <65 | I/II | Unknown | Unknown | SD | |
| GATM | deletion | Frame_Shift_Del | c.365delN | p.Lys122ArgfsTer13 | p.K122Rfs*13 | P50440 | protein_coding | TCGA-G4-6302-01 | Colorectum | colon adenocarcinoma | Female | >=65 | I/II | Unknown | Unknown | SD | |||
| GATM | SNV | Missense_Mutation | novel | c.467N>A | p.Pro156His | p.P156H | P50440 | protein_coding | deleterious(0) | probably_damaging(0.987) | TCGA-A5-A0G2-01 | Endometrium | uterine corpus endometrioid carcinoma | Female | <65 | III/IV | Unknown | Unknown | SD |
| Page: 1 2 3 4 5 |
Top |
Related drugs of malignant transformation related genes |
| Identification of chemicals and drugs interact with genes involved in malignant transfromation |
| (DGIdb 4.0) |
| Entrez ID | Symbol | Category | Interaction Types | Drug Claim Name | Drug Name | PMIDs |
| 2628 | GATM | ENZYME, TRANSPORTER | hmg coa reductase inhibitors | |||
| 2628 | GATM | ENZYME, TRANSPORTER | simvastatin | SIMVASTATIN |
| Page: 1 |

Copyright 2023-Present -The University of Texas Health Science Center at Houston |