
|
|||||
|
 | |
| |
| |
| |
| |
| |
|
Gene: GATC |
Gene summary for GATC |
| Gene information | Species | Human | Gene symbol | GATC | Gene ID | 283459 |
| Gene name | glutamyl-tRNA amidotransferase subunit C | |
| Gene Alias | 15E1.2 | |
| Cytomap | 12q24.31 | |
| Gene Type | protein-coding | GO ID | GO:0006082 | UniProtAcc | O43716 |
Top |
Malignant transformation analysis |
| Identification of the aberrant gene expression in precancerous and cancerous lesions by comparing the gene expression of stem-like cells in diseased tissues with normal stem cells |
| Entrez ID | Symbol | Replicates | Species | Organ | Tissue | Adj P-value | Log2FC | Malignancy |
| 283459 | GATC | LZE4T | Human | Esophagus | ESCC | 6.12e-04 | 2.45e-03 | 0.0811 |
| 283459 | GATC | LZE20T | Human | Esophagus | ESCC | 7.46e-03 | -5.63e-03 | 0.0662 |
| 283459 | GATC | LZE24T | Human | Esophagus | ESCC | 1.22e-14 | 3.53e-01 | 0.0596 |
| 283459 | GATC | P1T-E | Human | Esophagus | ESCC | 8.77e-03 | 1.43e-01 | 0.0875 |
| 283459 | GATC | P2T-E | Human | Esophagus | ESCC | 1.56e-37 | 6.73e-01 | 0.1177 |
| 283459 | GATC | P4T-E | Human | Esophagus | ESCC | 3.14e-18 | 3.64e-01 | 0.1323 |
| 283459 | GATC | P5T-E | Human | Esophagus | ESCC | 3.36e-10 | 9.72e-02 | 0.1327 |
| 283459 | GATC | P8T-E | Human | Esophagus | ESCC | 2.28e-14 | 2.22e-01 | 0.0889 |
| 283459 | GATC | P9T-E | Human | Esophagus | ESCC | 3.35e-04 | 5.77e-02 | 0.1131 |
| 283459 | GATC | P10T-E | Human | Esophagus | ESCC | 4.22e-20 | 1.34e-01 | 0.116 |
| 283459 | GATC | P11T-E | Human | Esophagus | ESCC | 7.88e-06 | 1.24e-01 | 0.1426 |
| 283459 | GATC | P12T-E | Human | Esophagus | ESCC | 5.81e-11 | 9.94e-02 | 0.1122 |
| 283459 | GATC | P15T-E | Human | Esophagus | ESCC | 4.13e-10 | 6.06e-02 | 0.1149 |
| 283459 | GATC | P16T-E | Human | Esophagus | ESCC | 3.59e-22 | 2.13e-01 | 0.1153 |
| 283459 | GATC | P19T-E | Human | Esophagus | ESCC | 1.88e-05 | 4.28e-01 | 0.1662 |
| 283459 | GATC | P20T-E | Human | Esophagus | ESCC | 6.60e-12 | 1.66e-01 | 0.1124 |
| 283459 | GATC | P21T-E | Human | Esophagus | ESCC | 1.33e-18 | 4.21e-01 | 0.1617 |
| 283459 | GATC | P22T-E | Human | Esophagus | ESCC | 1.85e-12 | 1.58e-01 | 0.1236 |
| 283459 | GATC | P23T-E | Human | Esophagus | ESCC | 1.42e-12 | 2.61e-01 | 0.108 |
| 283459 | GATC | P24T-E | Human | Esophagus | ESCC | 7.81e-19 | 2.08e-01 | 0.1287 |
| Page: 1 2 3 4 |
| Tissue | Expression Dynamics | Abbreviation |
| Esophagus | 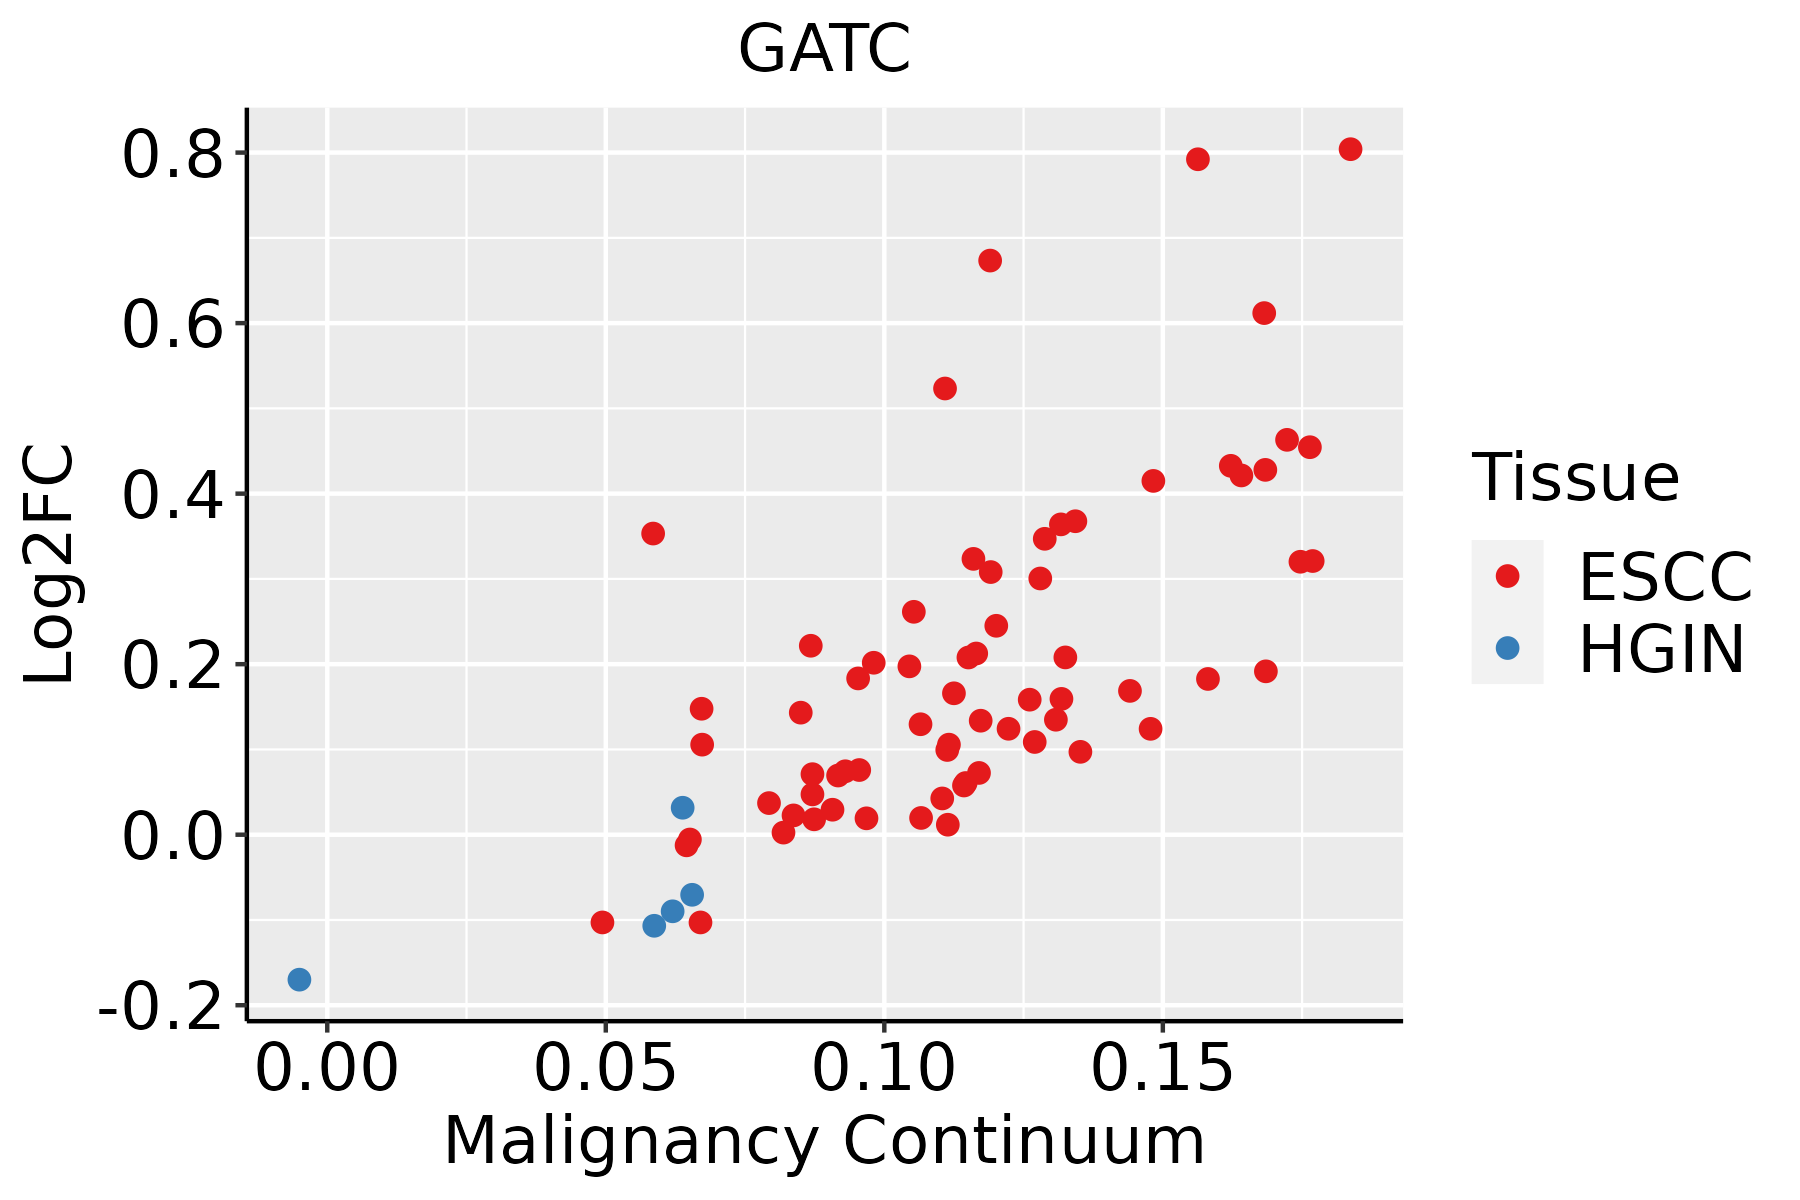 | ESCC: Esophageal squamous cell carcinoma |
| HGIN: High-grade intraepithelial neoplasias | ||
| LGIN: Low-grade intraepithelial neoplasias | ||
| Liver |  | HCC: Hepatocellular carcinoma |
| NAFLD: Non-alcoholic fatty liver disease | ||
| Oral Cavity | 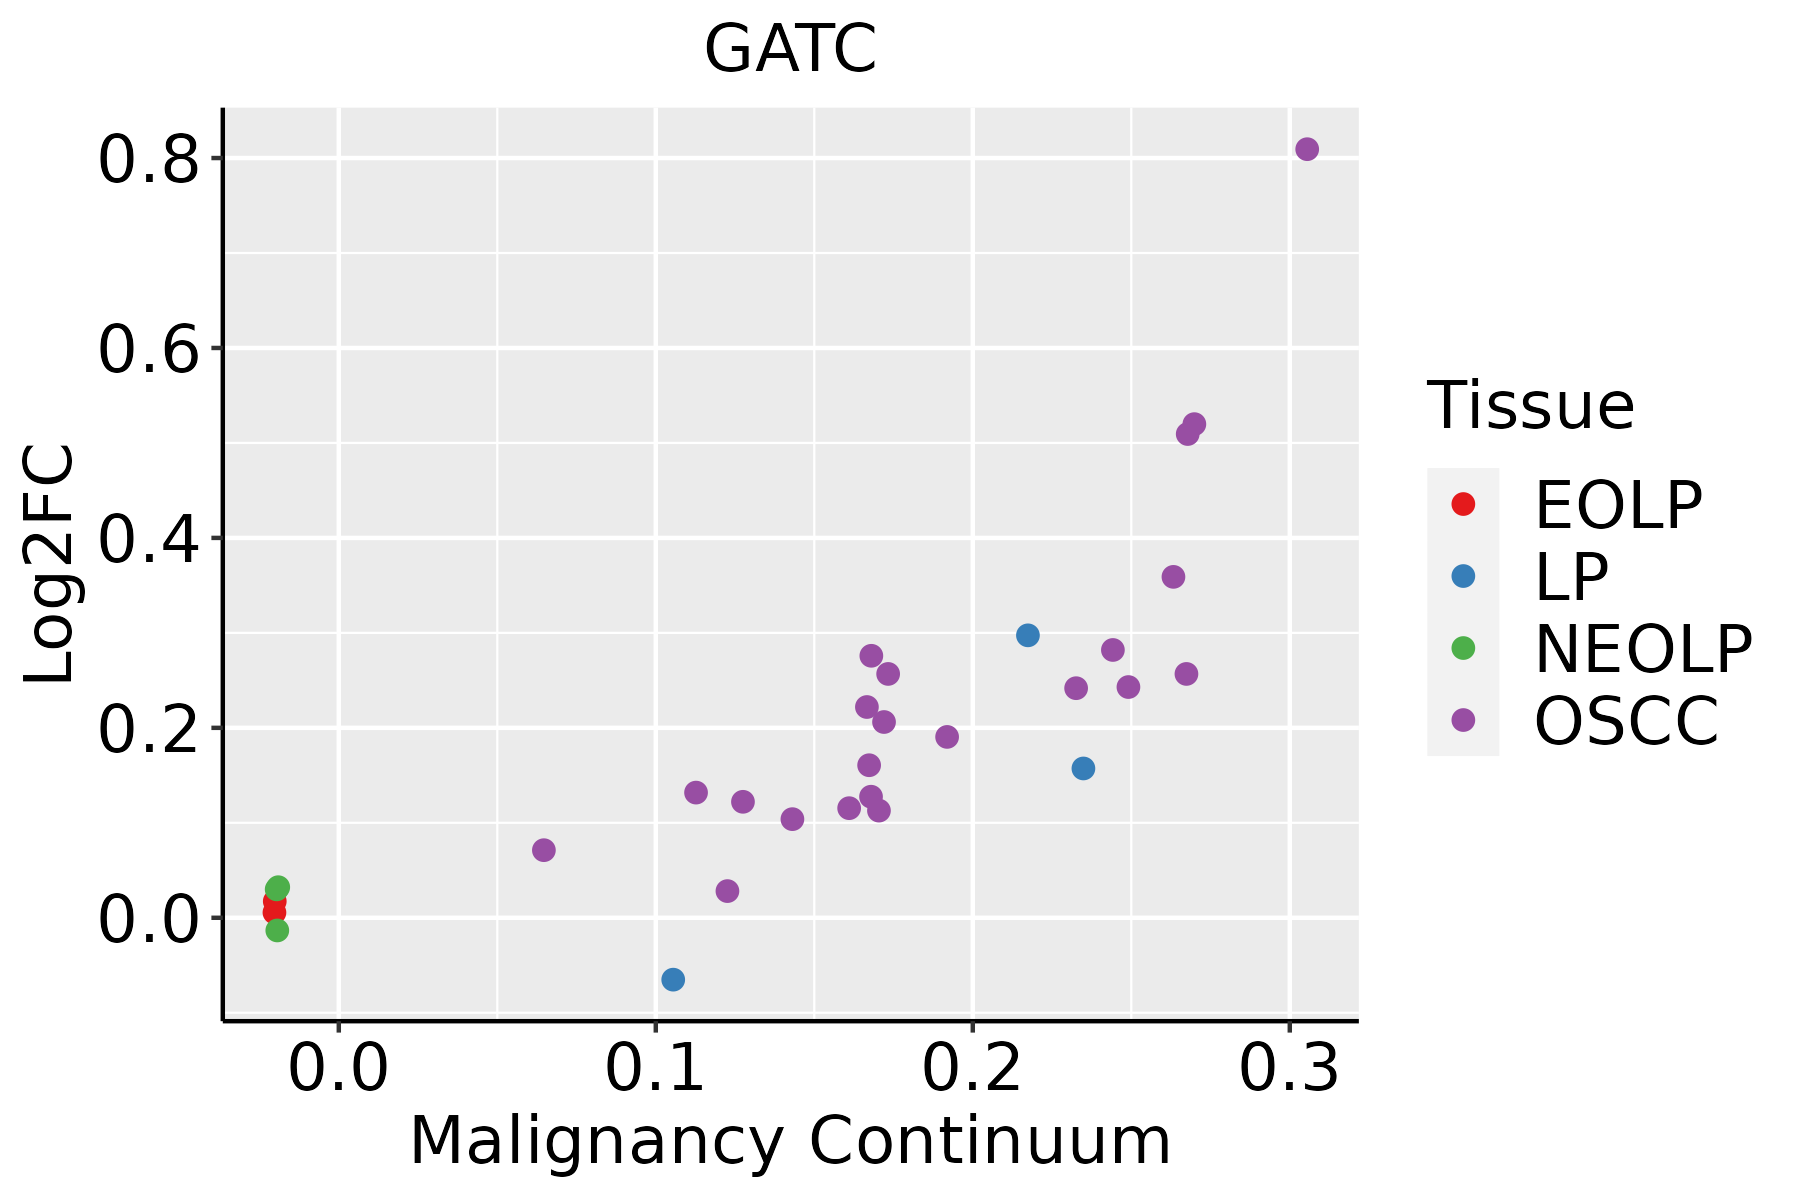 | EOLP: Erosive Oral lichen planus |
| LP: leukoplakia | ||
| NEOLP: Non-erosive oral lichen planus | ||
| OSCC: Oral squamous cell carcinoma |
| ∗log2FC in expression of this searched gene in stem-like cells from each diseased tissue sample relative to stem-like cells in normal samples in each tissue plotted against the malignancy continuum. Samples are colored based on if they are from different disease stage. |
Top |
Malignant transformation related pathway analysis |
| Find out the enriched GO biological processes and KEGG pathways involved in transition from healthy to precancer to cancer |
| Tissue | Disease Stage | Enriched GO biological Processes |
| Colorectum | AD |  |
| Colorectum | SER |  |
| Colorectum | MSS |  |
| Colorectum | MSI-H |  |
| Colorectum | FAP |  |
| ∗Top 15 enriched GO BP terms are showed in the bar plot of each disease state in each tissue. Each row represents a significant GO biological process which is colored according to the -log10(p.adjust). |
| Page: 1 2 3 4 5 6 7 8 9 |
| GO ID | Tissue | Disease Stage | Description | Gene Ratio | Bg Ratio | pvalue | p.adjust | Count |
| GO:003466012 | Esophagus | ESCC | ncRNA metabolic process | 346/8552 | 485/18723 | 4.35e-31 | 2.51e-28 | 346 |
| GO:014005313 | Esophagus | ESCC | mitochondrial gene expression | 93/8552 | 108/18723 | 1.96e-18 | 2.03e-16 | 93 |
| GO:003254314 | Esophagus | ESCC | mitochondrial translation | 68/8552 | 76/18723 | 1.02e-15 | 6.86e-14 | 68 |
| GO:00063992 | Esophagus | ESCC | tRNA metabolic process | 122/8552 | 179/18723 | 9.03e-10 | 2.19e-08 | 122 |
| GO:00346601 | Liver | HCC | ncRNA metabolic process | 332/7958 | 485/18723 | 1.48e-31 | 7.80e-29 | 332 |
| GO:01400531 | Liver | HCC | mitochondrial gene expression | 82/7958 | 108/18723 | 1.49e-12 | 7.20e-11 | 82 |
| GO:00325431 | Liver | HCC | mitochondrial translation | 62/7958 | 76/18723 | 2.95e-12 | 1.34e-10 | 62 |
| GO:00065202 | Liver | HCC | cellular amino acid metabolic process | 167/7958 | 284/18723 | 1.91e-08 | 4.56e-07 | 167 |
| GO:0006399 | Liver | HCC | tRNA metabolic process | 108/7958 | 179/18723 | 1.07e-06 | 1.59e-05 | 108 |
| GO:00346605 | Oral cavity | OSCC | ncRNA metabolic process | 296/7305 | 485/18723 | 2.94e-23 | 6.65e-21 | 296 |
| GO:01400533 | Oral cavity | OSCC | mitochondrial gene expression | 78/7305 | 108/18723 | 2.37e-12 | 9.86e-11 | 78 |
| GO:00325434 | Oral cavity | OSCC | mitochondrial translation | 59/7305 | 76/18723 | 7.21e-12 | 2.70e-10 | 59 |
| GO:00063991 | Oral cavity | OSCC | tRNA metabolic process | 101/7305 | 179/18723 | 1.65e-06 | 2.15e-05 | 101 |
| Page: 1 |
| Pathway ID | Tissue | Disease Stage | Description | Gene Ratio | Bg Ratio | pvalue | p.adjust | qvalue | Count |
| Page: 1 |
Top |
Cell-cell communication analysis |
| Identification of potential cell-cell interactions between two cell types and their ligand-receptor pairs for different disease states |
| Ligand | Receptor | LRpair | Pathway | Tissue | Disease Stage |
| Page: 1 |
Top |
Single-cell gene regulatory network inference analysis |
| Find out the significant the regulons (TFs) and the target genes of each regulon across cell types for different disease states |
| TF | Cell Type | Tissue | Disease Stage | Target Gene | RSS | Regulon Activity |
| ∗The dot plots of a searched regulon are shown for all cell subpopulations in each disease state of each tissue based on the regulon specific score inferred using pySCENIC and by calculating the average expression. |
| Page: 1 |
Top |
Somatic mutation of malignant transformation related genes |
| Annotation of somatic variants for genes involved in malignant transformation |
| Hugo Symbol | Variant Class | Variant Classification | dbSNP RS | HGVSc | HGVSp | HGVSp Short | SWISSPROT | BIOTYPE | SIFT | PolyPhen | Tumor Sample Barcode | Tissue | Histology | Sex | Age | Stage | Therapy Types | Drugs | Outcome |
| GATC | SNV | Missense_Mutation | c.269N>C | p.Arg90Thr | p.R90T | O43716 | protein_coding | deleterious(0) | probably_damaging(0.995) | TCGA-EK-A2PG-01 | Cervix | cervical & endocervical cancer | Female | >=65 | I/II | Unknown | Unknown | SD | |
| GATC | SNV | Missense_Mutation | c.292A>G | p.Asn98Asp | p.N98D | O43716 | protein_coding | tolerated(0.18) | benign(0.013) | TCGA-FU-A3HZ-01 | Cervix | cervical & endocervical cancer | Female | <65 | I/II | Chemotherapy | cisplatin | CR | |
| GATC | SNV | Missense_Mutation | c.326N>A | p.Arg109His | p.R109H | O43716 | protein_coding | tolerated(0.38) | benign(0.003) | TCGA-AJ-A3BG-01 | Endometrium | uterine corpus endometrioid carcinoma | Female | >=65 | I/II | Chemotherapy | carboplatin | PD | |
| GATC | SNV | Missense_Mutation | novel | c.11N>A | p.Arg4Gln | p.R4Q | O43716 | protein_coding | tolerated(0.07) | benign(0.015) | TCGA-KP-A3VZ-01 | Endometrium | uterine corpus endometrioid carcinoma | Female | >=65 | III/IV | Unknown | Unknown | SD |
| GATC | SNV | Missense_Mutation | c.76C>T | p.Pro26Ser | p.P26S | O43716 | protein_coding | tolerated(0.15) | benign(0.001) | TCGA-DD-A3A2-01 | Liver | liver hepatocellular carcinoma | Female | >=65 | I/II | Unknown | Unknown | SD | |
| GATC | SNV | Missense_Mutation | c.203N>T | p.Arg68Leu | p.R68L | O43716 | protein_coding | tolerated(0.45) | possibly_damaging(0.489) | TCGA-64-5779-01 | Lung | lung adenocarcinoma | Male | <65 | III/IV | Chemotherapy | cisplatin | PD | |
| GATC | SNV | Missense_Mutation | c.154G>A | p.Glu52Lys | p.E52K | O43716 | protein_coding | deleterious(0.04) | possibly_damaging(0.619) | TCGA-CN-5374-01 | Oral cavity | head & neck squamous cell carcinoma | Female | <65 | I/II | Chemotherapy | cisplatin | PD | |
| GATC | SNV | Missense_Mutation | c.326N>A | p.Arg109His | p.R109H | O43716 | protein_coding | tolerated(0.38) | benign(0.003) | TCGA-CG-4442-01 | Stomach | stomach adenocarcinoma | Male | >=65 | I/II | Unknown | Unknown | SD | |
| GATC | SNV | Missense_Mutation | novel | c.224N>G | p.Val75Gly | p.V75G | O43716 | protein_coding | deleterious(0) | probably_damaging(0.989) | TCGA-CG-5718-01 | Stomach | stomach adenocarcinoma | Female | >=65 | I/II | Unknown | Unknown | SD |
| GATC | SNV | Missense_Mutation | c.299N>T | p.Ala100Val | p.A100V | O43716 | protein_coding | tolerated(0.27) | benign(0.062) | TCGA-HF-A5NB-01 | Stomach | stomach adenocarcinoma | Female | >=65 | III/IV | Chemotherapy | fluorouracil | SD |
| Page: 1 |
Top |
Related drugs of malignant transformation related genes |
| Identification of chemicals and drugs interact with genes involved in malignant transfromation |
| (DGIdb 4.0) |
| Entrez ID | Symbol | Category | Interaction Types | Drug Claim Name | Drug Name | PMIDs |
| Page: 1 |

Copyright 2023-Present -The University of Texas Health Science Center at Houston |