
|
|||||
|
 | |
| |
| |
| |
| |
| |
|
Gene: GATAD2B |
Gene summary for GATAD2B |
| Gene information | Species | Human | Gene symbol | GATAD2B | Gene ID | 57459 |
| Gene name | GATA zinc finger domain containing 2B | |
| Gene Alias | GANDS | |
| Cytomap | 1q21.3 | |
| Gene Type | protein-coding | GO ID | GO:0000122 | UniProtAcc | Q8WXI9 |
Top |
Malignant transformation analysis |
| Identification of the aberrant gene expression in precancerous and cancerous lesions by comparing the gene expression of stem-like cells in diseased tissues with normal stem cells |
| Entrez ID | Symbol | Replicates | Species | Organ | Tissue | Adj P-value | Log2FC | Malignancy |
| 57459 | GATAD2B | CCI_1 | Human | Cervix | CC | 1.28e-15 | 1.28e+00 | 0.528 |
| 57459 | GATAD2B | CCI_2 | Human | Cervix | CC | 5.73e-10 | 1.19e+00 | 0.5249 |
| 57459 | GATAD2B | CCI_3 | Human | Cervix | CC | 1.54e-21 | 1.31e+00 | 0.516 |
| 57459 | GATAD2B | AEH-subject1 | Human | Endometrium | AEH | 1.71e-07 | 2.92e-01 | -0.3059 |
| 57459 | GATAD2B | AEH-subject4 | Human | Endometrium | AEH | 3.88e-05 | 3.81e-01 | -0.2657 |
| 57459 | GATAD2B | AEH-subject5 | Human | Endometrium | AEH | 1.71e-03 | 2.33e-01 | -0.2953 |
| 57459 | GATAD2B | EEC-subject1 | Human | Endometrium | EEC | 1.94e-08 | 3.53e-01 | -0.2682 |
| 57459 | GATAD2B | EEC-subject2 | Human | Endometrium | EEC | 3.62e-02 | 2.49e-01 | -0.2607 |
| 57459 | GATAD2B | EEC-subject3 | Human | Endometrium | EEC | 2.54e-09 | 3.43e-01 | -0.2525 |
| 57459 | GATAD2B | GSM5276934 | Human | Endometrium | EEC | 2.78e-02 | 1.72e-01 | -0.0913 |
| 57459 | GATAD2B | GSM6177620_NYU_UCEC1_lib1_lib1 | Human | Endometrium | EEC | 7.24e-04 | -2.09e-02 | -0.1869 |
| 57459 | GATAD2B | GSM6177620_NYU_UCEC1_lib2_lib2 | Human | Endometrium | EEC | 4.43e-02 | -1.86e-02 | -0.1875 |
| 57459 | GATAD2B | GSM6177620_NYU_UCEC1_lib3_lib3 | Human | Endometrium | EEC | 1.10e-07 | -5.36e-02 | -0.1883 |
| 57459 | GATAD2B | GSM6177621_NYU_UCEC2_lib1_lib1 | Human | Endometrium | EEC | 1.41e-08 | 3.08e-01 | -0.1934 |
| 57459 | GATAD2B | GSM6177622_NYU_UCEC3_lib1_lib1 | Human | Endometrium | EEC | 6.05e-11 | 1.82e-02 | -0.1917 |
| 57459 | GATAD2B | GSM6177622_NYU_UCEC3_lib2_lib2 | Human | Endometrium | EEC | 1.88e-08 | -6.62e-02 | -0.1916 |
| 57459 | GATAD2B | LZE2T | Human | Esophagus | ESCC | 1.58e-02 | 3.16e-01 | 0.082 |
| 57459 | GATAD2B | LZE4T | Human | Esophagus | ESCC | 1.31e-12 | 2.99e-01 | 0.0811 |
| 57459 | GATAD2B | LZE5T | Human | Esophagus | ESCC | 4.98e-02 | 9.36e-02 | 0.0514 |
| 57459 | GATAD2B | LZE7T | Human | Esophagus | ESCC | 2.22e-07 | 3.00e-01 | 0.0667 |
| Page: 1 2 3 4 5 6 7 8 |
| Tissue | Expression Dynamics | Abbreviation |
| Cervix |  | CC: Cervix cancer |
| HSIL_HPV: HPV-infected high-grade squamous intraepithelial lesions | ||
| N_HPV: HPV-infected normal cervix | ||
| Endometrium |  | AEH: Atypical endometrial hyperplasia |
| EEC: Endometrioid Cancer | ||
| Esophagus |  | ESCC: Esophageal squamous cell carcinoma |
| HGIN: High-grade intraepithelial neoplasias | ||
| LGIN: Low-grade intraepithelial neoplasias | ||
| Liver | 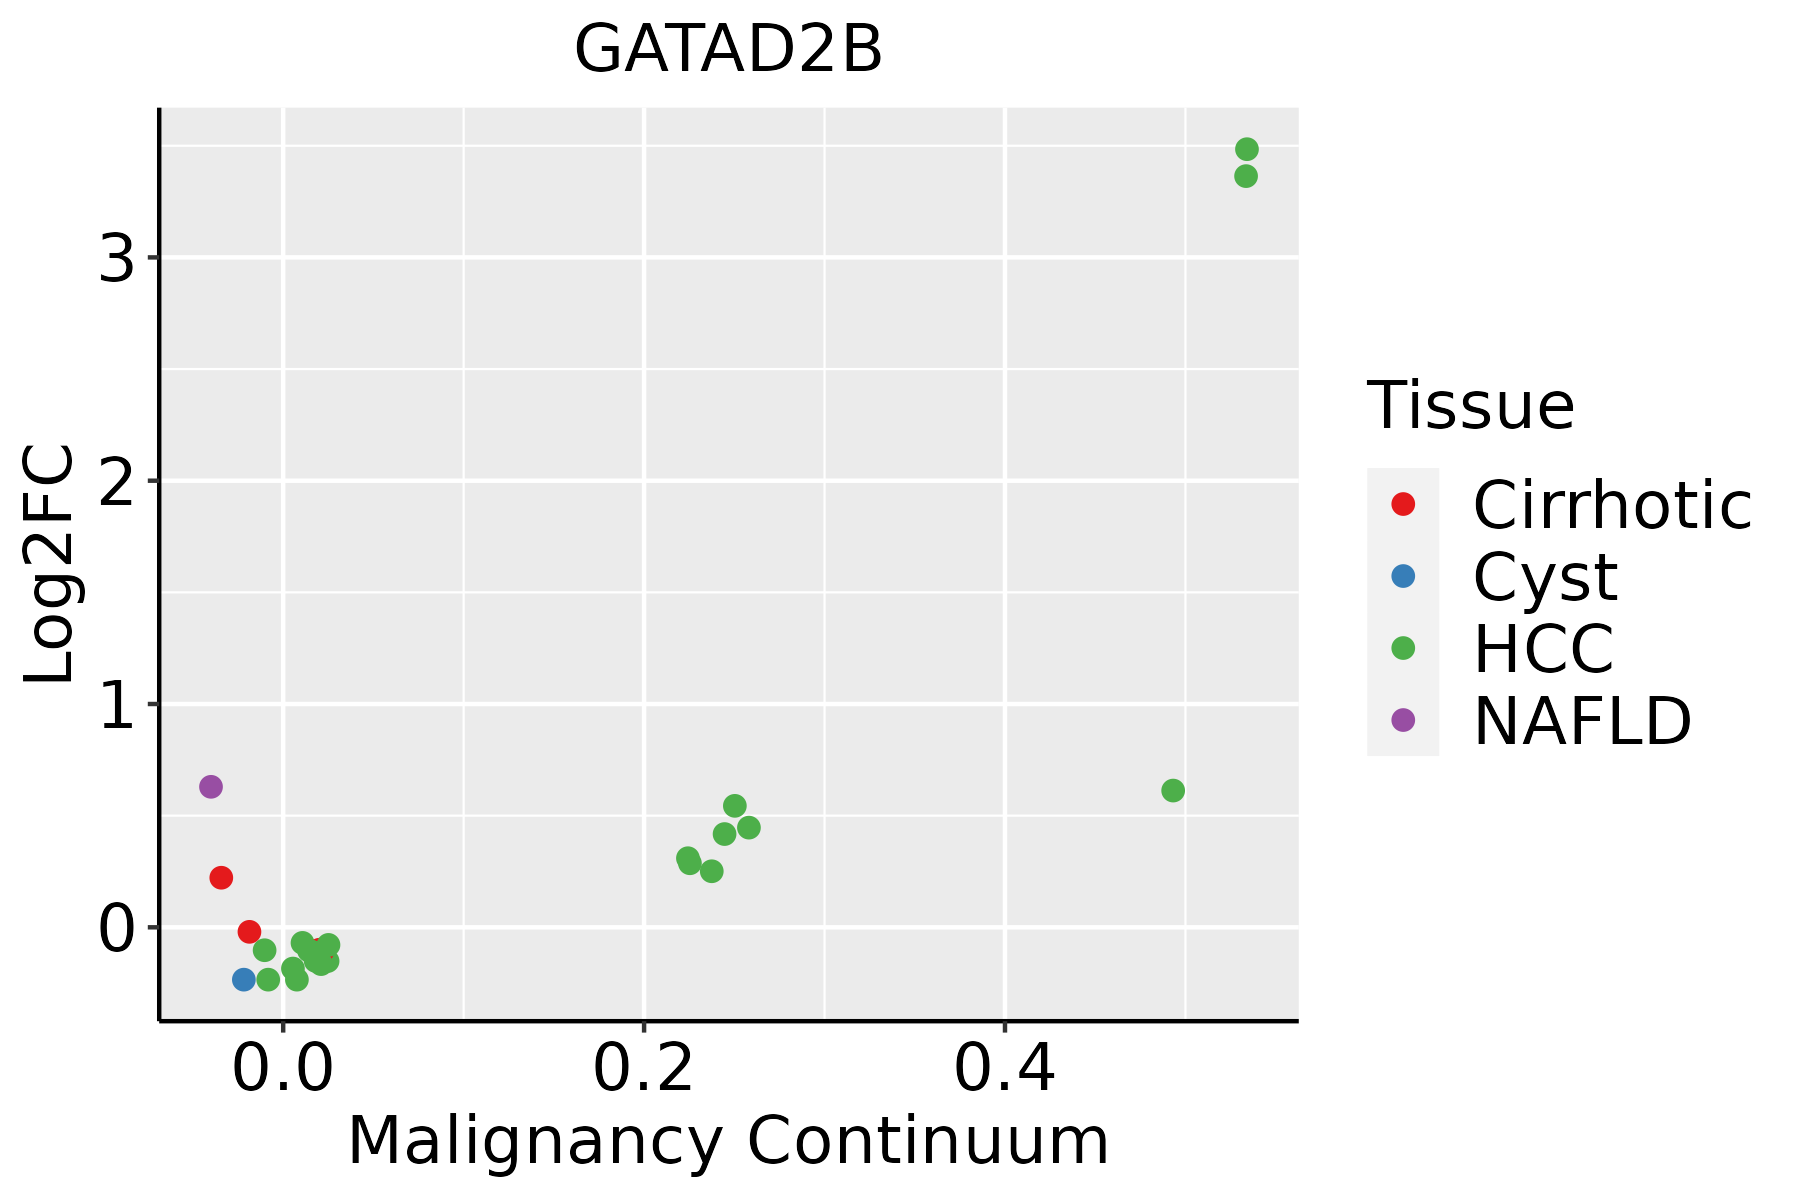 | HCC: Hepatocellular carcinoma |
| NAFLD: Non-alcoholic fatty liver disease | ||
| Lung | 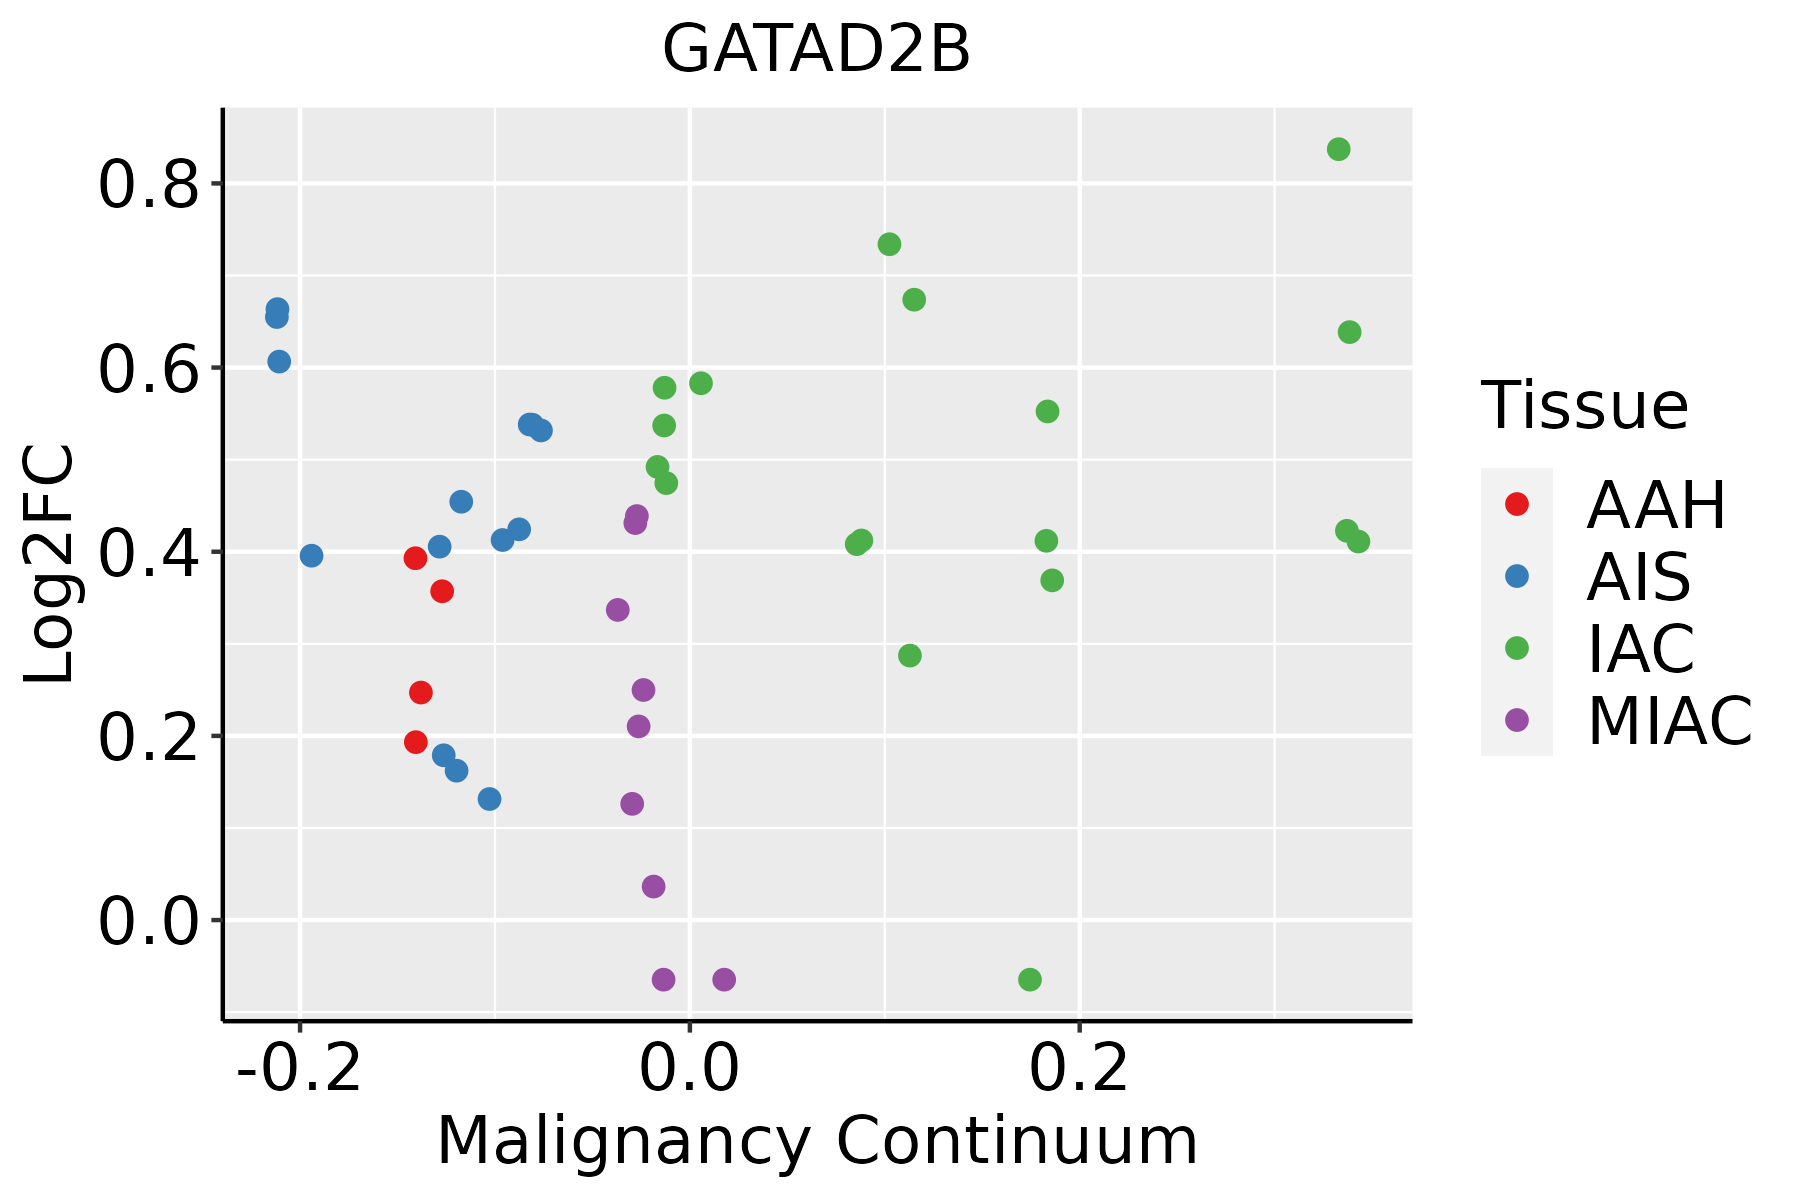 | AAH: Atypical adenomatous hyperplasia |
| AIS: Adenocarcinoma in situ | ||
| IAC: Invasive lung adenocarcinoma | ||
| MIA: Minimally invasive adenocarcinoma | ||
| Oral Cavity | 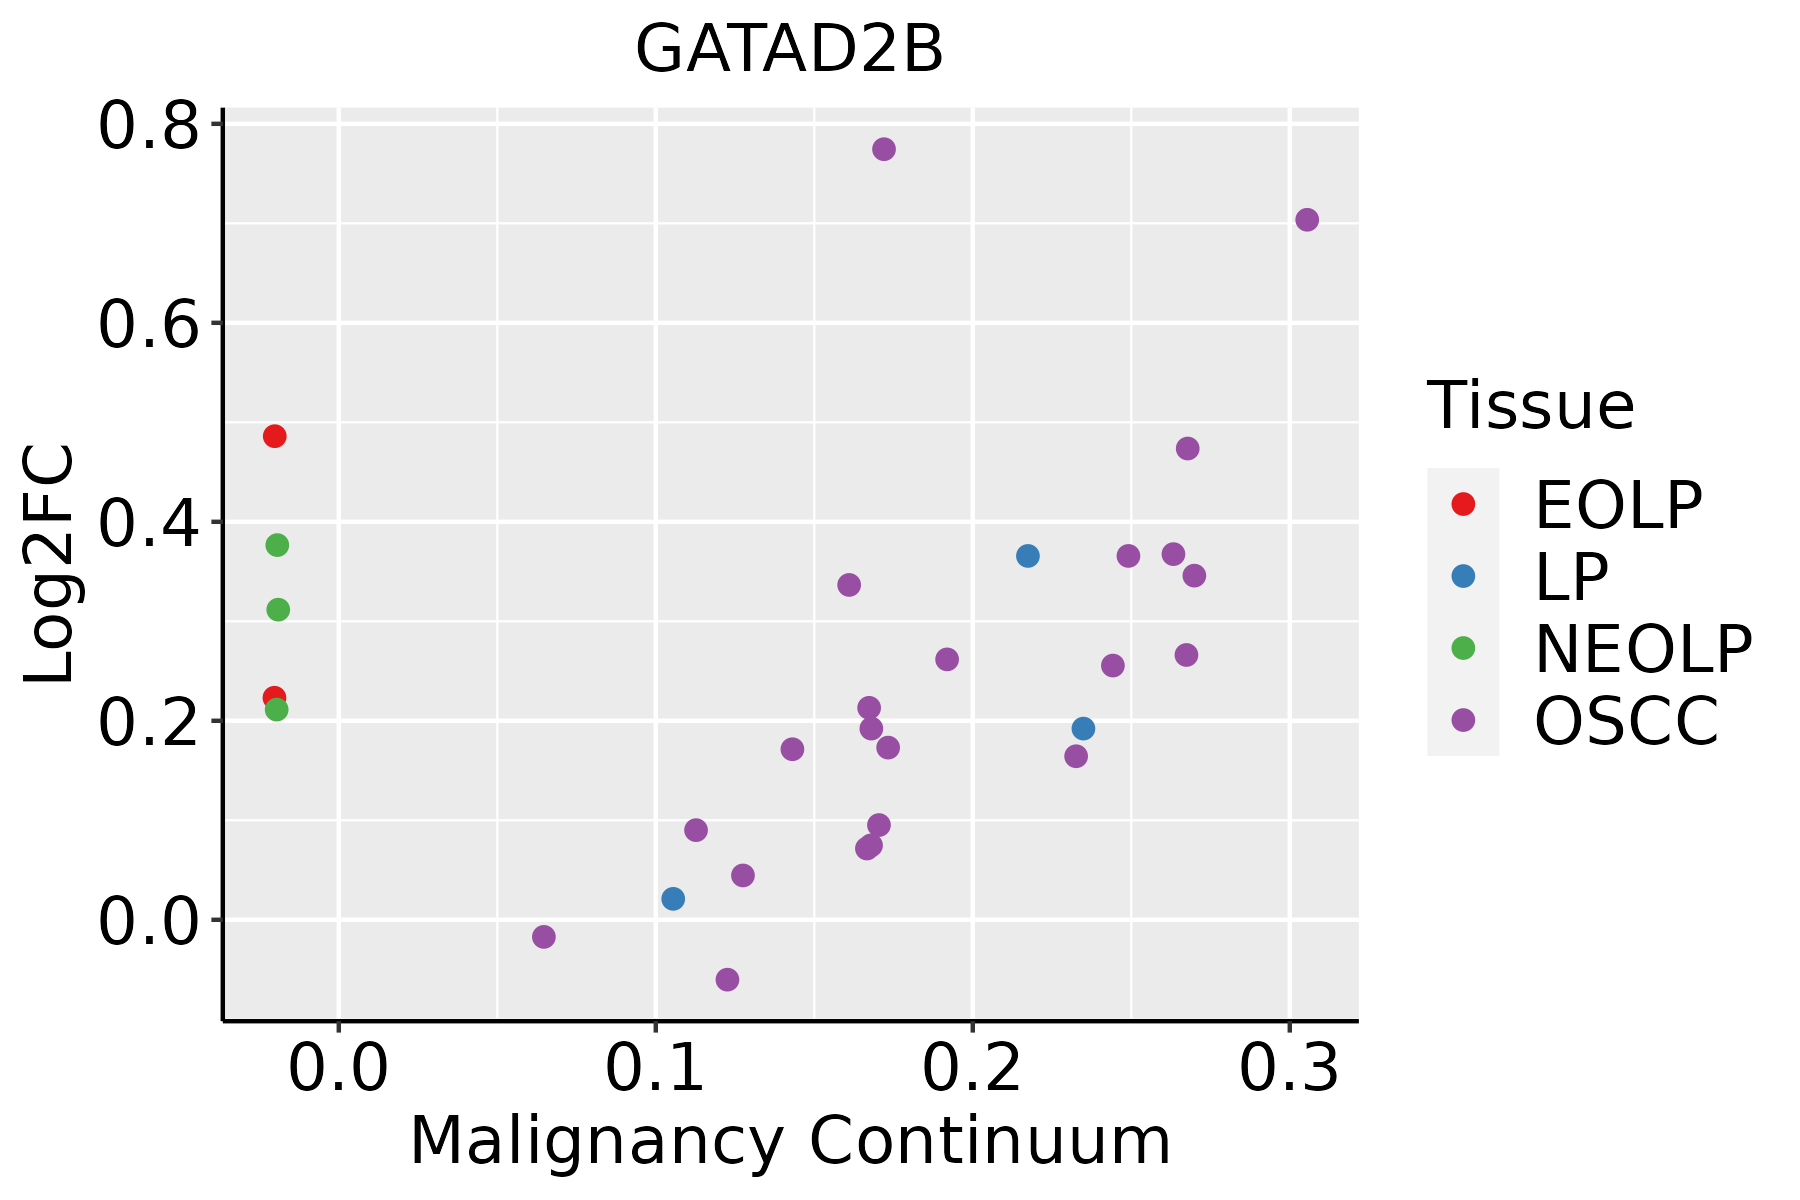 | EOLP: Erosive Oral lichen planus |
| LP: leukoplakia | ||
| NEOLP: Non-erosive oral lichen planus | ||
| OSCC: Oral squamous cell carcinoma | ||
| Prostate | 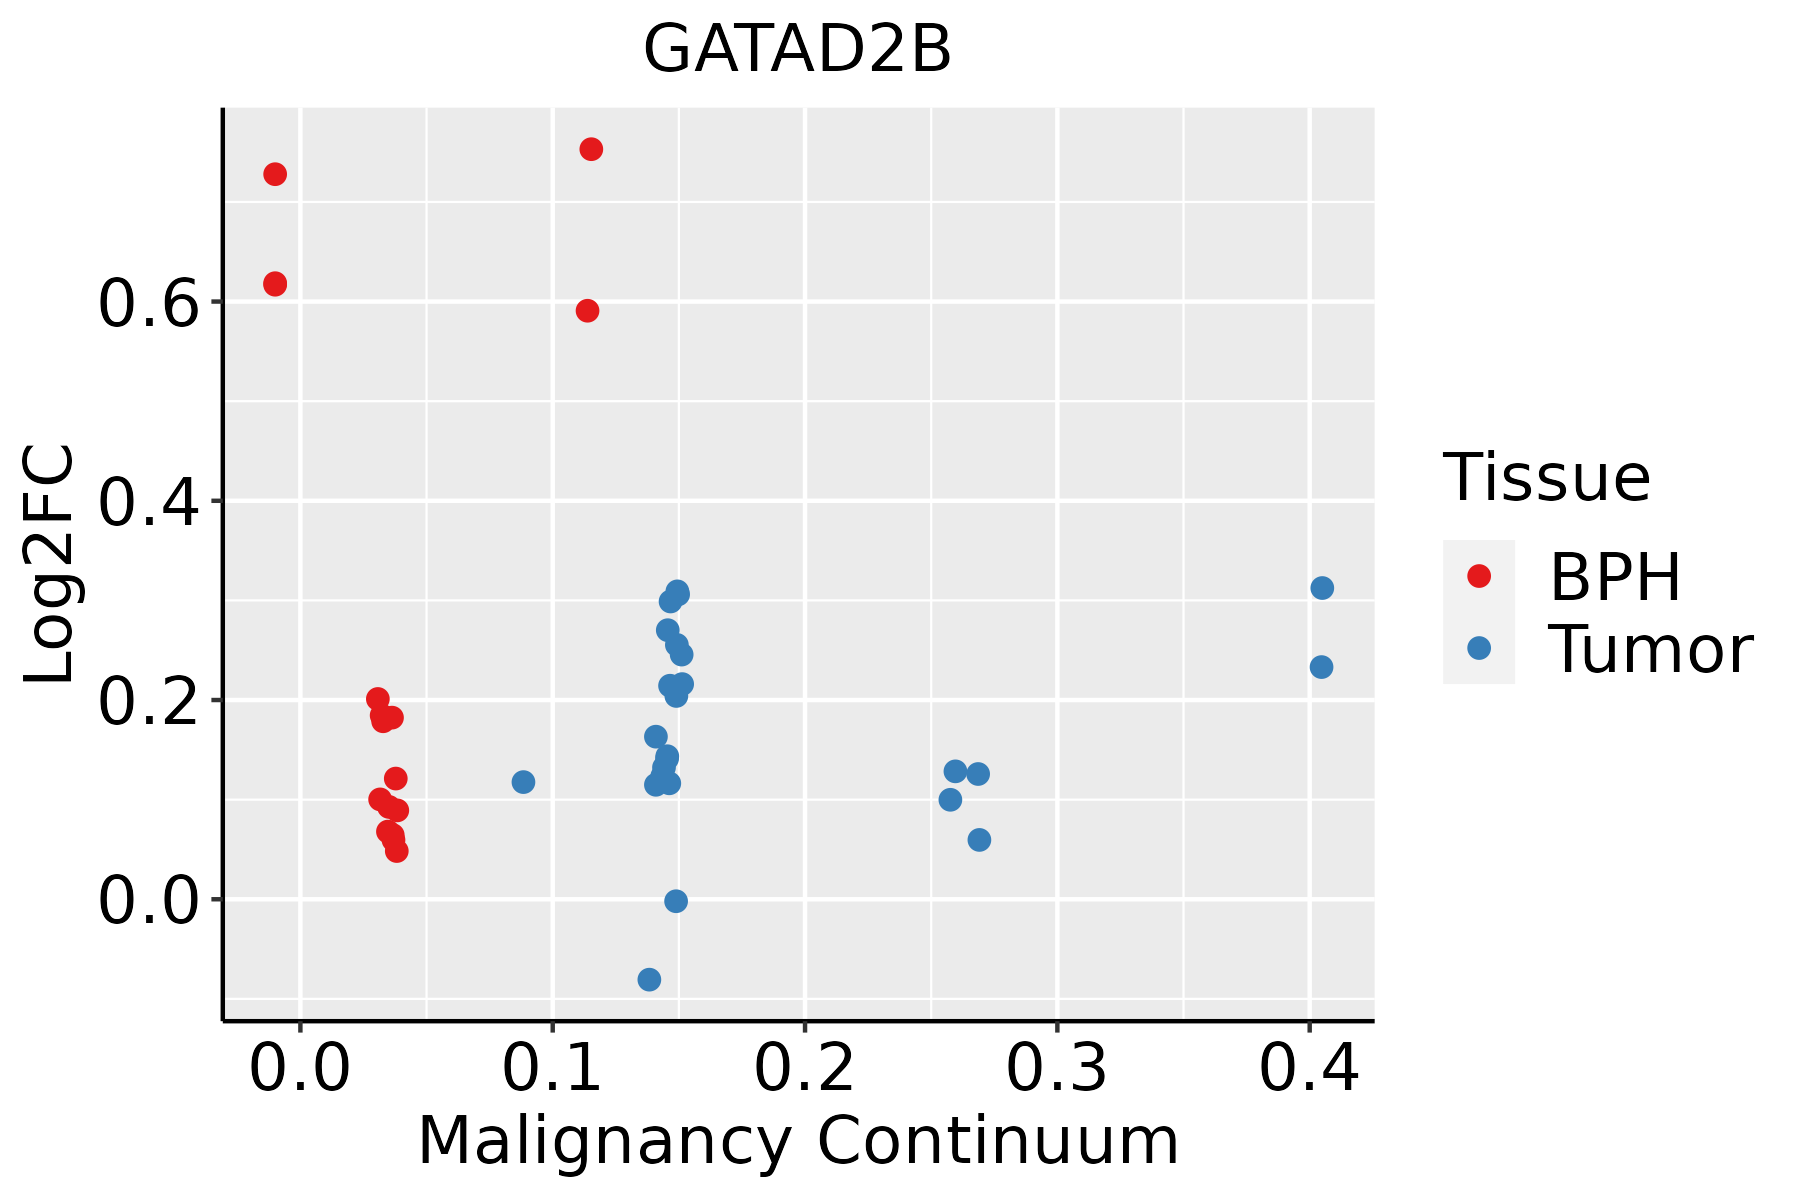 | BPH: Benign Prostatic Hyperplasia |
| Thyroid |  | ATC: Anaplastic thyroid cancer |
| HT: Hashimoto's thyroiditis | ||
| PTC: Papillary thyroid cancer |
| ∗log2FC in expression of this searched gene in stem-like cells from each diseased tissue sample relative to stem-like cells in normal samples in each tissue plotted against the malignancy continuum. Samples are colored based on if they are from different disease stage. |
Top |
Malignant transformation related pathway analysis |
| Find out the enriched GO biological processes and KEGG pathways involved in transition from healthy to precancer to cancer |
| Tissue | Disease Stage | Enriched GO biological Processes |
| Colorectum | AD |  |
| Colorectum | SER |  |
| Colorectum | MSS |  |
| Colorectum | MSI-H |  |
| Colorectum | FAP |  |
| ∗Top 15 enriched GO BP terms are showed in the bar plot of each disease state in each tissue. Each row represents a significant GO biological process which is colored according to the -log10(p.adjust). |
| Page: 1 2 3 4 5 6 7 8 9 |
| GO ID | Tissue | Disease Stage | Description | Gene Ratio | Bg Ratio | pvalue | p.adjust | Count |
| GO:00063257 | Cervix | CC | chromatin organization | 78/2311 | 409/18723 | 5.40e-05 | 8.02e-04 | 78 |
| GO:00063381 | Cervix | CC | chromatin remodeling | 45/2311 | 255/18723 | 8.33e-03 | 4.30e-02 | 45 |
| GO:00063258 | Endometrium | AEH | chromatin organization | 64/2100 | 409/18723 | 3.69e-03 | 2.52e-02 | 64 |
| GO:000632513 | Endometrium | EEC | chromatin organization | 65/2168 | 409/18723 | 4.98e-03 | 3.14e-02 | 65 |
| GO:000632517 | Esophagus | ESCC | chromatin organization | 240/8552 | 409/18723 | 6.52e-08 | 1.14e-06 | 240 |
| GO:00063255 | Liver | NAFLD | chromatin organization | 64/1882 | 409/18723 | 2.31e-04 | 3.89e-03 | 64 |
| GO:000632511 | Liver | HCC | chromatin organization | 206/7958 | 409/18723 | 7.23e-04 | 4.41e-03 | 206 |
| GO:00063256 | Lung | IAC | chromatin organization | 69/2061 | 409/18723 | 2.01e-04 | 3.53e-03 | 69 |
| GO:000632512 | Lung | AIS | chromatin organization | 62/1849 | 409/18723 | 4.24e-04 | 7.29e-03 | 62 |
| GO:000632510 | Oral cavity | OSCC | chromatin organization | 190/7305 | 409/18723 | 1.17e-03 | 5.97e-03 | 190 |
| GO:000632515 | Oral cavity | EOLP | chromatin organization | 84/2218 | 409/18723 | 2.68e-07 | 8.16e-06 | 84 |
| GO:00063383 | Oral cavity | EOLP | chromatin remodeling | 46/2218 | 255/18723 | 2.34e-03 | 1.44e-02 | 46 |
| GO:000632521 | Oral cavity | NEOLP | chromatin organization | 70/2005 | 409/18723 | 4.97e-05 | 6.83e-04 | 70 |
| GO:00063259 | Prostate | BPH | chromatin organization | 101/3107 | 409/18723 | 1.52e-05 | 1.94e-04 | 101 |
| GO:00063382 | Prostate | BPH | chromatin remodeling | 62/3107 | 255/18723 | 9.47e-04 | 5.97e-03 | 62 |
| GO:000632514 | Prostate | Tumor | chromatin organization | 104/3246 | 409/18723 | 2.02e-05 | 2.62e-04 | 104 |
| GO:000633811 | Prostate | Tumor | chromatin remodeling | 63/3246 | 255/18723 | 1.73e-03 | 1.02e-02 | 63 |
| GO:000632520 | Thyroid | PTC | chromatin organization | 183/5968 | 409/18723 | 2.55e-08 | 5.70e-07 | 183 |
| GO:00063385 | Thyroid | PTC | chromatin remodeling | 106/5968 | 255/18723 | 6.56e-04 | 4.13e-03 | 106 |
| GO:0006325110 | Thyroid | ATC | chromatin organization | 189/6293 | 409/18723 | 6.40e-08 | 1.13e-06 | 189 |
| Page: 1 2 |
| Pathway ID | Tissue | Disease Stage | Description | Gene Ratio | Bg Ratio | pvalue | p.adjust | qvalue | Count |
| Page: 1 |
Top |
Cell-cell communication analysis |
| Identification of potential cell-cell interactions between two cell types and their ligand-receptor pairs for different disease states |
| Ligand | Receptor | LRpair | Pathway | Tissue | Disease Stage |
| Page: 1 |
Top |
Single-cell gene regulatory network inference analysis |
| Find out the significant the regulons (TFs) and the target genes of each regulon across cell types for different disease states |
| TF | Cell Type | Tissue | Disease Stage | Target Gene | RSS | Regulon Activity |
| ∗The dot plots of a searched regulon are shown for all cell subpopulations in each disease state of each tissue based on the regulon specific score inferred using pySCENIC and by calculating the average expression. |
| Page: 1 |
Top |
Somatic mutation of malignant transformation related genes |
| Annotation of somatic variants for genes involved in malignant transformation |
| Hugo Symbol | Variant Class | Variant Classification | dbSNP RS | HGVSc | HGVSp | HGVSp Short | SWISSPROT | BIOTYPE | SIFT | PolyPhen | Tumor Sample Barcode | Tissue | Histology | Sex | Age | Stage | Therapy Types | Drugs | Outcome |
| GATAD2B | SNV | Missense_Mutation | c.422N>A | p.Arg141Lys | p.R141K | Q8WXI9 | protein_coding | tolerated(0.79) | benign(0.037) | TCGA-AO-A0J9-01 | Breast | breast invasive carcinoma | Female | <65 | III/IV | Chemotherapy | cyclophosphamide | PD | |
| GATAD2B | SNV | Missense_Mutation | c.278G>A | p.Gly93Glu | p.G93E | Q8WXI9 | protein_coding | tolerated(1) | benign(0) | TCGA-AR-A0TV-01 | Breast | breast invasive carcinoma | Female | >=65 | I/II | Unknown | Unknown | SD | |
| GATAD2B | SNV | Missense_Mutation | c.1314N>C | p.Lys438Asn | p.K438N | Q8WXI9 | protein_coding | tolerated(0.35) | benign(0.239) | TCGA-BH-A0W7-01 | Breast | breast invasive carcinoma | Female | <65 | I/II | Chemotherapy | taxotere | CR | |
| GATAD2B | SNV | Missense_Mutation | c.1720N>A | p.Glu574Lys | p.E574K | Q8WXI9 | protein_coding | deleterious(0) | probably_damaging(0.956) | TCGA-C5-A905-01 | Cervix | cervical & endocervical cancer | Female | <65 | I/II | Unknown | Unknown | SD | |
| GATAD2B | SNV | Missense_Mutation | c.1426N>C | p.Glu476Gln | p.E476Q | Q8WXI9 | protein_coding | deleterious(0) | probably_damaging(0.968) | TCGA-DR-A0ZM-01 | Cervix | cervical & endocervical cancer | Female | <65 | III/IV | Unspecific | Cisplatin | SD | |
| GATAD2B | SNV | Missense_Mutation | novel | c.307N>A | p.Glu103Lys | p.E103K | Q8WXI9 | protein_coding | deleterious(0.02) | probably_damaging(0.956) | TCGA-VS-A8EK-01 | Cervix | cervical & endocervical cancer | Female | >=65 | I/II | Chemotherapy | cisplatin | PD |
| GATAD2B | SNV | Missense_Mutation | c.424A>T | p.Met142Leu | p.M142L | Q8WXI9 | protein_coding | tolerated(0.65) | benign(0.003) | TCGA-A6-3807-01 | Colorectum | colon adenocarcinoma | Female | <65 | III/IV | Ancillary | leucovorin | SD | |
| GATAD2B | SNV | Missense_Mutation | c.682N>T | p.Arg228Trp | p.R228W | Q8WXI9 | protein_coding | deleterious(0) | probably_damaging(0.973) | TCGA-AA-A01P-01 | Colorectum | colon adenocarcinoma | Female | >=65 | III/IV | Unknown | Unknown | PD | |
| GATAD2B | SNV | Missense_Mutation | rs764367916 | c.856N>T | p.Arg286Cys | p.R286C | Q8WXI9 | protein_coding | deleterious(0) | probably_damaging(0.985) | TCGA-AD-A5EJ-01 | Colorectum | colon adenocarcinoma | Female | >=65 | I/II | Unknown | Unknown | SD |
| GATAD2B | SNV | Missense_Mutation | c.125G>A | p.Arg42His | p.R42H | Q8WXI9 | protein_coding | deleterious(0) | probably_damaging(0.98) | TCGA-AZ-4615-01 | Colorectum | colon adenocarcinoma | Male | >=65 | III/IV | Chemotherapy | xeloda | PD |
| Page: 1 2 3 4 5 6 |
Top |
Related drugs of malignant transformation related genes |
| Identification of chemicals and drugs interact with genes involved in malignant transfromation |
| (DGIdb 4.0) |
| Entrez ID | Symbol | Category | Interaction Types | Drug Claim Name | Drug Name | PMIDs |
| Page: 1 |

Copyright 2023-Present -The University of Texas Health Science Center at Houston |