
|
|||||
|
 | |
| |
| |
| |
| |
| |
|
Gene: GATA6 |
Gene summary for GATA6 |
| Gene information | Species | Human | Gene symbol | GATA6 | Gene ID | 2627 |
| Gene name | GATA binding protein 6 | |
| Gene Alias | GATA6 | |
| Cytomap | 18q11.2 | |
| Gene Type | protein-coding | GO ID | GO:0000003 | UniProtAcc | Q92908 |
Top |
Malignant transformation analysis |
| Identification of the aberrant gene expression in precancerous and cancerous lesions by comparing the gene expression of stem-like cells in diseased tissues with normal stem cells |
| Entrez ID | Symbol | Replicates | Species | Organ | Tissue | Adj P-value | Log2FC | Malignancy |
| 2627 | GATA6 | male-WTA | Human | Thyroid | PTC | 9.69e-03 | -5.90e-02 | 0.1037 |
| 2627 | GATA6 | PTC01 | Human | Thyroid | PTC | 2.34e-06 | -7.10e-02 | 0.1899 |
| 2627 | GATA6 | PTC06 | Human | Thyroid | PTC | 3.98e-03 | -6.51e-03 | 0.2057 |
| 2627 | GATA6 | PTC07 | Human | Thyroid | PTC | 5.77e-06 | 1.73e-01 | 0.2044 |
| 2627 | GATA6 | ATC13 | Human | Thyroid | ATC | 4.66e-40 | 1.03e+00 | 0.34 |
| 2627 | GATA6 | ATC5 | Human | Thyroid | ATC | 8.29e-56 | 1.11e+00 | 0.34 |
| Page: 1 |
| Tissue | Expression Dynamics | Abbreviation |
| Thyroid | 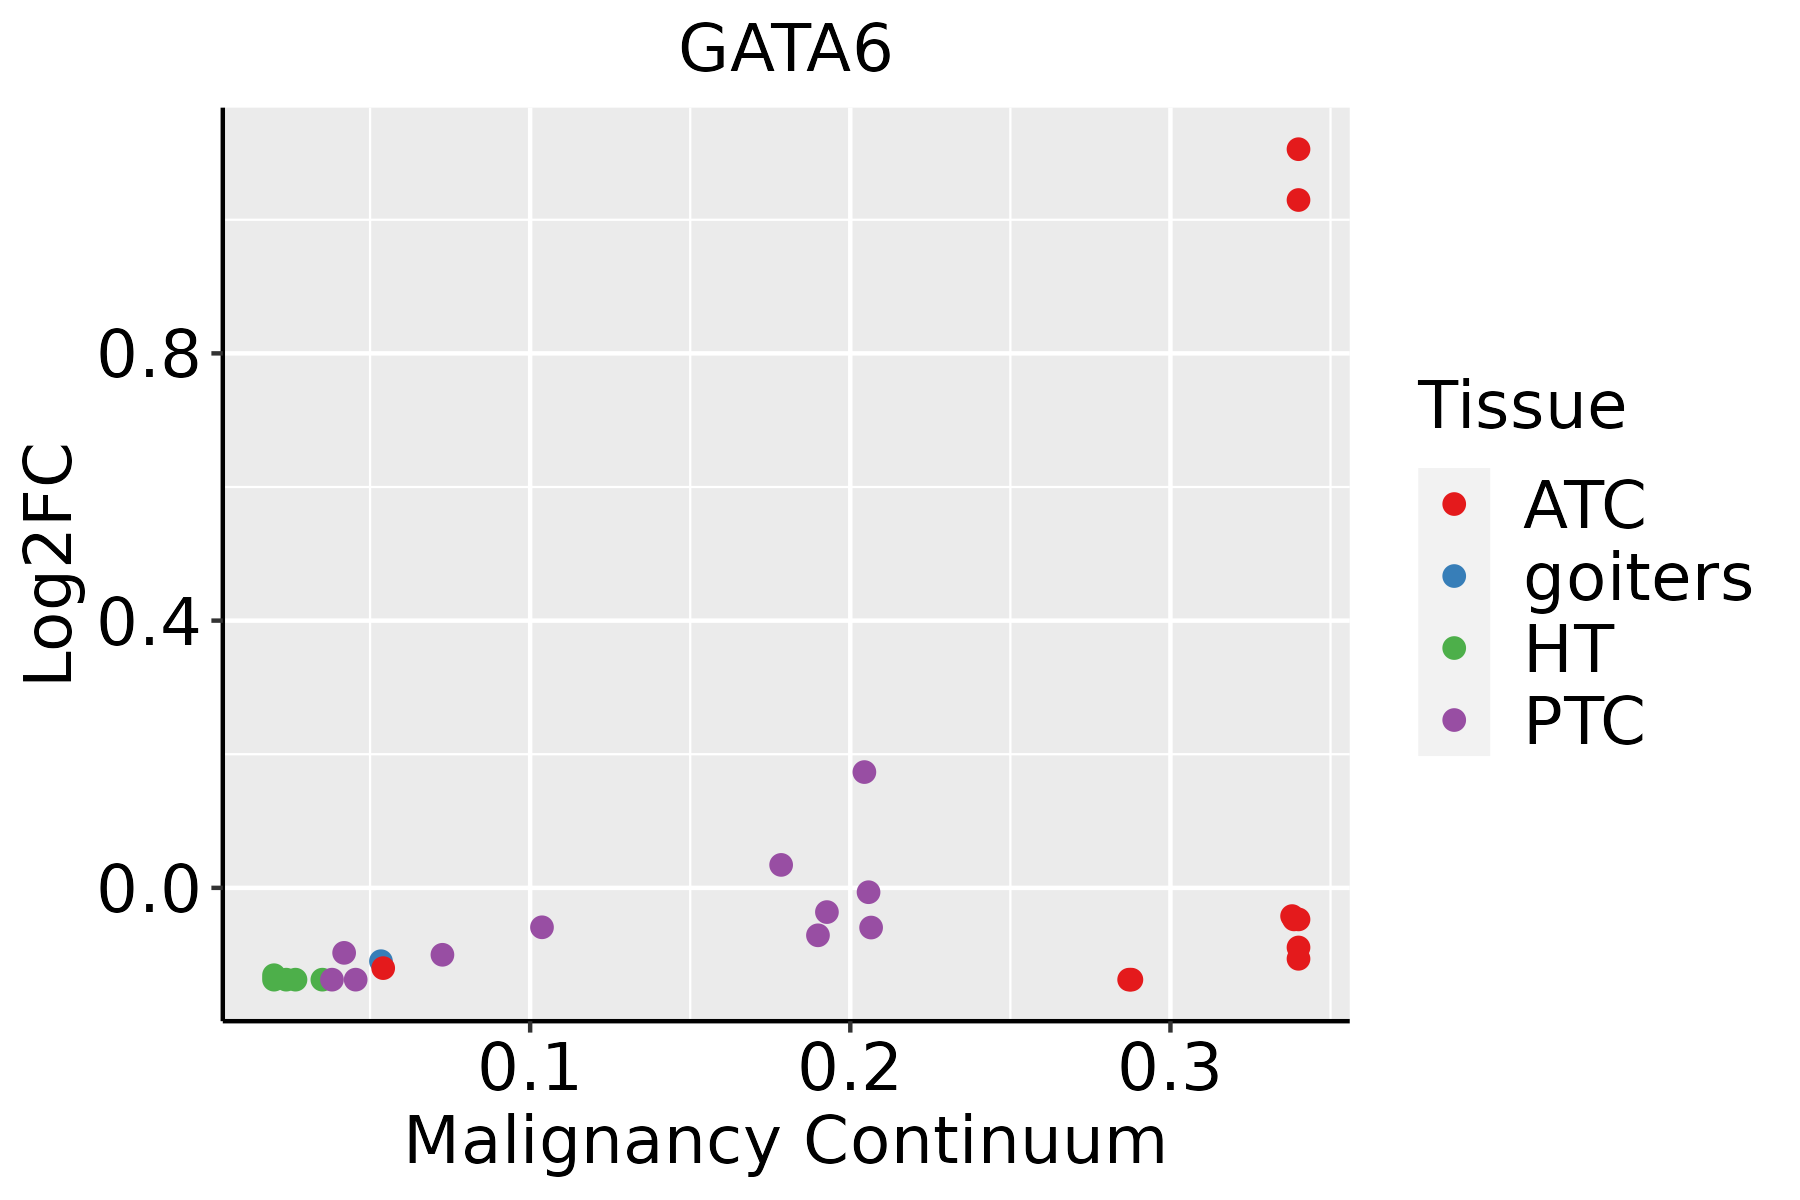 | ATC: Anaplastic thyroid cancer |
| HT: Hashimoto's thyroiditis | ||
| PTC: Papillary thyroid cancer |
| ∗log2FC in expression of this searched gene in stem-like cells from each diseased tissue sample relative to stem-like cells in normal samples in each tissue plotted against the malignancy continuum. Samples are colored based on if they are from different disease stage. |
Top |
Malignant transformation related pathway analysis |
| Find out the enriched GO biological processes and KEGG pathways involved in transition from healthy to precancer to cancer |
| Tissue | Disease Stage | Enriched GO biological Processes |
| Colorectum | AD |  |
| Colorectum | SER |  |
| Colorectum | MSS |  |
| Colorectum | MSI-H |  |
| Colorectum | FAP |  |
| ∗Top 15 enriched GO BP terms are showed in the bar plot of each disease state in each tissue. Each row represents a significant GO biological process which is colored according to the -log10(p.adjust). |
| Page: 1 2 3 4 5 6 7 8 9 |
| GO ID | Tissue | Disease Stage | Description | Gene Ratio | Bg Ratio | pvalue | p.adjust | Count |
| GO:0001701111 | Thyroid | PTC | in utero embryonic development | 175/5968 | 367/18723 | 1.40e-10 | 4.73e-09 | 175 |
| GO:0070482113 | Thyroid | PTC | response to oxygen levels | 167/5968 | 347/18723 | 1.51e-10 | 5.03e-09 | 167 |
| GO:0036293113 | Thyroid | PTC | response to decreased oxygen levels | 153/5968 | 322/18723 | 2.71e-09 | 7.52e-08 | 153 |
| GO:0001666113 | Thyroid | PTC | response to hypoxia | 145/5968 | 307/18723 | 1.14e-08 | 2.74e-07 | 145 |
| GO:0048732113 | Thyroid | PTC | gland development | 193/5968 | 436/18723 | 2.88e-08 | 6.42e-07 | 193 |
| GO:0001889112 | Thyroid | PTC | liver development | 79/5968 | 147/18723 | 3.08e-08 | 6.82e-07 | 79 |
| GO:0061008112 | Thyroid | PTC | hepaticobiliary system development | 80/5968 | 150/18723 | 3.94e-08 | 8.55e-07 | 80 |
| GO:00032794 | Thyroid | PTC | cardiac septum development | 54/5968 | 103/18723 | 1.17e-05 | 1.29e-04 | 54 |
| GO:0071453112 | Thyroid | PTC | cellular response to oxygen levels | 83/5968 | 177/18723 | 2.01e-05 | 2.04e-04 | 83 |
| GO:000736910 | Thyroid | PTC | gastrulation | 84/5968 | 185/18723 | 7.58e-05 | 6.52e-04 | 84 |
| GO:0061458112 | Thyroid | PTC | reproductive system development | 173/5968 | 427/18723 | 8.70e-05 | 7.23e-04 | 173 |
| GO:000283114 | Thyroid | PTC | regulation of response to biotic stimulus | 136/5968 | 327/18723 | 1.22e-04 | 9.69e-04 | 136 |
| GO:0036294112 | Thyroid | PTC | cellular response to decreased oxygen levels | 74/5968 | 161/18723 | 1.23e-04 | 9.75e-04 | 74 |
| GO:0048608111 | Thyroid | PTC | reproductive structure development | 170/5968 | 424/18723 | 1.86e-04 | 1.41e-03 | 170 |
| GO:20007367 | Thyroid | PTC | regulation of stem cell differentiation | 32/5968 | 58/18723 | 2.01e-04 | 1.50e-03 | 32 |
| GO:003032317 | Thyroid | PTC | respiratory tube development | 80/5968 | 181/18723 | 3.23e-04 | 2.23e-03 | 80 |
| GO:00017046 | Thyroid | PTC | formation of primary germ layer | 57/5968 | 121/18723 | 3.23e-04 | 2.23e-03 | 57 |
| GO:007163512 | Thyroid | PTC | negative regulation of transforming growth factor beta production | 10/5968 | 12/18723 | 3.59e-04 | 2.44e-03 | 10 |
| GO:00032055 | Thyroid | PTC | cardiac chamber development | 72/5968 | 161/18723 | 4.13e-04 | 2.77e-03 | 72 |
| GO:000749213 | Thyroid | PTC | endoderm development | 39/5968 | 77/18723 | 4.64e-04 | 3.06e-03 | 39 |
| Page: 1 2 3 4 5 |
| Pathway ID | Tissue | Disease Stage | Description | Gene Ratio | Bg Ratio | pvalue | p.adjust | qvalue | Count |
| Page: 1 |
Top |
Cell-cell communication analysis |
| Identification of potential cell-cell interactions between two cell types and their ligand-receptor pairs for different disease states |
| Ligand | Receptor | LRpair | Pathway | Tissue | Disease Stage |
| Page: 1 |
Top |
Single-cell gene regulatory network inference analysis |
| Find out the significant the regulons (TFs) and the target genes of each regulon across cell types for different disease states |
| TF | Cell Type | Tissue | Disease Stage | Target Gene | RSS | Regulon Activity |
| GATA6 | STM | Cervix | ADJ | TWIST1,SERPINE2,TSLP, etc. | 1.64e-01 |  |
| GATA6 | QUIE | Esophagus | Healthy | MBP,EIF3J,CKB, etc. | 3.76e-02 |  |
| GATA6 | CAF | Liver | HCC | CACNA2D1,PCDH9,ADGRB3, etc. | 7.60e-02 |  |
| GATA6 | CAF | Liver | Healthy | CACNA2D1,PCDH9,ADGRB3, etc. | 5.76e-01 |  |
| GATA6 | CAF | Liver | NAFLD | CACNA2D1,PCDH9,ADGRB3, etc. | 6.50e-01 |  |
| GATA6 | ICAF | Pancreas | ADJ | C7,FBLN5,PTGIS, etc. | 6.03e-01 |  |
| GATA6 | SMC | Pancreas | PanIN | C7,FBLN5,PTGIS, etc. | 5.57e-01 |  |
| GATA6 | GMC | Stomach | ADJ | DGKD,ADAM28,OPCML, etc. | 1.49e-01 |  |
| GATA6 | GMC | Stomach | CSG | DGKD,ADAM28,OPCML, etc. | 1.55e-01 |  |
| GATA6 | GMC | Stomach | GC | DGKD,ADAM28,OPCML, etc. | 1.39e-01 |  |
| ∗The dot plots of a searched regulon are shown for all cell subpopulations in each disease state of each tissue based on the regulon specific score inferred using pySCENIC and by calculating the average expression. |
| Page: 1 2 |
Top |
Somatic mutation of malignant transformation related genes |
| Annotation of somatic variants for genes involved in malignant transformation |
| Hugo Symbol | Variant Class | Variant Classification | dbSNP RS | HGVSc | HGVSp | HGVSp Short | SWISSPROT | BIOTYPE | SIFT | PolyPhen | Tumor Sample Barcode | Tissue | Histology | Sex | Age | Stage | Therapy Types | Drugs | Outcome |
| GATA6 | SNV | Missense_Mutation | c.1449G>A | p.Met483Ile | p.M483I | Q92908 | protein_coding | deleterious(0) | possibly_damaging(0.704) | TCGA-AA-3818-01 | Colorectum | colon adenocarcinoma | Female | >=65 | I/II | Unknown | Unknown | PD | |
| GATA6 | SNV | Missense_Mutation | rs144512170 | c.1312N>T | p.Arg438Trp | p.R438W | Q92908 | protein_coding | deleterious(0) | probably_damaging(0.978) | TCGA-AA-3864-01 | Colorectum | colon adenocarcinoma | Male | >=65 | I/II | Unknown | Unknown | SD |
| GATA6 | SNV | Missense_Mutation | c.389N>G | p.Ser130Cys | p.S130C | Q92908 | protein_coding | deleterious(0) | possibly_damaging(0.839) | TCGA-D5-6929-01 | Colorectum | colon adenocarcinoma | Female | <65 | III/IV | Chemotherapy | oxaliplatinum+ | SD | |
| GATA6 | deletion | Frame_Shift_Del | c.1454_1455delAA | p.Lys485ArgfsTer11 | p.K485Rfs*11 | Q92908 | protein_coding | TCGA-CK-6747-01 | Colorectum | colon adenocarcinoma | Female | >=65 | I/II | Unknown | Unknown | SD | |||
| GATA6 | insertion | Frame_Shift_Ins | novel | c.1502_1503insA | p.Thr503AspfsTer5 | p.T503Dfs*5 | Q92908 | protein_coding | TCGA-G4-6293-01 | Colorectum | colon adenocarcinoma | Female | <65 | III/IV | Chemotherapy | fluorouracil | SD | ||
| GATA6 | SNV | Missense_Mutation | c.1378G>A | p.Glu460Lys | p.E460K | Q92908 | protein_coding | deleterious(0.03) | possibly_damaging(0.661) | TCGA-A5-A0G2-01 | Endometrium | uterine corpus endometrioid carcinoma | Female | <65 | III/IV | Unknown | Unknown | SD | |
| GATA6 | SNV | Missense_Mutation | rs769972301 | c.1750G>A | p.Val584Met | p.V584M | Q92908 | protein_coding | deleterious(0.02) | probably_damaging(0.921) | TCGA-A5-A0G2-01 | Endometrium | uterine corpus endometrioid carcinoma | Female | <65 | III/IV | Unknown | Unknown | SD |
| GATA6 | SNV | Missense_Mutation | c.1727C>T | p.Ser576Leu | p.S576L | Q92908 | protein_coding | deleterious(0.01) | benign(0.011) | TCGA-AJ-A3OK-01 | Endometrium | uterine corpus endometrioid carcinoma | Female | >=65 | I/II | Chemotherapy | carboplatin | CR | |
| GATA6 | SNV | Missense_Mutation | c.1735G>A | p.Glu579Lys | p.E579K | Q92908 | protein_coding | tolerated(0.08) | possibly_damaging(0.771) | TCGA-AP-A0LT-01 | Endometrium | uterine corpus endometrioid carcinoma | Female | <65 | I/II | Unknown | Unknown | SD | |
| GATA6 | SNV | Missense_Mutation | rs387906818 | c.1366N>T | p.Arg456Cys | p.R456C | Q92908 | protein_coding | deleterious(0) | probably_damaging(1) | TCGA-AX-A2HD-01 | Endometrium | uterine corpus endometrioid carcinoma | Female | >=65 | III/IV | Unknown | Unknown | SD |
| Page: 1 2 3 4 |
Top |
Related drugs of malignant transformation related genes |
| Identification of chemicals and drugs interact with genes involved in malignant transfromation |
| (DGIdb 4.0) |
| Entrez ID | Symbol | Category | Interaction Types | Drug Claim Name | Drug Name | PMIDs |
| Page: 1 |

Copyright 2023-Present -The University of Texas Health Science Center at Houston |