
|
|||||
|
 | |
| |
| |
| |
| |
| |
|
Gene: GATA2 |
Gene summary for GATA2 |
| Gene information | Species | Human | Gene symbol | GATA2 | Gene ID | 2624 |
| Gene name | GATA binding protein 2 | |
| Gene Alias | DCML | |
| Cytomap | 3q21.3 | |
| Gene Type | protein-coding | GO ID | GO:0000003 | UniProtAcc | P23769 |
Top |
Malignant transformation analysis |
| Identification of the aberrant gene expression in precancerous and cancerous lesions by comparing the gene expression of stem-like cells in diseased tissues with normal stem cells |
| Entrez ID | Symbol | Replicates | Species | Organ | Tissue | Adj P-value | Log2FC | Malignancy |
| 2624 | GATA2 | CA_HPV_1 | Human | Cervix | CC | 1.20e-16 | -6.48e-01 | 0.0264 |
| 2624 | GATA2 | CA_HPV_3 | Human | Cervix | CC | 3.81e-05 | -4.02e-01 | 0.0414 |
| 2624 | GATA2 | HSIL_HPV_2 | Human | Cervix | HSIL_HPV | 9.65e-07 | -3.64e-01 | 0.0208 |
| 2624 | GATA2 | N_HPV_2 | Human | Cervix | N_HPV | 1.35e-06 | -5.09e-01 | -0.0131 |
| 2624 | GATA2 | CCI_1 | Human | Cervix | CC | 1.31e-04 | -7.28e-01 | 0.528 |
| 2624 | GATA2 | CCI_2 | Human | Cervix | CC | 4.05e-04 | -7.24e-01 | 0.5249 |
| 2624 | GATA2 | CCI_3 | Human | Cervix | CC | 1.38e-06 | -7.42e-01 | 0.516 |
| 2624 | GATA2 | CCII_1 | Human | Cervix | CC | 1.10e-09 | -7.55e-01 | 0.3249 |
| 2624 | GATA2 | Tumor | Human | Cervix | CC | 3.82e-25 | -7.56e-01 | 0.1241 |
| 2624 | GATA2 | sample1 | Human | Cervix | CC | 4.12e-08 | -4.99e-01 | 0.0959 |
| 2624 | GATA2 | sample3 | Human | Cervix | CC | 5.91e-27 | -7.65e-01 | 0.1387 |
| 2624 | GATA2 | H2 | Human | Cervix | HSIL_HPV | 1.38e-20 | -6.16e-01 | 0.0632 |
| 2624 | GATA2 | L1 | Human | Cervix | CC | 6.38e-10 | -7.68e-01 | 0.0802 |
| 2624 | GATA2 | T1 | Human | Cervix | CC | 9.38e-15 | -4.46e-01 | 0.0918 |
| 2624 | GATA2 | T2 | Human | Cervix | CC | 2.10e-04 | -4.60e-01 | 0.0709 |
| 2624 | GATA2 | T3 | Human | Cervix | CC | 1.33e-26 | -7.59e-01 | 0.1389 |
| 2624 | GATA2 | AEH-subject1 | Human | Endometrium | AEH | 4.77e-04 | -1.60e-01 | -0.3059 |
| 2624 | GATA2 | AEH-subject2 | Human | Endometrium | AEH | 2.21e-03 | -1.61e-01 | -0.2525 |
| 2624 | GATA2 | AEH-subject3 | Human | Endometrium | AEH | 1.48e-06 | -1.60e-01 | -0.2576 |
| 2624 | GATA2 | AEH-subject4 | Human | Endometrium | AEH | 1.28e-05 | -1.86e-01 | -0.2657 |
| Page: 1 2 3 |
| Tissue | Expression Dynamics | Abbreviation |
| Cervix | 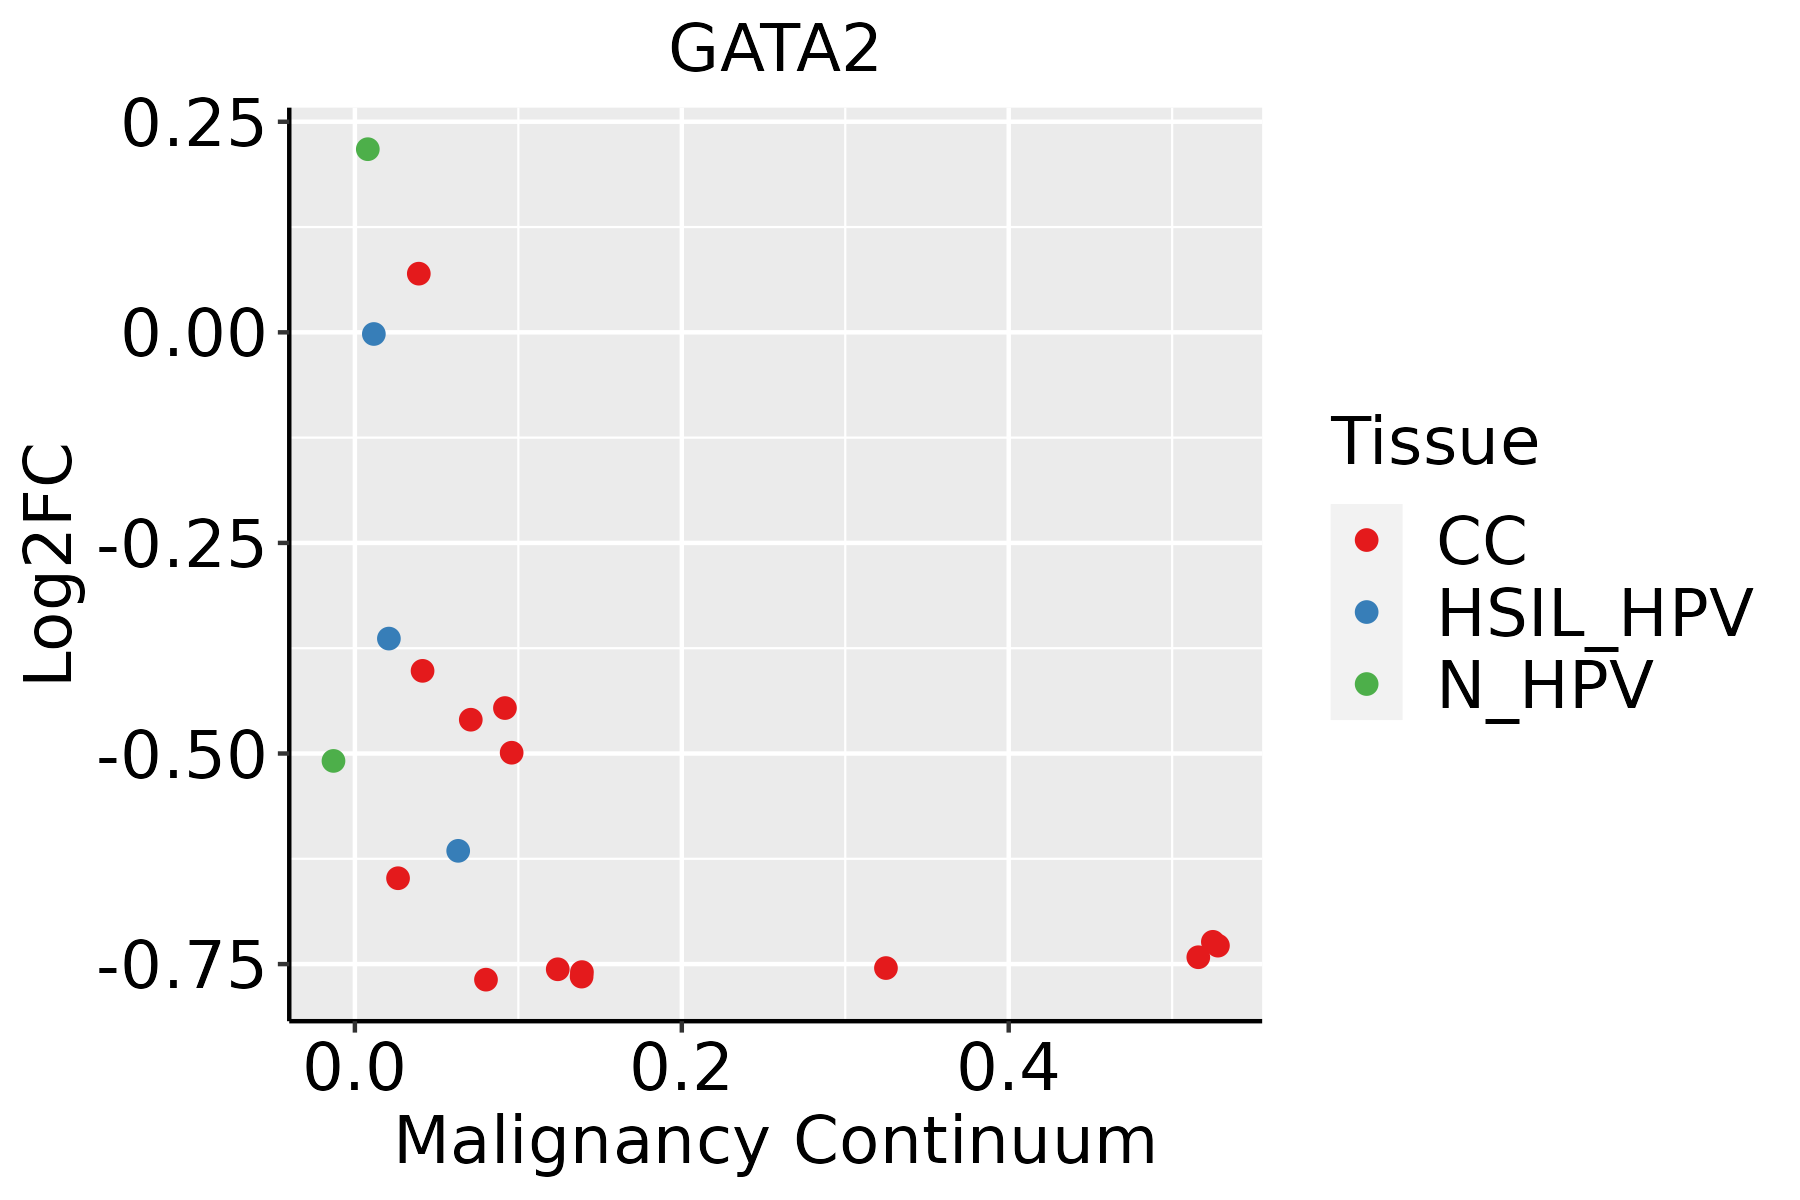 | CC: Cervix cancer |
| HSIL_HPV: HPV-infected high-grade squamous intraepithelial lesions | ||
| N_HPV: HPV-infected normal cervix | ||
| Endometrium | 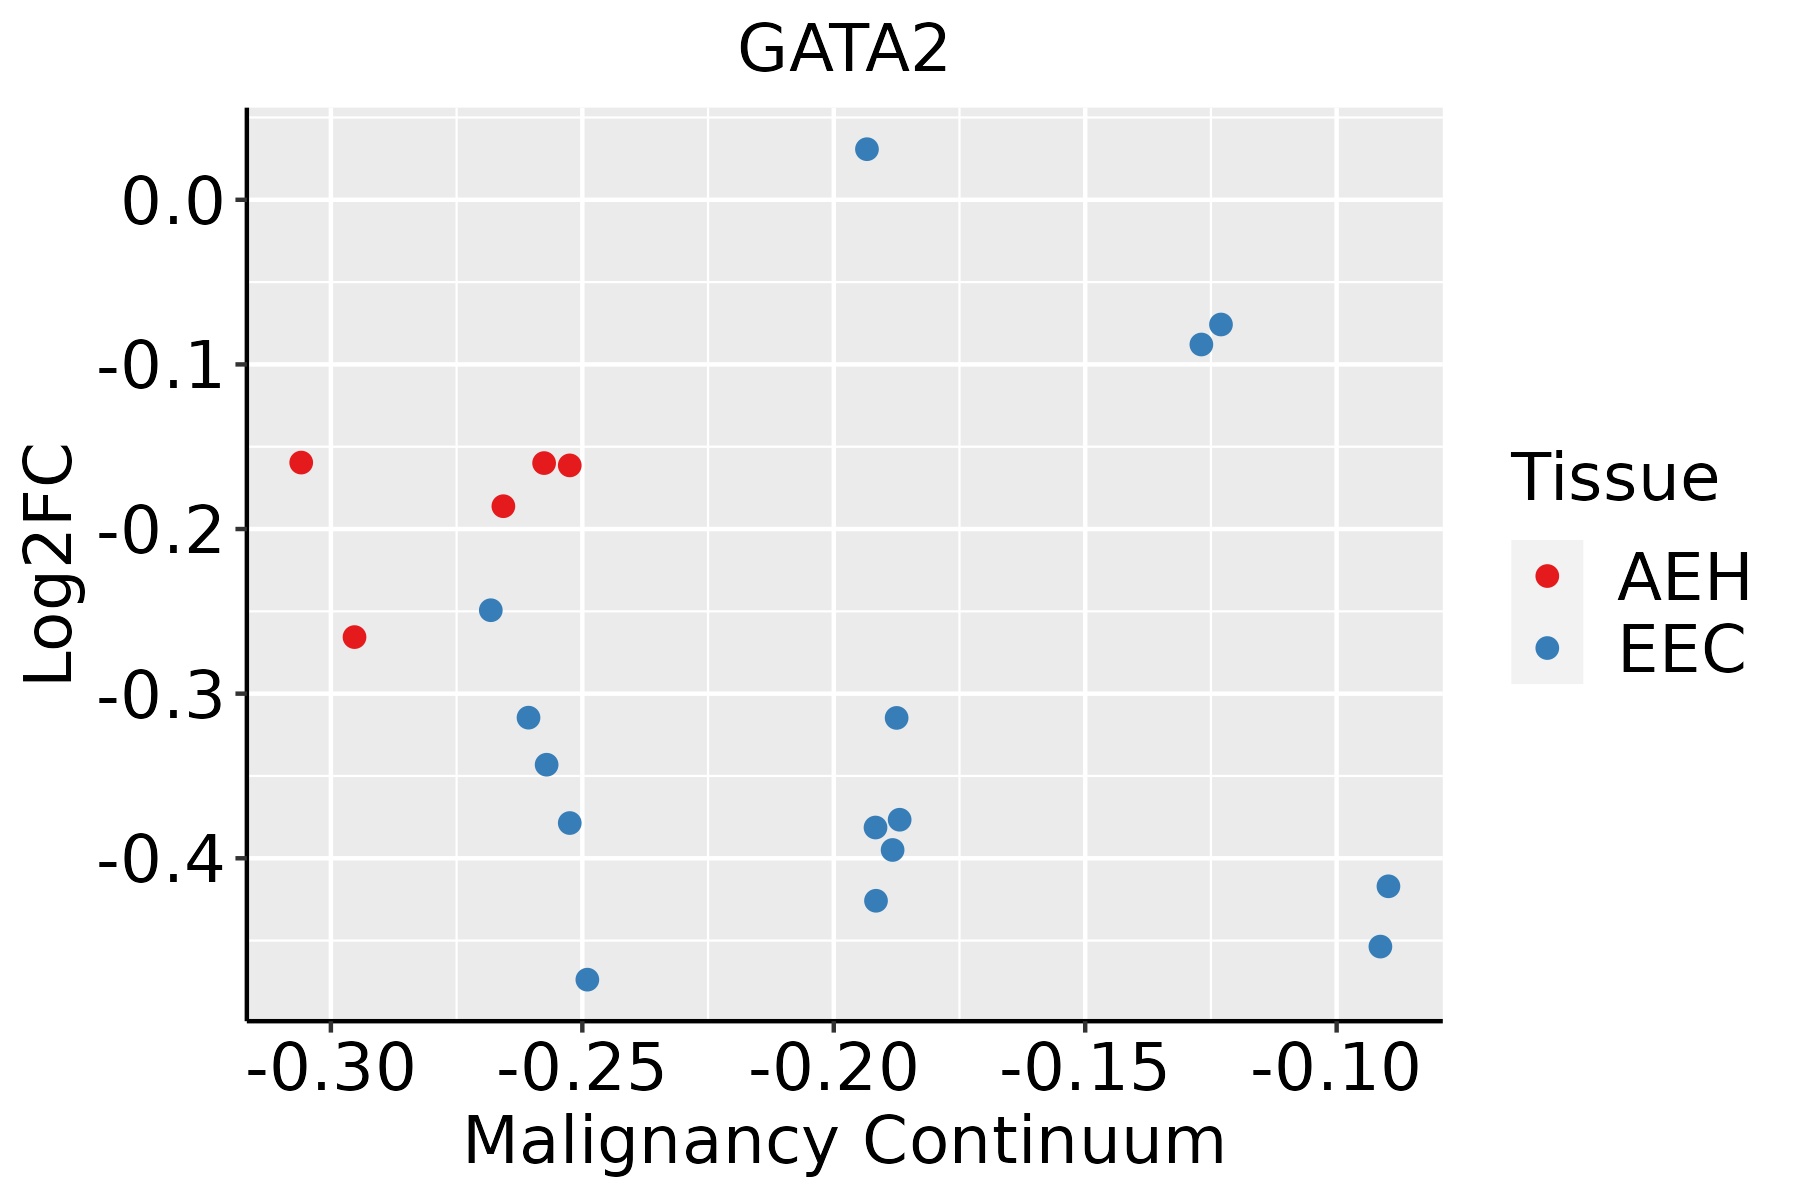 | AEH: Atypical endometrial hyperplasia |
| EEC: Endometrioid Cancer | ||
| Oral Cavity | 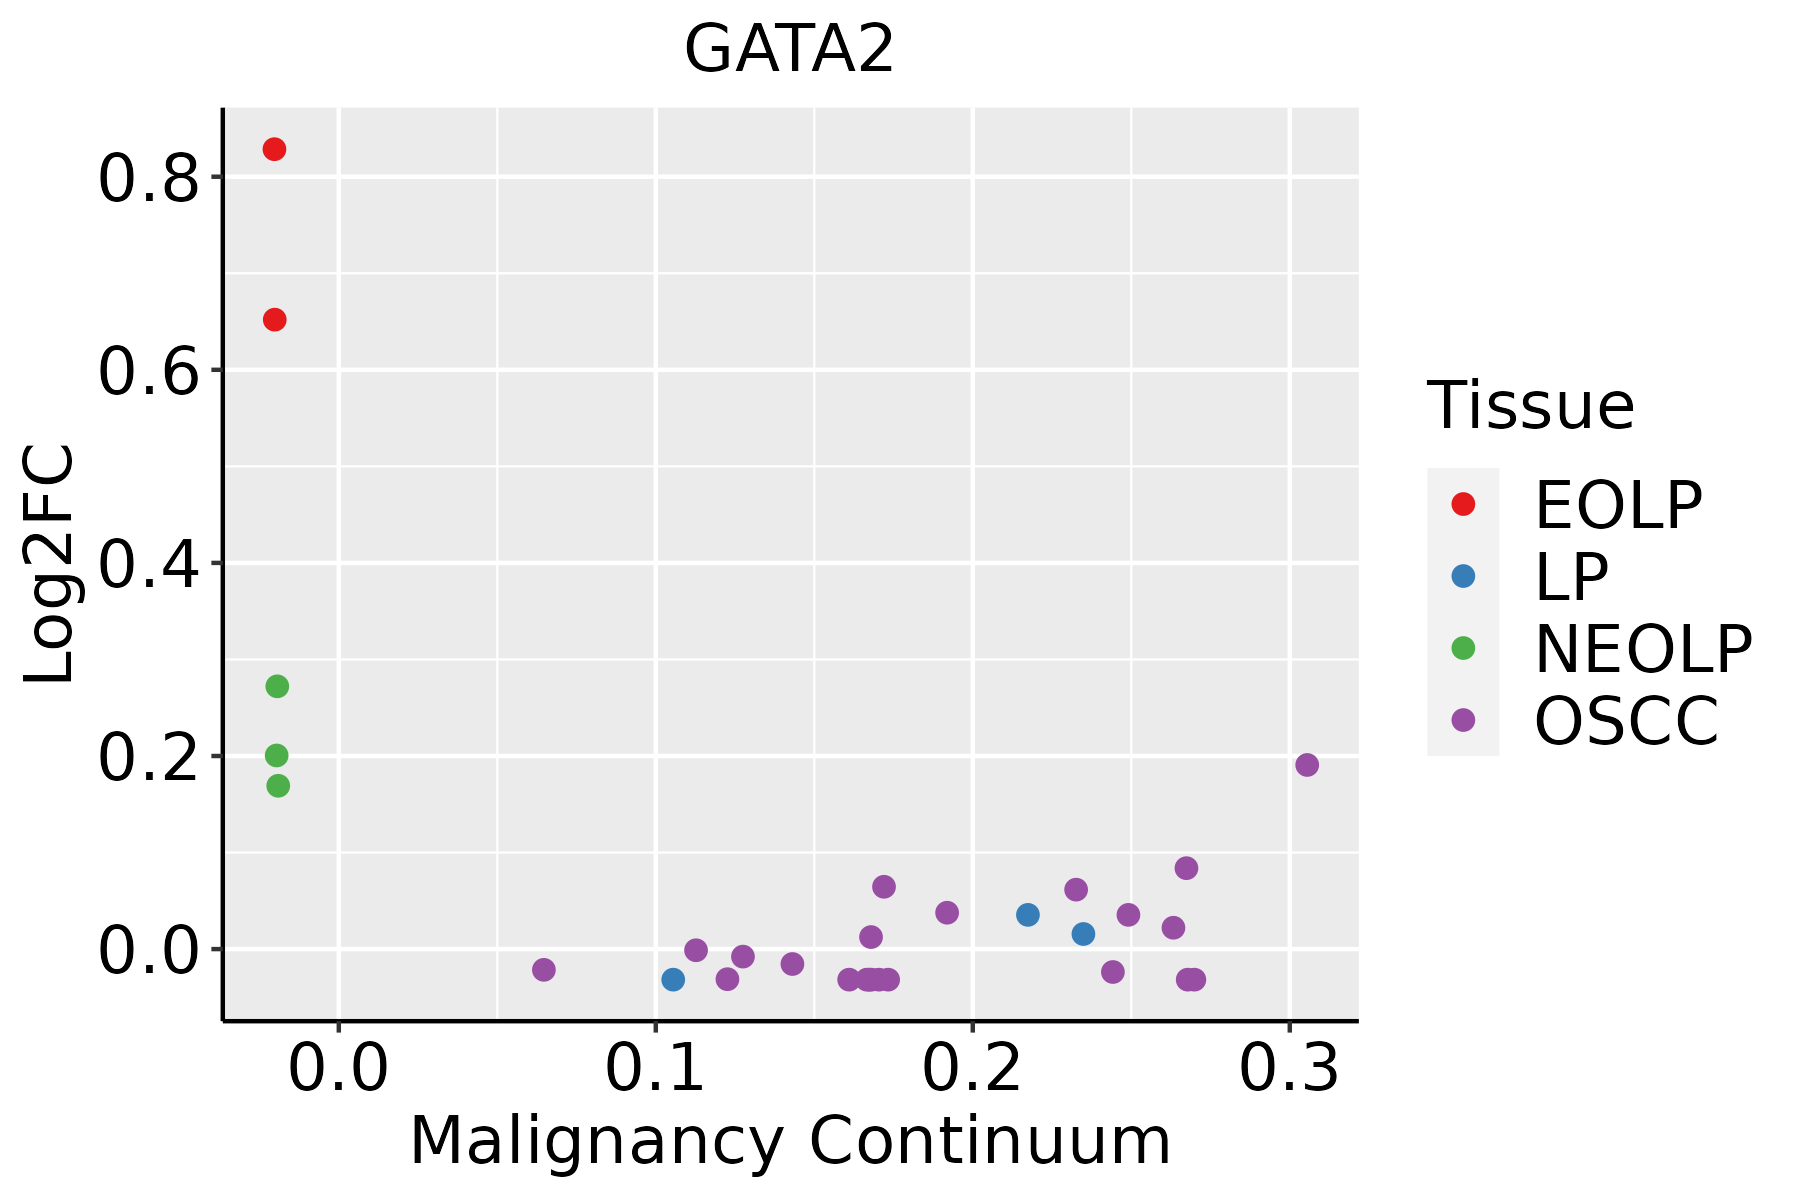 | EOLP: Erosive Oral lichen planus |
| LP: leukoplakia | ||
| NEOLP: Non-erosive oral lichen planus | ||
| OSCC: Oral squamous cell carcinoma | ||
| Prostate | 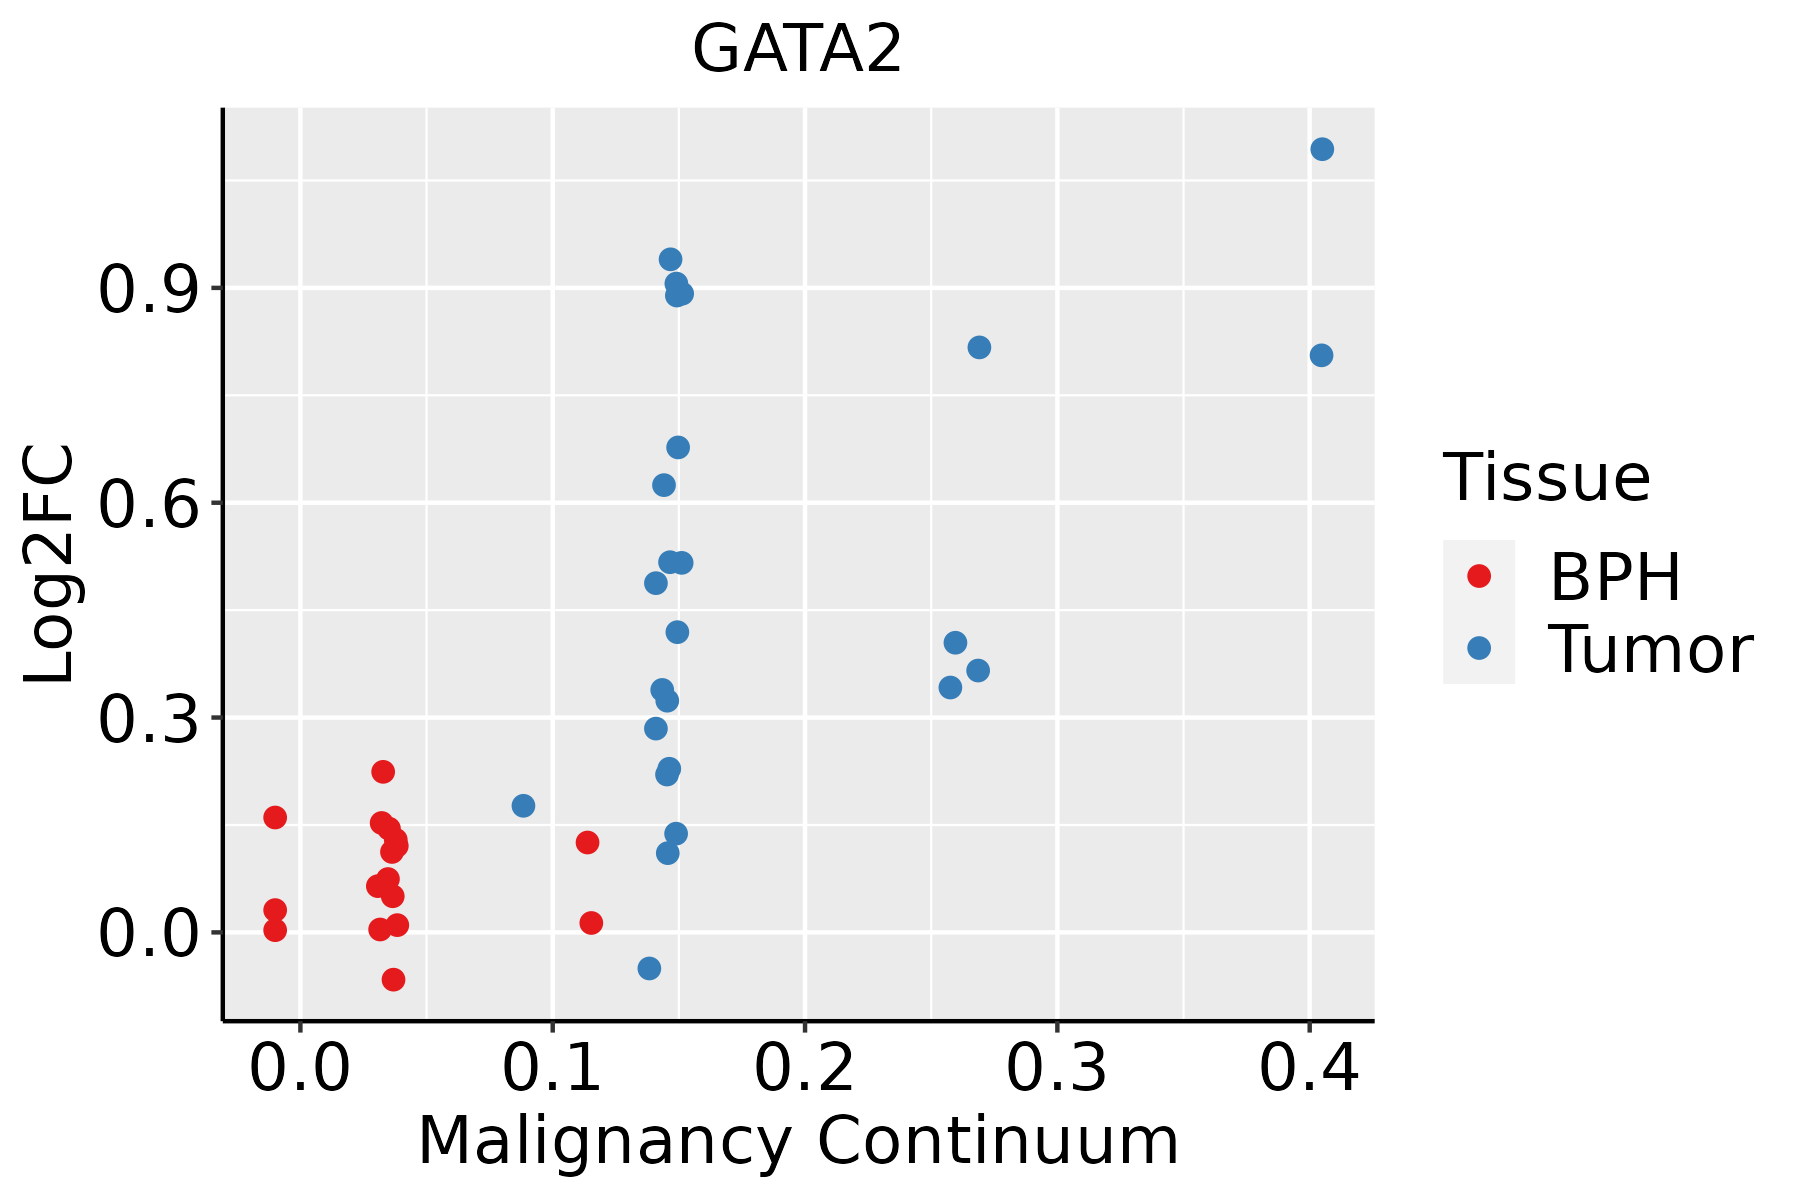 | BPH: Benign Prostatic Hyperplasia |
| ∗log2FC in expression of this searched gene in stem-like cells from each diseased tissue sample relative to stem-like cells in normal samples in each tissue plotted against the malignancy continuum. Samples are colored based on if they are from different disease stage. |
Top |
Malignant transformation related pathway analysis |
| Find out the enriched GO biological processes and KEGG pathways involved in transition from healthy to precancer to cancer |
| Tissue | Disease Stage | Enriched GO biological Processes |
| Colorectum | AD |  |
| Colorectum | SER |  |
| Colorectum | MSS |  |
| Colorectum | MSI-H |  |
| Colorectum | FAP |  |
| ∗Top 15 enriched GO BP terms are showed in the bar plot of each disease state in each tissue. Each row represents a significant GO biological process which is colored according to the -log10(p.adjust). |
| Page: 1 2 3 4 5 6 7 8 9 |
| GO ID | Tissue | Disease Stage | Description | Gene Ratio | Bg Ratio | pvalue | p.adjust | Count |
| GO:004206010 | Cervix | CC | wound healing | 109/2311 | 422/18723 | 1.84e-14 | 1.57e-11 | 109 |
| GO:009013210 | Cervix | CC | epithelium migration | 90/2311 | 360/18723 | 2.45e-11 | 6.11e-09 | 90 |
| GO:00016679 | Cervix | CC | ameboidal-type cell migration | 110/2311 | 475/18723 | 2.66e-11 | 6.36e-09 | 110 |
| GO:001063110 | Cervix | CC | epithelial cell migration | 89/2311 | 357/18723 | 3.72e-11 | 8.54e-09 | 89 |
| GO:009013010 | Cervix | CC | tissue migration | 90/2311 | 365/18723 | 5.42e-11 | 1.05e-08 | 90 |
| GO:00506737 | Cervix | CC | epithelial cell proliferation | 98/2311 | 437/18723 | 2.01e-09 | 2.15e-07 | 98 |
| GO:001063210 | Cervix | CC | regulation of epithelial cell migration | 72/2311 | 292/18723 | 4.52e-09 | 4.43e-07 | 72 |
| GO:00026837 | Cervix | CC | negative regulation of immune system process | 94/2311 | 434/18723 | 2.63e-08 | 1.87e-06 | 94 |
| GO:003009910 | Cervix | CC | myeloid cell differentiation | 83/2311 | 381/18723 | 1.31e-07 | 6.42e-06 | 83 |
| GO:00506787 | Cervix | CC | regulation of epithelial cell proliferation | 83/2311 | 381/18723 | 1.31e-07 | 6.42e-06 | 83 |
| GO:00106349 | Cervix | CC | positive regulation of epithelial cell migration | 47/2311 | 176/18723 | 1.73e-07 | 8.01e-06 | 47 |
| GO:190370610 | Cervix | CC | regulation of hemopoiesis | 80/2311 | 367/18723 | 2.14e-07 | 9.55e-06 | 80 |
| GO:000226210 | Cervix | CC | myeloid cell homeostasis | 43/2311 | 157/18723 | 2.66e-07 | 1.12e-05 | 43 |
| GO:00018908 | Cervix | CC | placenta development | 40/2311 | 144/18723 | 4.59e-07 | 1.77e-05 | 40 |
| GO:003410110 | Cervix | CC | erythrocyte homeostasis | 37/2311 | 129/18723 | 5.16e-07 | 1.93e-05 | 37 |
| GO:00614588 | Cervix | CC | reproductive system development | 87/2311 | 427/18723 | 1.37e-06 | 4.55e-05 | 87 |
| GO:00486088 | Cervix | CC | reproductive structure development | 86/2311 | 424/18723 | 1.90e-06 | 5.97e-05 | 86 |
| GO:003021810 | Cervix | CC | erythrocyte differentiation | 34/2311 | 120/18723 | 2.00e-06 | 6.18e-05 | 34 |
| GO:004887210 | Cervix | CC | homeostasis of number of cells | 61/2311 | 272/18723 | 2.17e-06 | 6.55e-05 | 61 |
| GO:00454445 | Cervix | CC | fat cell differentiation | 53/2311 | 229/18723 | 3.72e-06 | 9.75e-05 | 53 |
| Page: 1 2 3 4 5 6 7 8 9 10 11 12 13 14 15 16 17 18 19 20 21 22 23 24 25 26 27 28 29 |
| Pathway ID | Tissue | Disease Stage | Description | Gene Ratio | Bg Ratio | pvalue | p.adjust | qvalue | Count |
| Page: 1 |
Top |
Cell-cell communication analysis |
| Identification of potential cell-cell interactions between two cell types and their ligand-receptor pairs for different disease states |
| Ligand | Receptor | LRpair | Pathway | Tissue | Disease Stage |
| Page: 1 |
Top |
Single-cell gene regulatory network inference analysis |
| Find out the significant the regulons (TFs) and the target genes of each regulon across cell types for different disease states |
| TF | Cell Type | Tissue | Disease Stage | Target Gene | RSS | Regulon Activity |
| GATA2 | STM | Cervix | N_HPV | HPGDS,TPSB2,CPA3, etc. | 4.47e-01 |  |
| GATA2 | MAST | Endometrium | ADJ | VWA5A,TPSAB1,KIT, etc. | 1.02e-01 |  |
| GATA2 | STM | Esophagus | ESCC | GATA2-AS1,KBTBD8,SNAI1, etc. | 4.53e-01 |  |
| GATA2 | MVA | Liver | Cirrhotic | HEY1,SEMA3G,GJA5, etc. | 2.30e-01 |  |
| GATA2 | MVA | Liver | HCC | HEY1,SEMA3G,GJA5, etc. | 4.16e-01 |  |
| GATA2 | MAST | Lung | AAH | TPSB2,TPSAB1,CPA3, etc. | 1.60e-01 |  |
| GATA2 | MMC | Lung | ADJ | TPSB2,TPSAB1,CPA3, etc. | 2.63e-02 |  |
| GATA2 | MAST | Lung | AIS | TPSAB1,TPSB2,HPGDS, etc. | 3.39e-01 |  |
| GATA2 | MAST | Lung | IAC | TPSAB1,CPA3,TPSB2, etc. | 5.70e-02 |  |
| GATA2 | MMC | Lung | IAC | TPSAB1,CPA3,TPSB2, etc. | 3.89e-02 | |
| ∗The dot plots of a searched regulon are shown for all cell subpopulations in each disease state of each tissue based on the regulon specific score inferred using pySCENIC and by calculating the average expression. |
| Page: 1 2 |
Top |
Somatic mutation of malignant transformation related genes |
| Annotation of somatic variants for genes involved in malignant transformation |
| Hugo Symbol | Variant Class | Variant Classification | dbSNP RS | HGVSc | HGVSp | HGVSp Short | SWISSPROT | BIOTYPE | SIFT | PolyPhen | Tumor Sample Barcode | Tissue | Histology | Sex | Age | Stage | Therapy Types | Drugs | Outcome |
| GATA2 | SNV | Missense_Mutation | novel | c.416N>G | p.Ser139Cys | p.S139C | P23769 | protein_coding | deleterious(0.01) | possibly_damaging(0.789) | TCGA-3C-AALI-01 | Breast | breast invasive carcinoma | Female | <65 | I/II | Unspecific | Poly E | Complete Response |
| GATA2 | SNV | Missense_Mutation | c.1046N>C | p.Cys349Ser | p.C349S | P23769 | protein_coding | deleterious(0) | probably_damaging(1) | TCGA-AC-A23H-01 | Breast | breast invasive carcinoma | Female | >=65 | I/II | Unknown | Unknown | PD | |
| GATA2 | SNV | Missense_Mutation | c.1114G>A | p.Ala372Thr | p.A372T | P23769 | protein_coding | deleterious(0) | probably_damaging(1) | TCGA-AQ-A1H3-01 | Breast | breast invasive carcinoma | Female | <65 | III/IV | Chemotherapy | adriamycin | SD | |
| GATA2 | SNV | Missense_Mutation | c.1187N>A | p.Arg396Gln | p.R396Q | P23769 | protein_coding | deleterious(0) | probably_damaging(0.999) | TCGA-AA-A01R-01 | Colorectum | colon adenocarcinoma | Male | <65 | III/IV | Chemotherapy | 5-fluorouracil | PD | |
| GATA2 | SNV | Missense_Mutation | c.923N>A | p.Arg308Gln | p.R308Q | P23769 | protein_coding | deleterious(0) | probably_damaging(1) | TCGA-AZ-6601-01 | Colorectum | colon adenocarcinoma | Male | >=65 | I/II | Unknown | Unknown | PD | |
| GATA2 | SNV | Missense_Mutation | novel | c.357N>A | p.Ser119Arg | p.S119R | P23769 | protein_coding | deleterious(0) | benign(0.372) | TCGA-CA-6717-01 | Colorectum | colon adenocarcinoma | Male | <65 | I/II | Chemotherapy | oxaliplatin | CR |
| GATA2 | SNV | Missense_Mutation | rs387906631 | c.1061C>T | p.Thr354Met | p.T354M | P23769 | protein_coding | deleterious(0) | probably_damaging(0.999) | TCGA-CK-4951-01 | Colorectum | colon adenocarcinoma | Female | >=65 | I/II | Unknown | Unknown | PD |
| GATA2 | SNV | Missense_Mutation | c.631N>A | p.Val211Ile | p.V211I | P23769 | protein_coding | tolerated(1) | benign(0) | TCGA-CM-4746-01 | Colorectum | colon adenocarcinoma | Male | <65 | I/II | Unknown | Unknown | SD | |
| GATA2 | SNV | Missense_Mutation | c.529N>T | p.Pro177Ser | p.P177S | P23769 | protein_coding | tolerated(0.1) | probably_damaging(0.988) | TCGA-CM-6170-01 | Colorectum | colon adenocarcinoma | Female | >=65 | I/II | Unknown | Unknown | SD | |
| GATA2 | SNV | Missense_Mutation | novel | c.371N>T | p.Thr124Met | p.T124M | P23769 | protein_coding | deleterious(0.01) | benign(0.294) | TCGA-F5-6814-01 | Colorectum | rectum adenocarcinoma | Male | <65 | I/II | Unknown | Unknown | SD |
| Page: 1 2 3 4 |
Top |
Related drugs of malignant transformation related genes |
| Identification of chemicals and drugs interact with genes involved in malignant transfromation |
| (DGIdb 4.0) |
| Entrez ID | Symbol | Category | Interaction Types | Drug Claim Name | Drug Name | PMIDs |
| 2624 | GATA2 | TRANSCRIPTION FACTOR, CLINICALLY ACTIONABLE, TRANSCRIPTION FACTOR COMPLEX | 5-AZACYTIDINE | AZACITIDINE | 12706120 | |
| 2624 | GATA2 | TRANSCRIPTION FACTOR, CLINICALLY ACTIONABLE, TRANSCRIPTION FACTOR COMPLEX | fasudil | FASUDIL | 22541434 | |
| 2624 | GATA2 | TRANSCRIPTION FACTOR, CLINICALLY ACTIONABLE, TRANSCRIPTION FACTOR COMPLEX | N/A | 22147895,22533337,22271902,22814295,25241285,23521373,21892162 | ||
| 2624 | GATA2 | TRANSCRIPTION FACTOR, CLINICALLY ACTIONABLE, TRANSCRIPTION FACTOR COMPLEX | BORTEZOMIB | BORTEZOMIB | 22541434 | |
| 2624 | GATA2 | TRANSCRIPTION FACTOR, CLINICALLY ACTIONABLE, TRANSCRIPTION FACTOR COMPLEX | EPO | EPOETIN ALFA | 8677751,9028967 | |
| 2624 | GATA2 | TRANSCRIPTION FACTOR, CLINICALLY ACTIONABLE, TRANSCRIPTION FACTOR COMPLEX | bortezomib | BORTEZOMIB | 22541434 | |
| 2624 | GATA2 | TRANSCRIPTION FACTOR, CLINICALLY ACTIONABLE, TRANSCRIPTION FACTOR COMPLEX | FASUDIL | FASUDIL | 22541434 |
| Page: 1 |

Copyright 2023-Present -The University of Texas Health Science Center at Houston |