
|
|||||
|
 | |
| |
| |
| |
| |
| |
|
Gene: GAS8 |
Gene summary for GAS8 |
| Gene information | Species | Human | Gene symbol | GAS8 | Gene ID | 2622 |
| Gene name | growth arrest specific 8 | |
| Gene Alias | CILD33 | |
| Cytomap | 16q24.3 | |
| Gene Type | protein-coding | GO ID | GO:0000003 | UniProtAcc | A0A087WZT7 |
Top |
Malignant transformation analysis |
| Identification of the aberrant gene expression in precancerous and cancerous lesions by comparing the gene expression of stem-like cells in diseased tissues with normal stem cells |
| Entrez ID | Symbol | Replicates | Species | Organ | Tissue | Adj P-value | Log2FC | Malignancy |
| 2622 | GAS8 | LZE4T | Human | Esophagus | ESCC | 3.56e-06 | 1.14e-01 | 0.0811 |
| 2622 | GAS8 | LZE7T | Human | Esophagus | ESCC | 6.97e-03 | 2.09e-01 | 0.0667 |
| 2622 | GAS8 | LZE20T | Human | Esophagus | ESCC | 3.62e-02 | 8.40e-02 | 0.0662 |
| 2622 | GAS8 | LZE24T | Human | Esophagus | ESCC | 1.61e-09 | 2.53e-01 | 0.0596 |
| 2622 | GAS8 | P1T-E | Human | Esophagus | ESCC | 2.40e-02 | 2.20e-01 | 0.0875 |
| 2622 | GAS8 | P2T-E | Human | Esophagus | ESCC | 6.10e-20 | 2.05e-01 | 0.1177 |
| 2622 | GAS8 | P4T-E | Human | Esophagus | ESCC | 3.67e-05 | 9.17e-02 | 0.1323 |
| 2622 | GAS8 | P5T-E | Human | Esophagus | ESCC | 5.09e-19 | 1.85e-01 | 0.1327 |
| 2622 | GAS8 | P8T-E | Human | Esophagus | ESCC | 1.76e-16 | 1.80e-01 | 0.0889 |
| 2622 | GAS8 | P9T-E | Human | Esophagus | ESCC | 8.65e-06 | 8.42e-02 | 0.1131 |
| 2622 | GAS8 | P10T-E | Human | Esophagus | ESCC | 2.31e-11 | 7.42e-02 | 0.116 |
| 2622 | GAS8 | P11T-E | Human | Esophagus | ESCC | 2.97e-10 | 3.05e-01 | 0.1426 |
| 2622 | GAS8 | P12T-E | Human | Esophagus | ESCC | 1.49e-20 | 1.28e-01 | 0.1122 |
| 2622 | GAS8 | P15T-E | Human | Esophagus | ESCC | 4.28e-06 | 8.82e-02 | 0.1149 |
| 2622 | GAS8 | P16T-E | Human | Esophagus | ESCC | 2.71e-11 | 1.79e-01 | 0.1153 |
| 2622 | GAS8 | P20T-E | Human | Esophagus | ESCC | 4.33e-11 | 1.86e-01 | 0.1124 |
| 2622 | GAS8 | P21T-E | Human | Esophagus | ESCC | 9.76e-21 | 2.87e-01 | 0.1617 |
| 2622 | GAS8 | P22T-E | Human | Esophagus | ESCC | 2.57e-20 | 1.87e-01 | 0.1236 |
| 2622 | GAS8 | P23T-E | Human | Esophagus | ESCC | 1.12e-18 | 3.80e-01 | 0.108 |
| 2622 | GAS8 | P24T-E | Human | Esophagus | ESCC | 6.10e-17 | 1.14e-01 | 0.1287 |
| Page: 1 2 3 4 |
| Tissue | Expression Dynamics | Abbreviation |
| Esophagus |  | ESCC: Esophageal squamous cell carcinoma |
| HGIN: High-grade intraepithelial neoplasias | ||
| LGIN: Low-grade intraepithelial neoplasias | ||
| Liver | 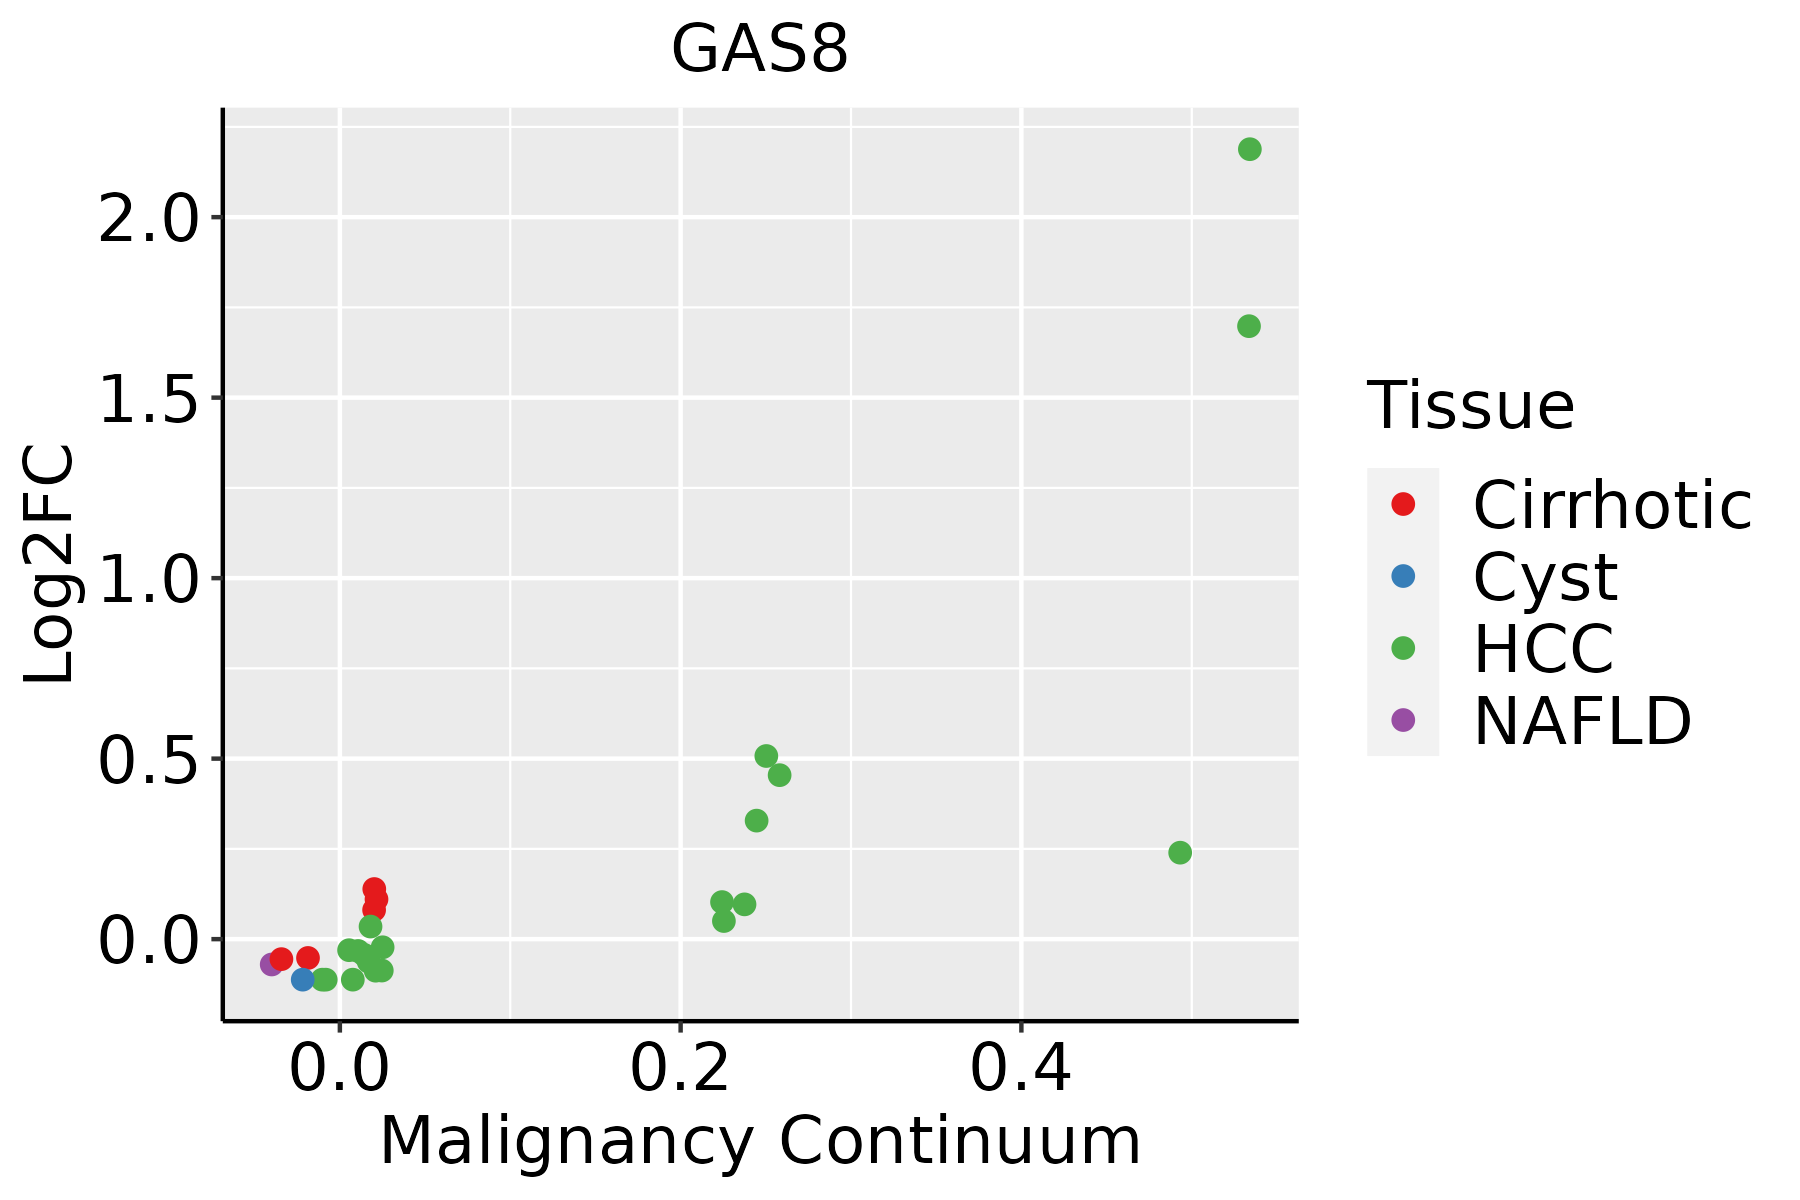 | HCC: Hepatocellular carcinoma |
| NAFLD: Non-alcoholic fatty liver disease |
| ∗log2FC in expression of this searched gene in stem-like cells from each diseased tissue sample relative to stem-like cells in normal samples in each tissue plotted against the malignancy continuum. Samples are colored based on if they are from different disease stage. |
Top |
Malignant transformation related pathway analysis |
| Find out the enriched GO biological processes and KEGG pathways involved in transition from healthy to precancer to cancer |
| Tissue | Disease Stage | Enriched GO biological Processes |
| Colorectum | AD |  |
| Colorectum | SER |  |
| Colorectum | MSS |  |
| Colorectum | MSI-H |  |
| Colorectum | FAP |  |
| ∗Top 15 enriched GO BP terms are showed in the bar plot of each disease state in each tissue. Each row represents a significant GO biological process which is colored according to the -log10(p.adjust). |
| Page: 1 2 3 4 5 6 7 8 9 |
| GO ID | Tissue | Disease Stage | Description | Gene Ratio | Bg Ratio | pvalue | p.adjust | Count |
| GO:0051098111 | Esophagus | ESCC | regulation of binding | 251/8552 | 363/18723 | 6.73e-20 | 8.46e-18 | 251 |
| GO:1903829111 | Esophagus | ESCC | positive regulation of cellular protein localization | 199/8552 | 276/18723 | 2.99e-19 | 3.45e-17 | 199 |
| GO:004339320 | Esophagus | ESCC | regulation of protein binding | 135/8552 | 196/18723 | 3.69e-11 | 1.22e-09 | 135 |
| GO:190382912 | Liver | Cirrhotic | positive regulation of cellular protein localization | 123/4634 | 276/18723 | 4.06e-13 | 3.22e-11 | 123 |
| GO:005109812 | Liver | Cirrhotic | regulation of binding | 148/4634 | 363/18723 | 9.14e-12 | 5.97e-10 | 148 |
| GO:004339312 | Liver | Cirrhotic | regulation of protein binding | 83/4634 | 196/18723 | 4.44e-08 | 1.42e-06 | 83 |
| GO:190382922 | Liver | HCC | positive regulation of cellular protein localization | 199/7958 | 276/18723 | 1.15e-23 | 2.62e-21 | 199 |
| GO:005109822 | Liver | HCC | regulation of binding | 225/7958 | 363/18723 | 3.78e-14 | 2.37e-12 | 225 |
| GO:004339322 | Liver | HCC | regulation of protein binding | 129/7958 | 196/18723 | 3.27e-11 | 1.26e-09 | 129 |
| Page: 1 |
| Pathway ID | Tissue | Disease Stage | Description | Gene Ratio | Bg Ratio | pvalue | p.adjust | qvalue | Count |
| Page: 1 |
Top |
Cell-cell communication analysis |
| Identification of potential cell-cell interactions between two cell types and their ligand-receptor pairs for different disease states |
| Ligand | Receptor | LRpair | Pathway | Tissue | Disease Stage |
| Page: 1 |
Top |
Single-cell gene regulatory network inference analysis |
| Find out the significant the regulons (TFs) and the target genes of each regulon across cell types for different disease states |
| TF | Cell Type | Tissue | Disease Stage | Target Gene | RSS | Regulon Activity |
| ∗The dot plots of a searched regulon are shown for all cell subpopulations in each disease state of each tissue based on the regulon specific score inferred using pySCENIC and by calculating the average expression. |
| Page: 1 |
Top |
Somatic mutation of malignant transformation related genes |
| Annotation of somatic variants for genes involved in malignant transformation |
| Hugo Symbol | Variant Class | Variant Classification | dbSNP RS | HGVSc | HGVSp | HGVSp Short | SWISSPROT | BIOTYPE | SIFT | PolyPhen | Tumor Sample Barcode | Tissue | Histology | Sex | Age | Stage | Therapy Types | Drugs | Outcome |
| GAS8 | SNV | Missense_Mutation | c.247N>A | p.Glu83Lys | p.E83K | O95995 | protein_coding | deleterious(0) | possibly_damaging(0.878) | TCGA-BH-A0EE-01 | Breast | breast invasive carcinoma | Female | >=65 | I/II | Chemotherapy | docetaxel | SD | |
| GAS8 | insertion | Frame_Shift_Ins | novel | c.634_635insCT | p.Glu212AlafsTer12 | p.E212Afs*12 | O95995 | protein_coding | TCGA-A7-A0D9-01 | Breast | breast invasive carcinoma | Female | <65 | I/II | Chemotherapy | taxotere | SD | ||
| GAS8 | insertion | Nonsense_Mutation | novel | c.635_636insAAATCAGTAGTTATCAGCAGGTGGTAGCTATTCAGTGCCGT | p.Glu213AsnfsTer3 | p.E213Nfs*3 | O95995 | protein_coding | TCGA-A7-A0D9-01 | Breast | breast invasive carcinoma | Female | <65 | I/II | Chemotherapy | taxotere | SD | ||
| GAS8 | insertion | Frame_Shift_Ins | novel | c.603_604insAG | p.Leu202SerfsTer22 | p.L202Sfs*22 | O95995 | protein_coding | TCGA-BH-A0B8-01 | Breast | breast invasive carcinoma | Female | <65 | I/II | Hormone Therapy | arimidex | SD | ||
| GAS8 | insertion | In_Frame_Ins | novel | c.605_606insATCAGCAGGTGGTAGCTATTCAGTGCCGTG | p.Leu202_Arg203insSerAlaGlyGlySerTyrSerValProTrp | p.L202_R203insSAGGSYSVPW | O95995 | protein_coding | TCGA-BH-A0B8-01 | Breast | breast invasive carcinoma | Female | <65 | I/II | Hormone Therapy | arimidex | SD | ||
| GAS8 | deletion | Frame_Shift_Del | novel | c.1178delA | p.Asn393ThrfsTer7 | p.N393Tfs*7 | O95995 | protein_coding | TCGA-D8-A27V-01 | Breast | breast invasive carcinoma | Female | <65 | I/II | Hormone Therapy | tamoxiphen | SD | ||
| GAS8 | SNV | Missense_Mutation | rs138136933 | c.674G>A | p.Arg225His | p.R225H | O95995 | protein_coding | tolerated(0.24) | benign(0.42) | TCGA-2W-A8YY-01 | Cervix | cervical & endocervical cancer | Female | <65 | I/II | Chemotherapy | cisplatin | CR |
| GAS8 | SNV | Missense_Mutation | c.226N>A | p.Glu76Lys | p.E76K | O95995 | protein_coding | tolerated(0.07) | benign(0.432) | TCGA-HM-A4S6-01 | Cervix | cervical & endocervical cancer | Female | <65 | III/IV | Chemotherapy | cisplatin | CR | |
| GAS8 | SNV | Missense_Mutation | rs374824417 | c.860N>A | p.Arg287Gln | p.R287Q | O95995 | protein_coding | tolerated(0.89) | benign(0.007) | TCGA-A6-2686-01 | Colorectum | colon adenocarcinoma | Female | >=65 | I/II | Unknown | Unknown | SD |
| GAS8 | SNV | Missense_Mutation | novel | c.472G>A | p.Val158Met | p.V158M | O95995 | protein_coding | tolerated(0.13) | benign(0.03) | TCGA-AA-3845-01 | Colorectum | colon adenocarcinoma | Female | >=65 | I/II | Unknown | Unknown | PD |
| Page: 1 2 3 4 5 |
Top |
Related drugs of malignant transformation related genes |
| Identification of chemicals and drugs interact with genes involved in malignant transfromation |
| (DGIdb 4.0) |
| Entrez ID | Symbol | Category | Interaction Types | Drug Claim Name | Drug Name | PMIDs |
| Page: 1 |

Copyright 2023-Present -The University of Texas Health Science Center at Houston |