
|
|||||
|
 | |
| |
| |
| |
| |
| |
|
Gene: GAS7 |
Gene summary for GAS7 |
| Gene information | Species | Human | Gene symbol | GAS7 | Gene ID | 8522 |
| Gene name | growth arrest specific 7 | |
| Gene Alias | GAS7 | |
| Cytomap | 17p13.1 | |
| Gene Type | protein-coding | GO ID | GO:0000902 | UniProtAcc | O60861 |
Top |
Malignant transformation analysis |
| Identification of the aberrant gene expression in precancerous and cancerous lesions by comparing the gene expression of stem-like cells in diseased tissues with normal stem cells |
| Entrez ID | Symbol | Replicates | Species | Organ | Tissue | Adj P-value | Log2FC | Malignancy |
| 8522 | GAS7 | AEH-subject4 | Human | Endometrium | AEH | 4.30e-06 | 3.20e-01 | -0.2657 |
| 8522 | GAS7 | AEH-subject5 | Human | Endometrium | AEH | 2.47e-02 | 2.07e-01 | -0.2953 |
| 8522 | GAS7 | EEC-subject1 | Human | Endometrium | EEC | 1.32e-14 | 5.32e-01 | -0.2682 |
| 8522 | GAS7 | GSM6177620_NYU_UCEC1_lib1_lib1 | Human | Endometrium | EEC | 4.62e-05 | -3.47e-02 | -0.1869 |
| 8522 | GAS7 | GSM6177620_NYU_UCEC1_lib2_lib2 | Human | Endometrium | EEC | 3.23e-05 | 4.78e-02 | -0.1875 |
| 8522 | GAS7 | GSM6177620_NYU_UCEC1_lib3_lib3 | Human | Endometrium | EEC | 3.26e-07 | 8.74e-03 | -0.1883 |
| 8522 | GAS7 | GSM6177621_NYU_UCEC2_lib1_lib1 | Human | Endometrium | EEC | 3.99e-12 | 2.95e-01 | -0.1934 |
| 8522 | GAS7 | GSM6177622_NYU_UCEC3_lib1_lib1 | Human | Endometrium | EEC | 2.15e-08 | 1.01e-01 | -0.1917 |
| 8522 | GAS7 | GSM6177622_NYU_UCEC3_lib2_lib2 | Human | Endometrium | EEC | 1.13e-08 | 6.89e-02 | -0.1916 |
| 8522 | GAS7 | P2T-E | Human | Esophagus | ESCC | 2.67e-03 | 9.36e-02 | 0.1177 |
| 8522 | GAS7 | P4T-E | Human | Esophagus | ESCC | 2.20e-02 | 1.60e-01 | 0.1323 |
| 8522 | GAS7 | P8T-E | Human | Esophagus | ESCC | 2.40e-02 | 1.47e-01 | 0.0889 |
| 8522 | GAS7 | P9T-E | Human | Esophagus | ESCC | 1.45e-04 | 2.05e-01 | 0.1131 |
| 8522 | GAS7 | P11T-E | Human | Esophagus | ESCC | 7.73e-16 | 9.04e-01 | 0.1426 |
| 8522 | GAS7 | P19T-E | Human | Esophagus | ESCC | 1.17e-11 | 1.37e+00 | 0.1662 |
| 8522 | GAS7 | P32T-E | Human | Esophagus | ESCC | 4.20e-03 | 2.98e-01 | 0.1666 |
| 8522 | GAS7 | P42T-E | Human | Esophagus | ESCC | 2.62e-05 | 3.19e-01 | 0.1175 |
| 8522 | GAS7 | P44T-E | Human | Esophagus | ESCC | 4.27e-08 | 2.32e-01 | 0.1096 |
| 8522 | GAS7 | P61T-E | Human | Esophagus | ESCC | 4.08e-06 | 2.17e-01 | 0.099 |
| 8522 | GAS7 | P79T-E | Human | Esophagus | ESCC | 3.45e-12 | 2.07e-01 | 0.1154 |
| Page: 1 2 |
| Tissue | Expression Dynamics | Abbreviation |
| Endometrium |  | AEH: Atypical endometrial hyperplasia |
| EEC: Endometrioid Cancer | ||
| Esophagus | 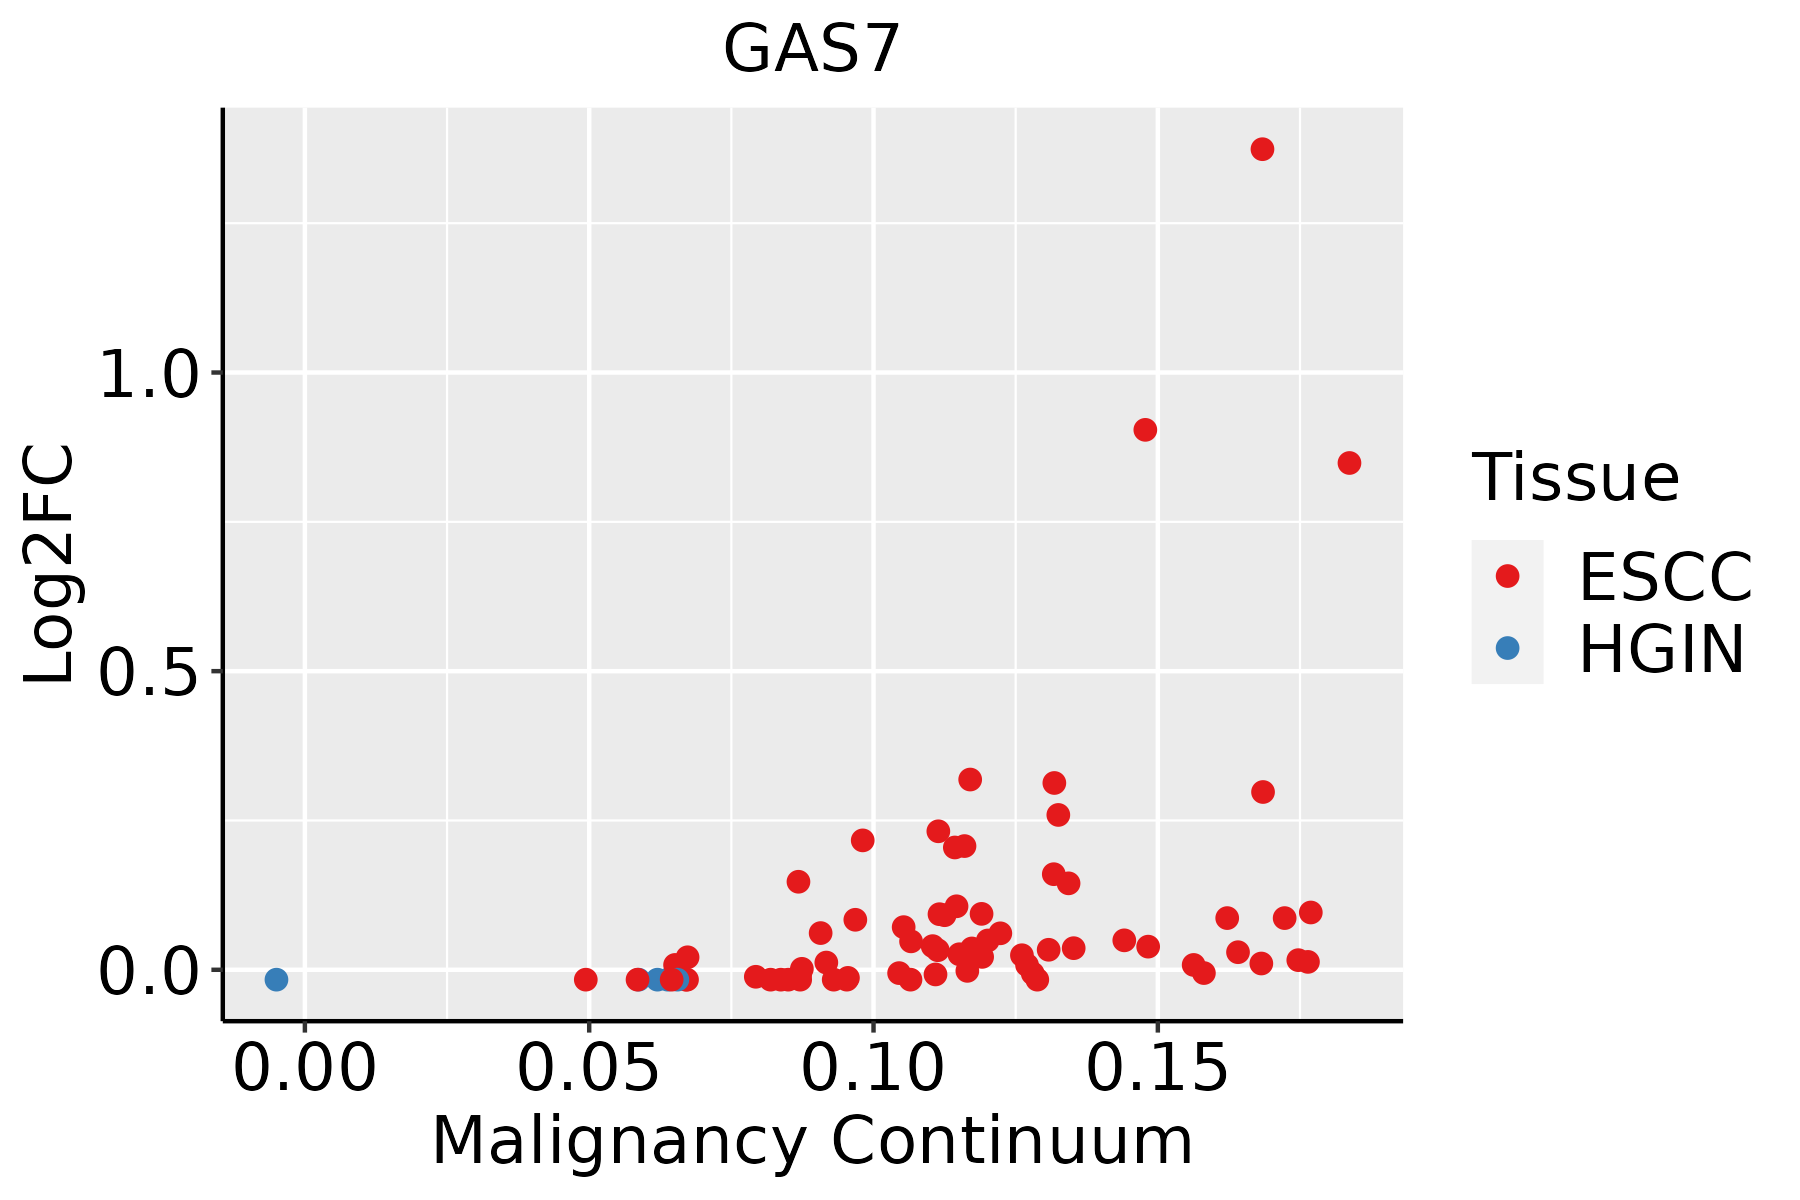 | ESCC: Esophageal squamous cell carcinoma |
| HGIN: High-grade intraepithelial neoplasias | ||
| LGIN: Low-grade intraepithelial neoplasias | ||
| Liver | 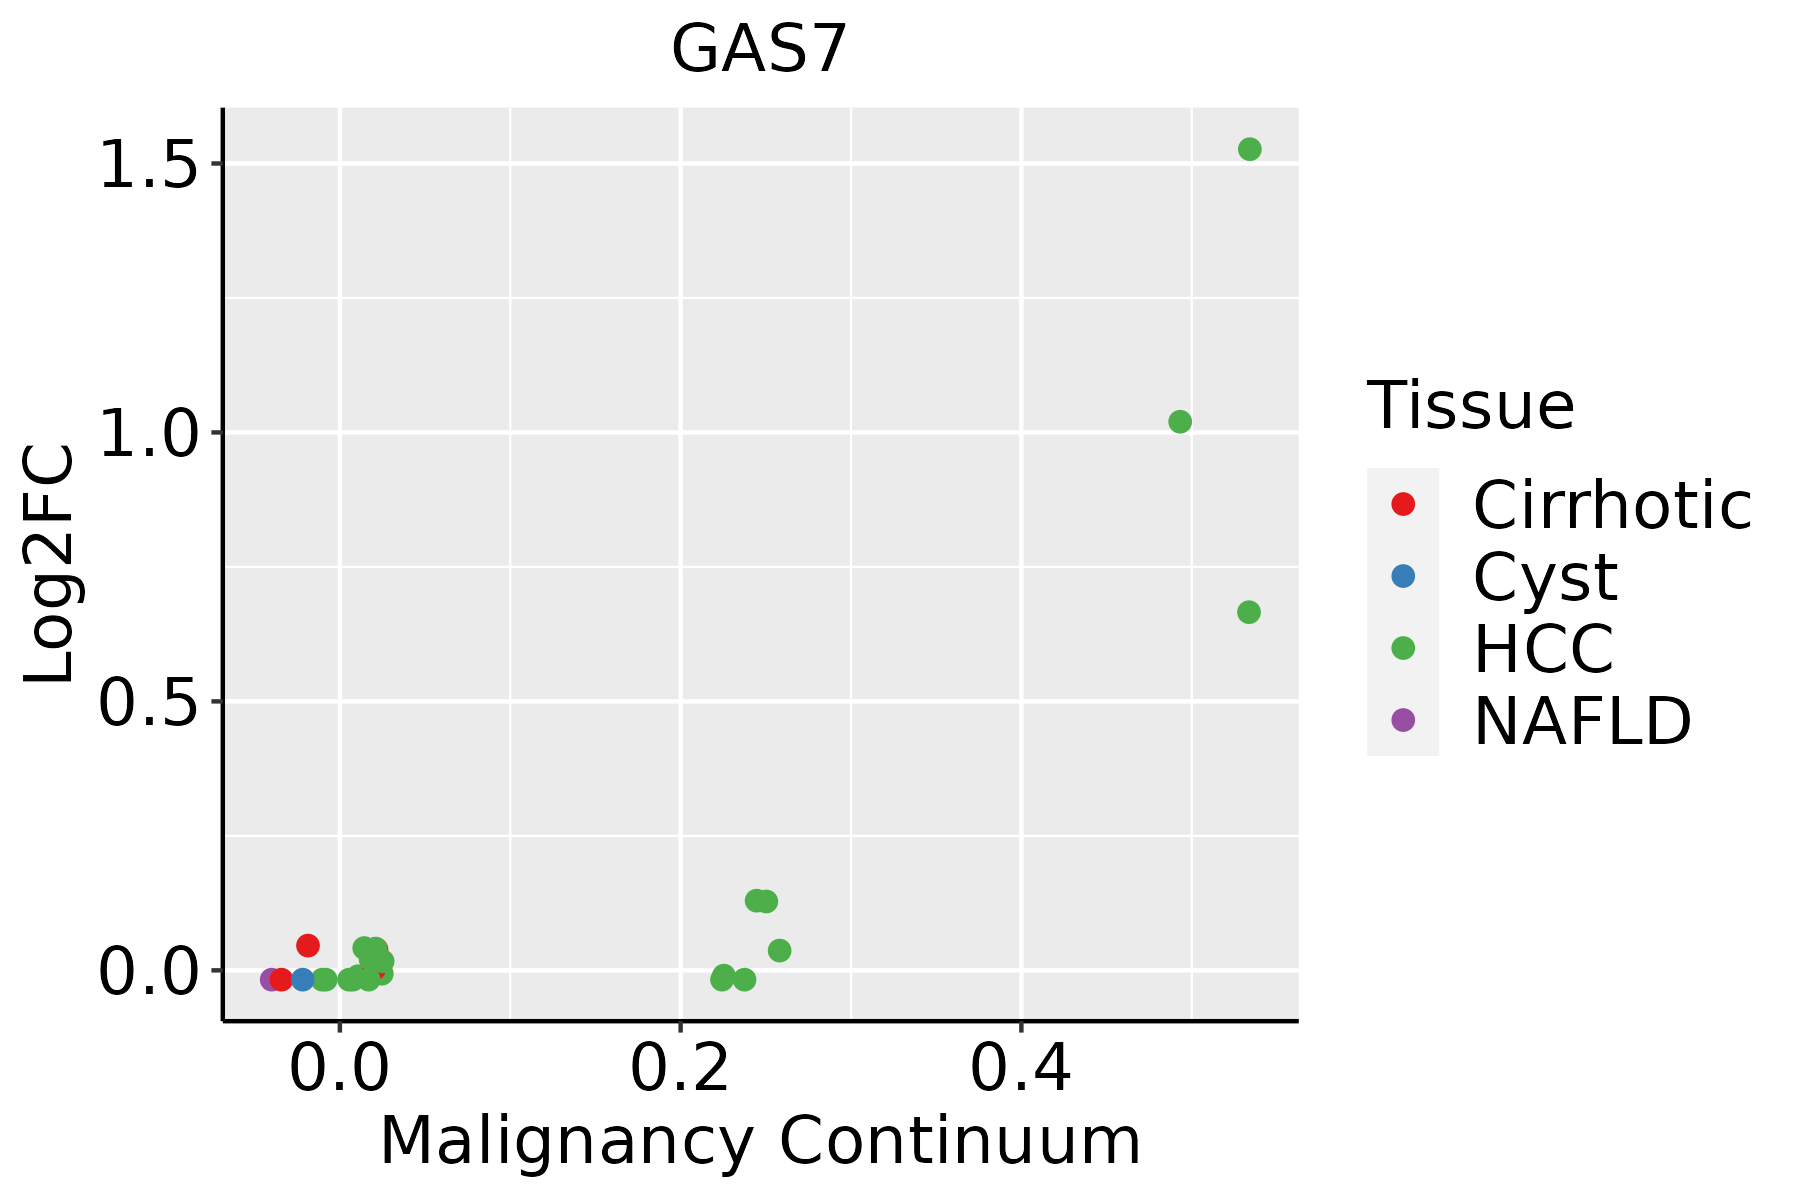 | HCC: Hepatocellular carcinoma |
| NAFLD: Non-alcoholic fatty liver disease |
| ∗log2FC in expression of this searched gene in stem-like cells from each diseased tissue sample relative to stem-like cells in normal samples in each tissue plotted against the malignancy continuum. Samples are colored based on if they are from different disease stage. |
Top |
Malignant transformation related pathway analysis |
| Find out the enriched GO biological processes and KEGG pathways involved in transition from healthy to precancer to cancer |
| Tissue | Disease Stage | Enriched GO biological Processes |
| Colorectum | AD |  |
| Colorectum | SER |  |
| Colorectum | MSS |  |
| Colorectum | MSI-H |  |
| Colorectum | FAP |  |
| ∗Top 15 enriched GO BP terms are showed in the bar plot of each disease state in each tissue. Each row represents a significant GO biological process which is colored according to the -log10(p.adjust). |
| Page: 1 2 3 4 5 6 7 8 9 |
| GO ID | Tissue | Disease Stage | Description | Gene Ratio | Bg Ratio | pvalue | p.adjust | Count |
| GO:000701516 | Endometrium | AEH | actin filament organization | 98/2100 | 442/18723 | 1.99e-11 | 2.98e-09 | 98 |
| GO:005125816 | Endometrium | AEH | protein polymerization | 62/2100 | 297/18723 | 9.04e-07 | 3.19e-05 | 62 |
| GO:000815410 | Endometrium | AEH | actin polymerization or depolymerization | 44/2100 | 218/18723 | 7.64e-05 | 1.15e-03 | 44 |
| GO:003004110 | Endometrium | AEH | actin filament polymerization | 39/2100 | 191/18723 | 1.47e-04 | 1.96e-03 | 39 |
| GO:000701517 | Endometrium | EEC | actin filament organization | 95/2168 | 442/18723 | 1.31e-09 | 1.09e-07 | 95 |
| GO:005125817 | Endometrium | EEC | protein polymerization | 63/2168 | 297/18723 | 1.24e-06 | 4.07e-05 | 63 |
| GO:000815415 | Endometrium | EEC | actin polymerization or depolymerization | 44/2168 | 218/18723 | 1.59e-04 | 2.00e-03 | 44 |
| GO:003004115 | Endometrium | EEC | actin filament polymerization | 39/2168 | 191/18723 | 2.85e-04 | 3.22e-03 | 39 |
| GO:0051258111 | Esophagus | ESCC | protein polymerization | 183/8552 | 297/18723 | 1.94e-08 | 3.75e-07 | 183 |
| GO:000701527 | Esophagus | ESCC | actin filament organization | 259/8552 | 442/18723 | 2.37e-08 | 4.50e-07 | 259 |
| GO:000815420 | Esophagus | ESCC | actin polymerization or depolymerization | 130/8552 | 218/18723 | 2.19e-05 | 1.88e-04 | 130 |
| GO:0030041110 | Esophagus | ESCC | actin filament polymerization | 114/8552 | 191/18723 | 6.46e-05 | 4.92e-04 | 114 |
| GO:005125822 | Liver | HCC | protein polymerization | 182/7958 | 297/18723 | 4.17e-11 | 1.58e-09 | 182 |
| GO:000701522 | Liver | HCC | actin filament organization | 252/7958 | 442/18723 | 3.83e-10 | 1.25e-08 | 252 |
| GO:000815422 | Liver | HCC | actin polymerization or depolymerization | 130/7958 | 218/18723 | 2.31e-07 | 4.14e-06 | 130 |
| GO:003004122 | Liver | HCC | actin filament polymerization | 116/7958 | 191/18723 | 2.66e-07 | 4.68e-06 | 116 |
| Page: 1 |
| Pathway ID | Tissue | Disease Stage | Description | Gene Ratio | Bg Ratio | pvalue | p.adjust | qvalue | Count |
| Page: 1 |
Top |
Cell-cell communication analysis |
| Identification of potential cell-cell interactions between two cell types and their ligand-receptor pairs for different disease states |
| Ligand | Receptor | LRpair | Pathway | Tissue | Disease Stage |
| Page: 1 |
Top |
Single-cell gene regulatory network inference analysis |
| Find out the significant the regulons (TFs) and the target genes of each regulon across cell types for different disease states |
| TF | Cell Type | Tissue | Disease Stage | Target Gene | RSS | Regulon Activity |
| ∗The dot plots of a searched regulon are shown for all cell subpopulations in each disease state of each tissue based on the regulon specific score inferred using pySCENIC and by calculating the average expression. |
| Page: 1 |
Top |
Somatic mutation of malignant transformation related genes |
| Annotation of somatic variants for genes involved in malignant transformation |
| Hugo Symbol | Variant Class | Variant Classification | dbSNP RS | HGVSc | HGVSp | HGVSp Short | SWISSPROT | BIOTYPE | SIFT | PolyPhen | Tumor Sample Barcode | Tissue | Histology | Sex | Age | Stage | Therapy Types | Drugs | Outcome |
| GAS7 | SNV | Missense_Mutation | novel | c.945N>A | p.Met315Ile | p.M315I | O60861 | protein_coding | deleterious(0.04) | benign(0.138) | TCGA-5L-AAT1-01 | Breast | breast invasive carcinoma | Female | <65 | III/IV | Hormone Therapy | letrozol | SD |
| GAS7 | SNV | Missense_Mutation | rs774783663 | c.1153N>T | p.Arg385Cys | p.R385C | O60861 | protein_coding | deleterious(0.03) | probably_damaging(0.952) | TCGA-AN-A0FN-01 | Breast | breast invasive carcinoma | Female | <65 | I/II | Unknown | Unknown | SD |
| GAS7 | SNV | Missense_Mutation | rs779042022 | c.848N>T | p.Ala283Val | p.A283V | O60861 | protein_coding | tolerated(0.44) | possibly_damaging(0.489) | TCGA-AN-A0FS-01 | Breast | breast invasive carcinoma | Female | <65 | I/II | Unknown | Unknown | SD |
| GAS7 | SNV | Missense_Mutation | novel | c.732G>C | p.Arg244Ser | p.R244S | O60861 | protein_coding | deleterious(0) | probably_damaging(0.998) | TCGA-LQ-A4E4-01 | Breast | breast invasive carcinoma | Female | >=65 | III/IV | Hormone Therapy | anastrozole | PD |
| GAS7 | insertion | Frame_Shift_Ins | novel | c.852_853insCCATCCTCAGGGCTCAGGATGGTGTCTTGCATGTA | p.Glu285ProfsTer12 | p.E285Pfs*12 | O60861 | protein_coding | TCGA-AO-A03R-01 | Breast | breast invasive carcinoma | Female | <65 | I/II | Chemotherapy | doxorubicin | SD | ||
| GAS7 | SNV | Missense_Mutation | novel | c.1376T>G | p.Leu459Arg | p.L459R | O60861 | protein_coding | tolerated(0.11) | benign(0.031) | TCGA-5M-AAT6-01 | Colorectum | colon adenocarcinoma | Female | <65 | III/IV | Unknown | Unknown | PD |
| GAS7 | SNV | Missense_Mutation | c.977G>A | p.Arg326His | p.R326H | O60861 | protein_coding | deleterious(0) | possibly_damaging(0.648) | TCGA-AA-3833-01 | Colorectum | colon adenocarcinoma | Female | <65 | I/II | Unknown | Unknown | SD | |
| GAS7 | SNV | Missense_Mutation | novel | c.1163N>G | p.Asp388Gly | p.D388G | O60861 | protein_coding | deleterious(0.01) | probably_damaging(0.946) | TCGA-AA-3845-01 | Colorectum | colon adenocarcinoma | Female | >=65 | I/II | Unknown | Unknown | PD |
| GAS7 | SNV | Missense_Mutation | rs779042022 | c.848N>T | p.Ala283Val | p.A283V | O60861 | protein_coding | tolerated(0.44) | possibly_damaging(0.489) | TCGA-AA-3984-01 | Colorectum | colon adenocarcinoma | Female | <65 | I/II | Unknown | Unknown | SD |
| GAS7 | SNV | Missense_Mutation | rs749184881 | c.1229N>A | p.Arg410Gln | p.R410Q | O60861 | protein_coding | deleterious(0.01) | benign(0.413) | TCGA-AA-A00N-01 | Colorectum | colon adenocarcinoma | Male | >=65 | I/II | Unknown | Unknown | PD |
| Page: 1 2 3 4 5 6 7 8 |
Top |
Related drugs of malignant transformation related genes |
| Identification of chemicals and drugs interact with genes involved in malignant transfromation |
| (DGIdb 4.0) |
| Entrez ID | Symbol | Category | Interaction Types | Drug Claim Name | Drug Name | PMIDs |
| Page: 1 |

Copyright 2023-Present -The University of Texas Health Science Center at Houston |