
|
|||||
|
 | |
| |
| |
| |
| |
| |
|
Gene: GAS6 |
Gene summary for GAS6 |
| Gene information | Species | Human | Gene symbol | GAS6 | Gene ID | 2621 |
| Gene name | growth arrest specific 6 | |
| Gene Alias | AXLLG | |
| Cytomap | 13q34 | |
| Gene Type | protein-coding | GO ID | GO:0000165 | UniProtAcc | Q14393 |
Top |
Malignant transformation analysis |
| Identification of the aberrant gene expression in precancerous and cancerous lesions by comparing the gene expression of stem-like cells in diseased tissues with normal stem cells |
| Entrez ID | Symbol | Replicates | Species | Organ | Tissue | Adj P-value | Log2FC | Malignancy |
| 2621 | GAS6 | AEH-subject1 | Human | Endometrium | AEH | 9.34e-11 | -4.01e-01 | -0.3059 |
| 2621 | GAS6 | AEH-subject2 | Human | Endometrium | AEH | 1.55e-13 | -3.90e-01 | -0.2525 |
| 2621 | GAS6 | AEH-subject3 | Human | Endometrium | AEH | 1.47e-02 | -2.80e-01 | -0.2576 |
| 2621 | GAS6 | AEH-subject4 | Human | Endometrium | AEH | 3.33e-07 | -3.06e-01 | -0.2657 |
| 2621 | GAS6 | AEH-subject5 | Human | Endometrium | AEH | 1.76e-18 | -4.69e-01 | -0.2953 |
| 2621 | GAS6 | EEC-subject1 | Human | Endometrium | EEC | 8.69e-23 | -4.84e-01 | -0.2682 |
| 2621 | GAS6 | EEC-subject2 | Human | Endometrium | EEC | 1.75e-20 | -4.39e-01 | -0.2607 |
| 2621 | GAS6 | EEC-subject3 | Human | Endometrium | EEC | 4.18e-28 | -4.25e-01 | -0.2525 |
| 2621 | GAS6 | EEC-subject4 | Human | Endometrium | EEC | 3.64e-08 | -3.49e-01 | -0.2571 |
| 2621 | GAS6 | EEC-subject5 | Human | Endometrium | EEC | 3.06e-19 | -4.82e-01 | -0.249 |
| 2621 | GAS6 | GSM5276934 | Human | Endometrium | EEC | 1.09e-03 | -3.01e-01 | -0.0913 |
| 2621 | GAS6 | GSM5276935 | Human | Endometrium | EEC | 5.54e-16 | -4.70e-01 | -0.123 |
| 2621 | GAS6 | GSM5276937 | Human | Endometrium | EEC | 2.81e-03 | -2.63e-01 | -0.0897 |
| 2621 | GAS6 | GSM6177620_NYU_UCEC1_lib1_lib1 | Human | Endometrium | EEC | 1.92e-27 | -5.43e-01 | -0.1869 |
| 2621 | GAS6 | GSM6177620_NYU_UCEC1_lib2_lib2 | Human | Endometrium | EEC | 1.71e-24 | -5.43e-01 | -0.1875 |
| 2621 | GAS6 | GSM6177620_NYU_UCEC1_lib3_lib3 | Human | Endometrium | EEC | 3.65e-25 | -5.15e-01 | -0.1883 |
| 2621 | GAS6 | GSM6177621_NYU_UCEC2_lib1_lib1 | Human | Endometrium | EEC | 1.93e-30 | -5.08e-01 | -0.1934 |
| 2621 | GAS6 | GSM6177622_NYU_UCEC3_lib1_lib1 | Human | Endometrium | EEC | 1.15e-28 | -5.03e-01 | -0.1917 |
| 2621 | GAS6 | GSM6177622_NYU_UCEC3_lib2_lib2 | Human | Endometrium | EEC | 1.05e-34 | -5.18e-01 | -0.1916 |
| 2621 | GAS6 | GSM6177623_NYU_UCEC3_Vis | Human | Endometrium | EEC | 6.83e-04 | -2.09e-01 | -0.1269 |
| Page: 1 2 3 4 5 6 |
| Tissue | Expression Dynamics | Abbreviation |
| Endometrium | 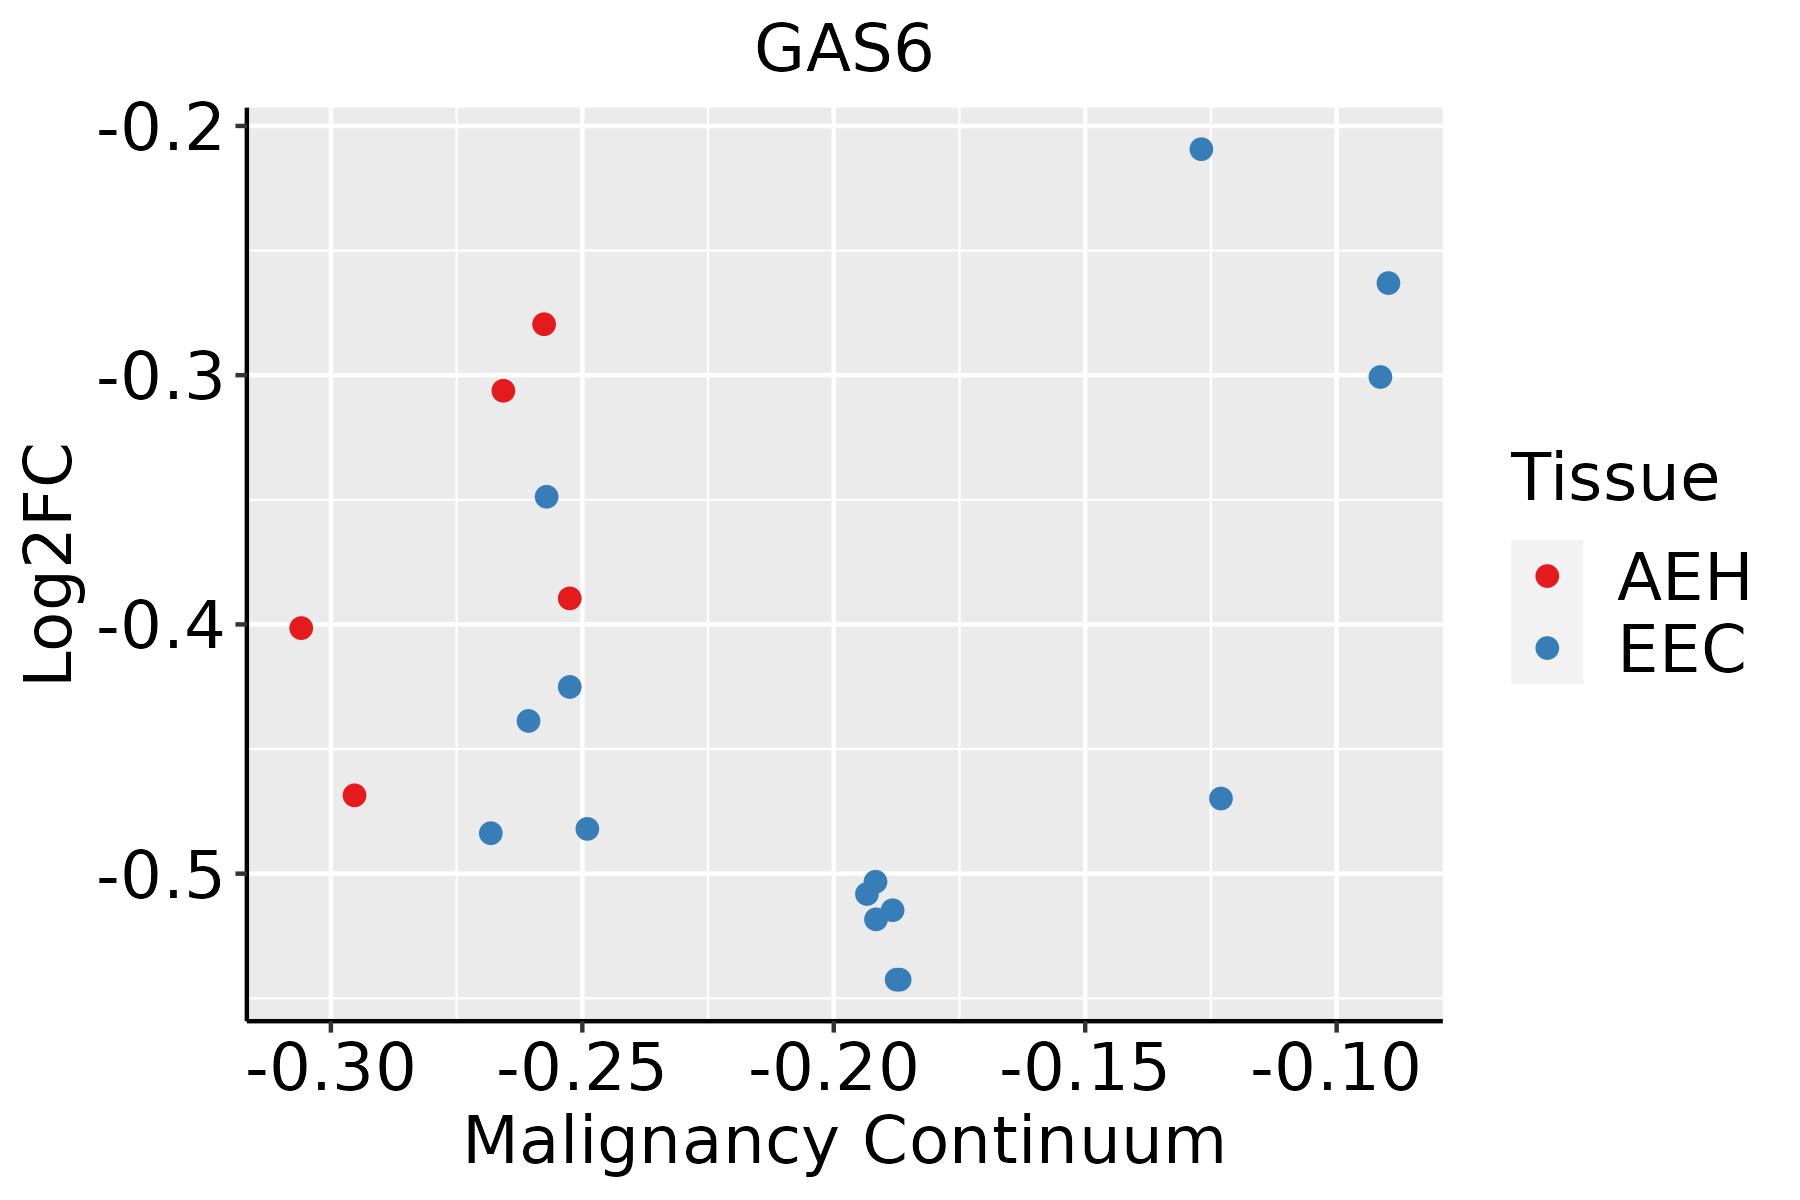 | AEH: Atypical endometrial hyperplasia |
| EEC: Endometrioid Cancer | ||
| Esophagus |  | ESCC: Esophageal squamous cell carcinoma |
| HGIN: High-grade intraepithelial neoplasias | ||
| LGIN: Low-grade intraepithelial neoplasias | ||
| Oral Cavity | 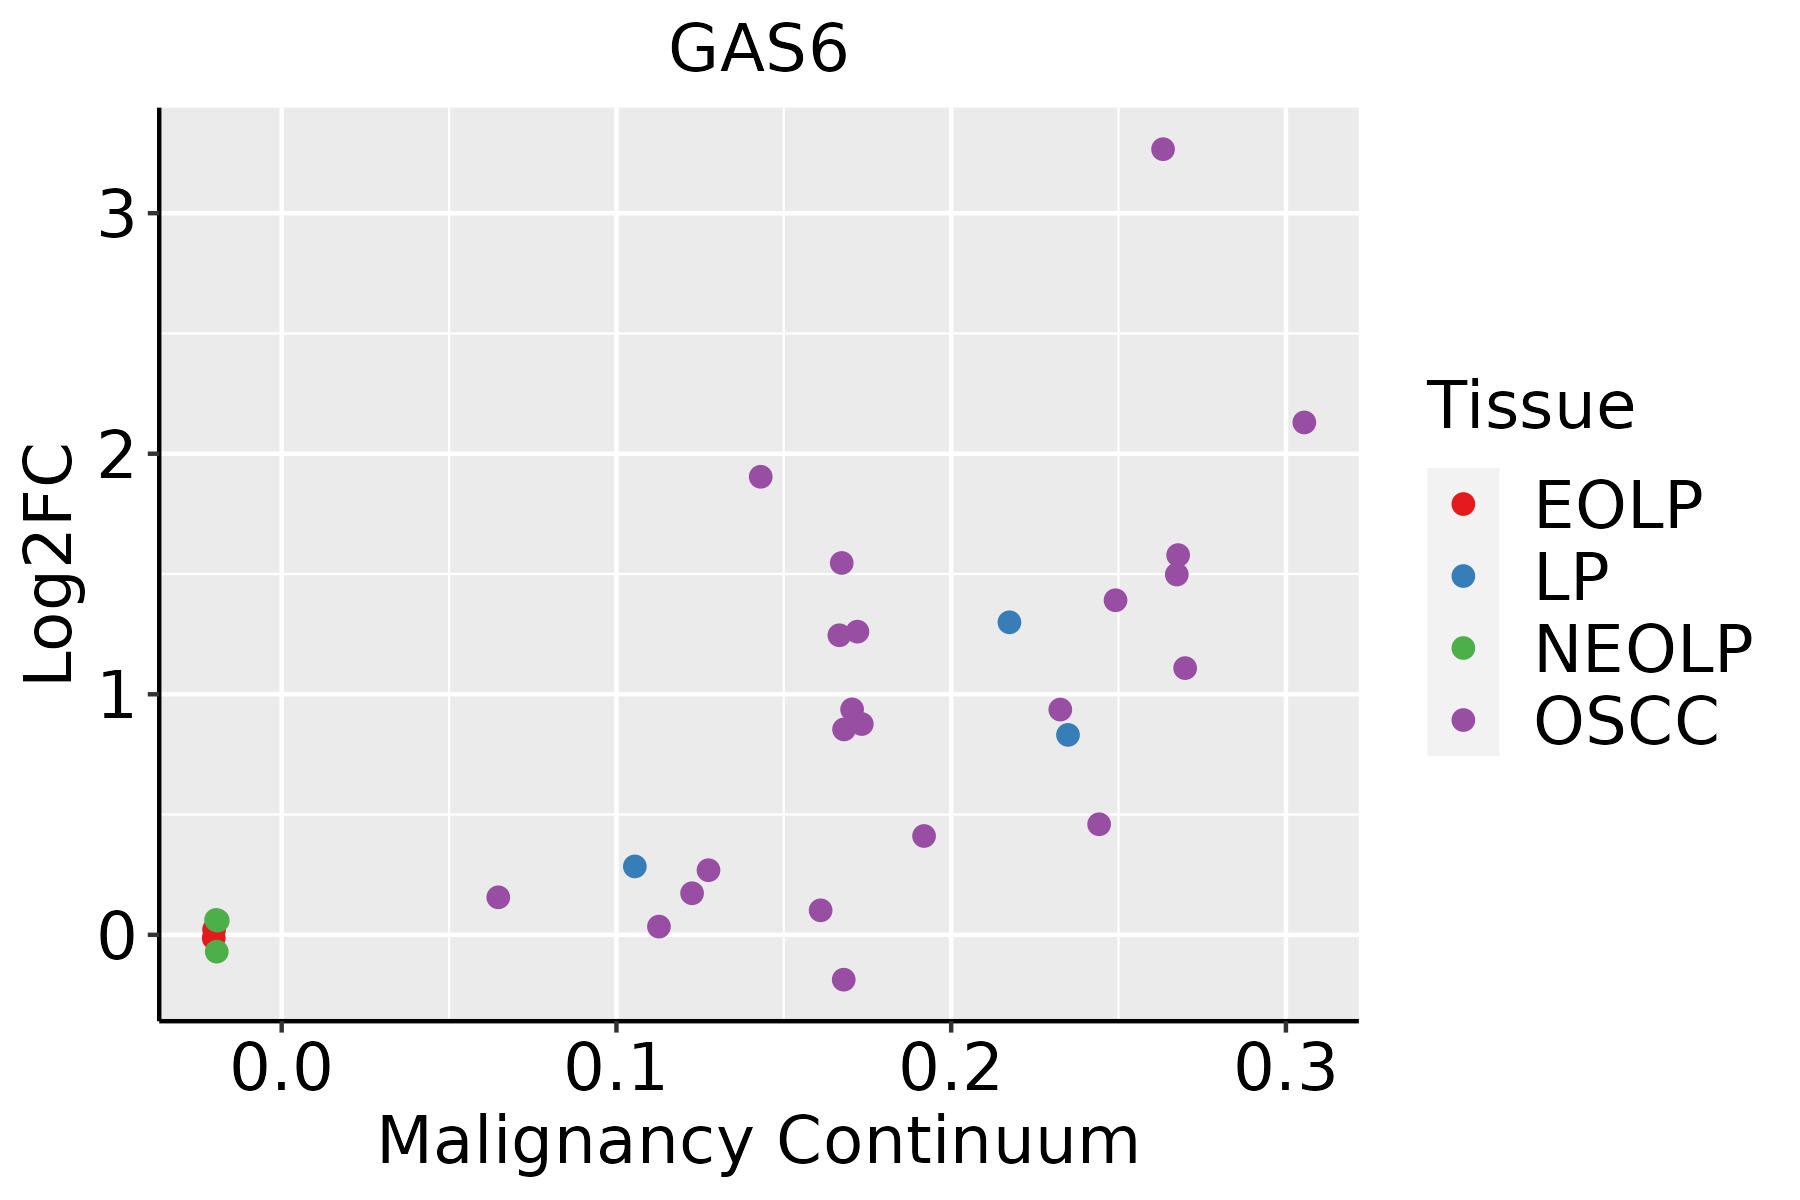 | EOLP: Erosive Oral lichen planus |
| LP: leukoplakia | ||
| NEOLP: Non-erosive oral lichen planus | ||
| OSCC: Oral squamous cell carcinoma | ||
| Skin | 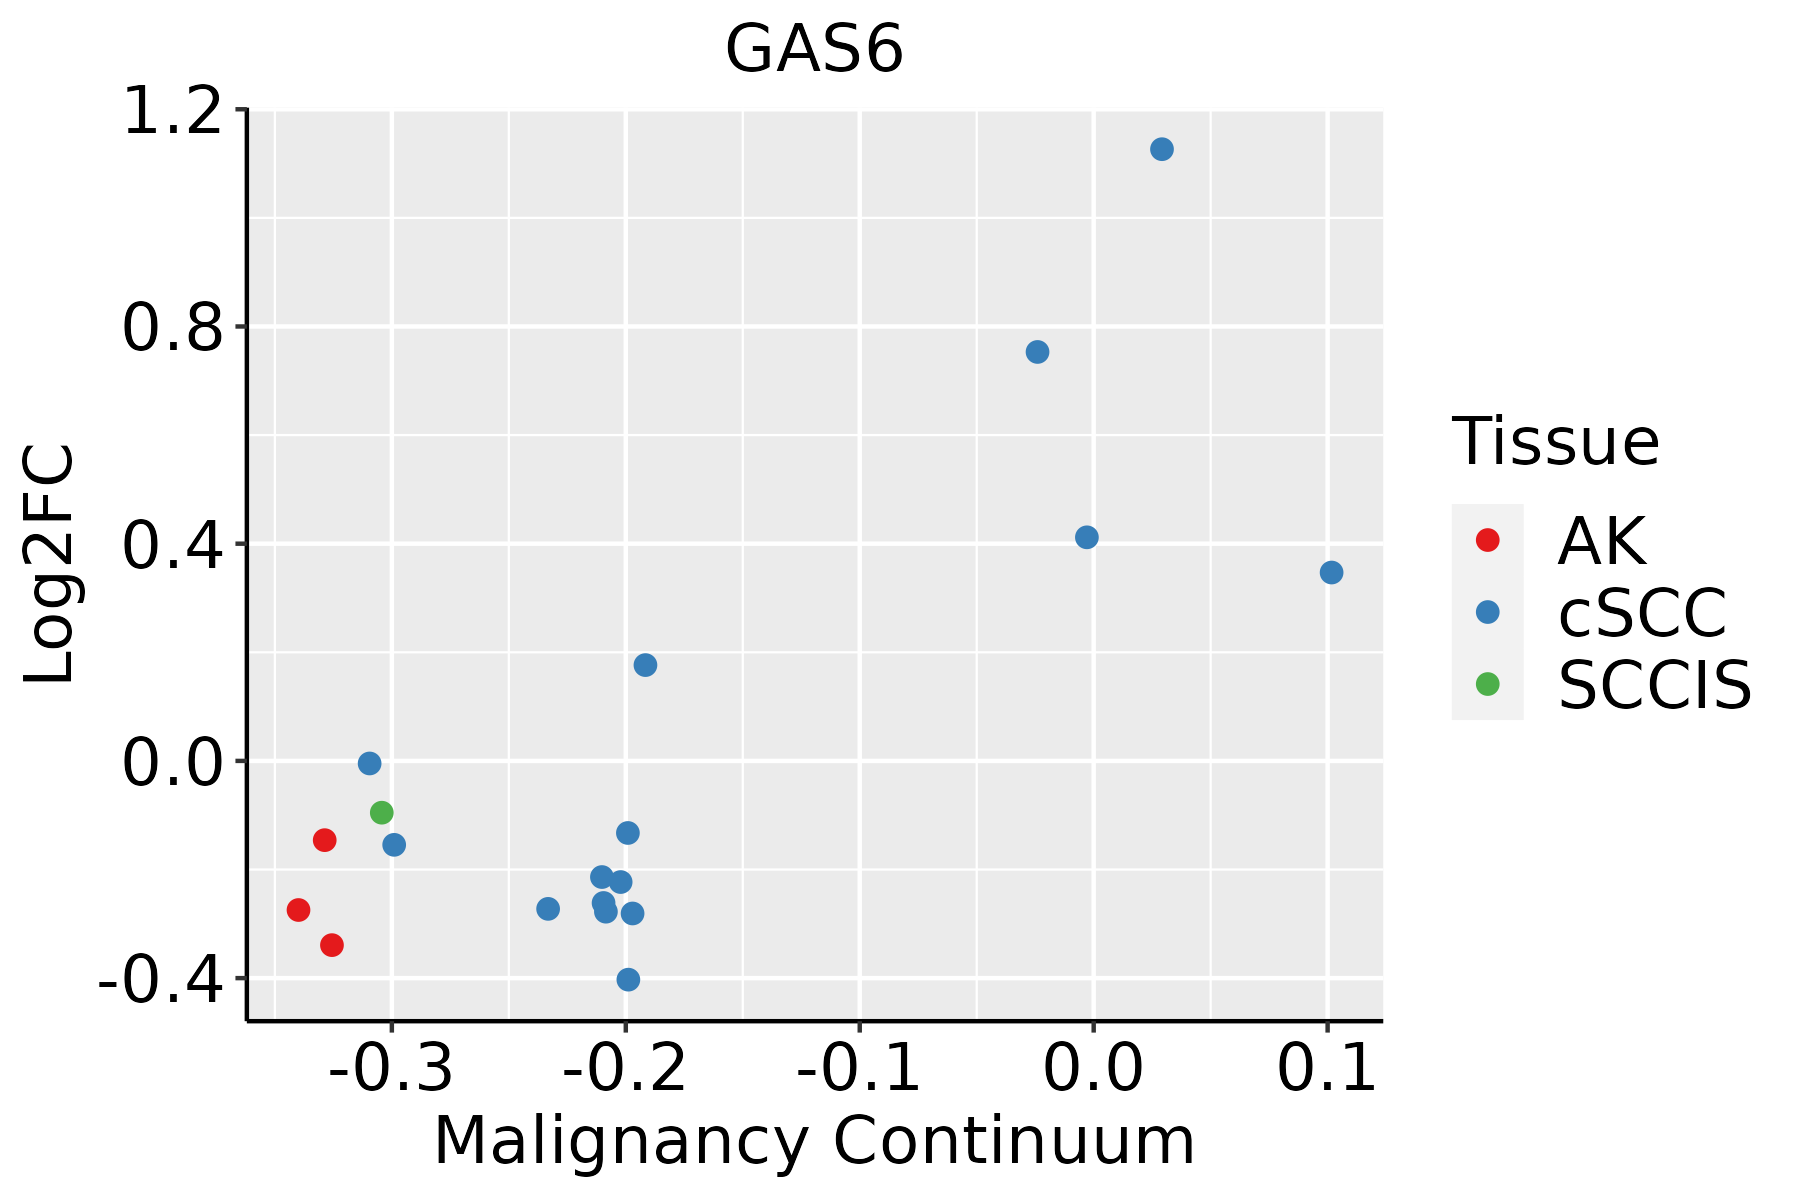 | AK: Actinic keratosis |
| cSCC: Cutaneous squamous cell carcinoma | ||
| SCCIS:squamous cell carcinoma in situ | ||
| Thyroid | 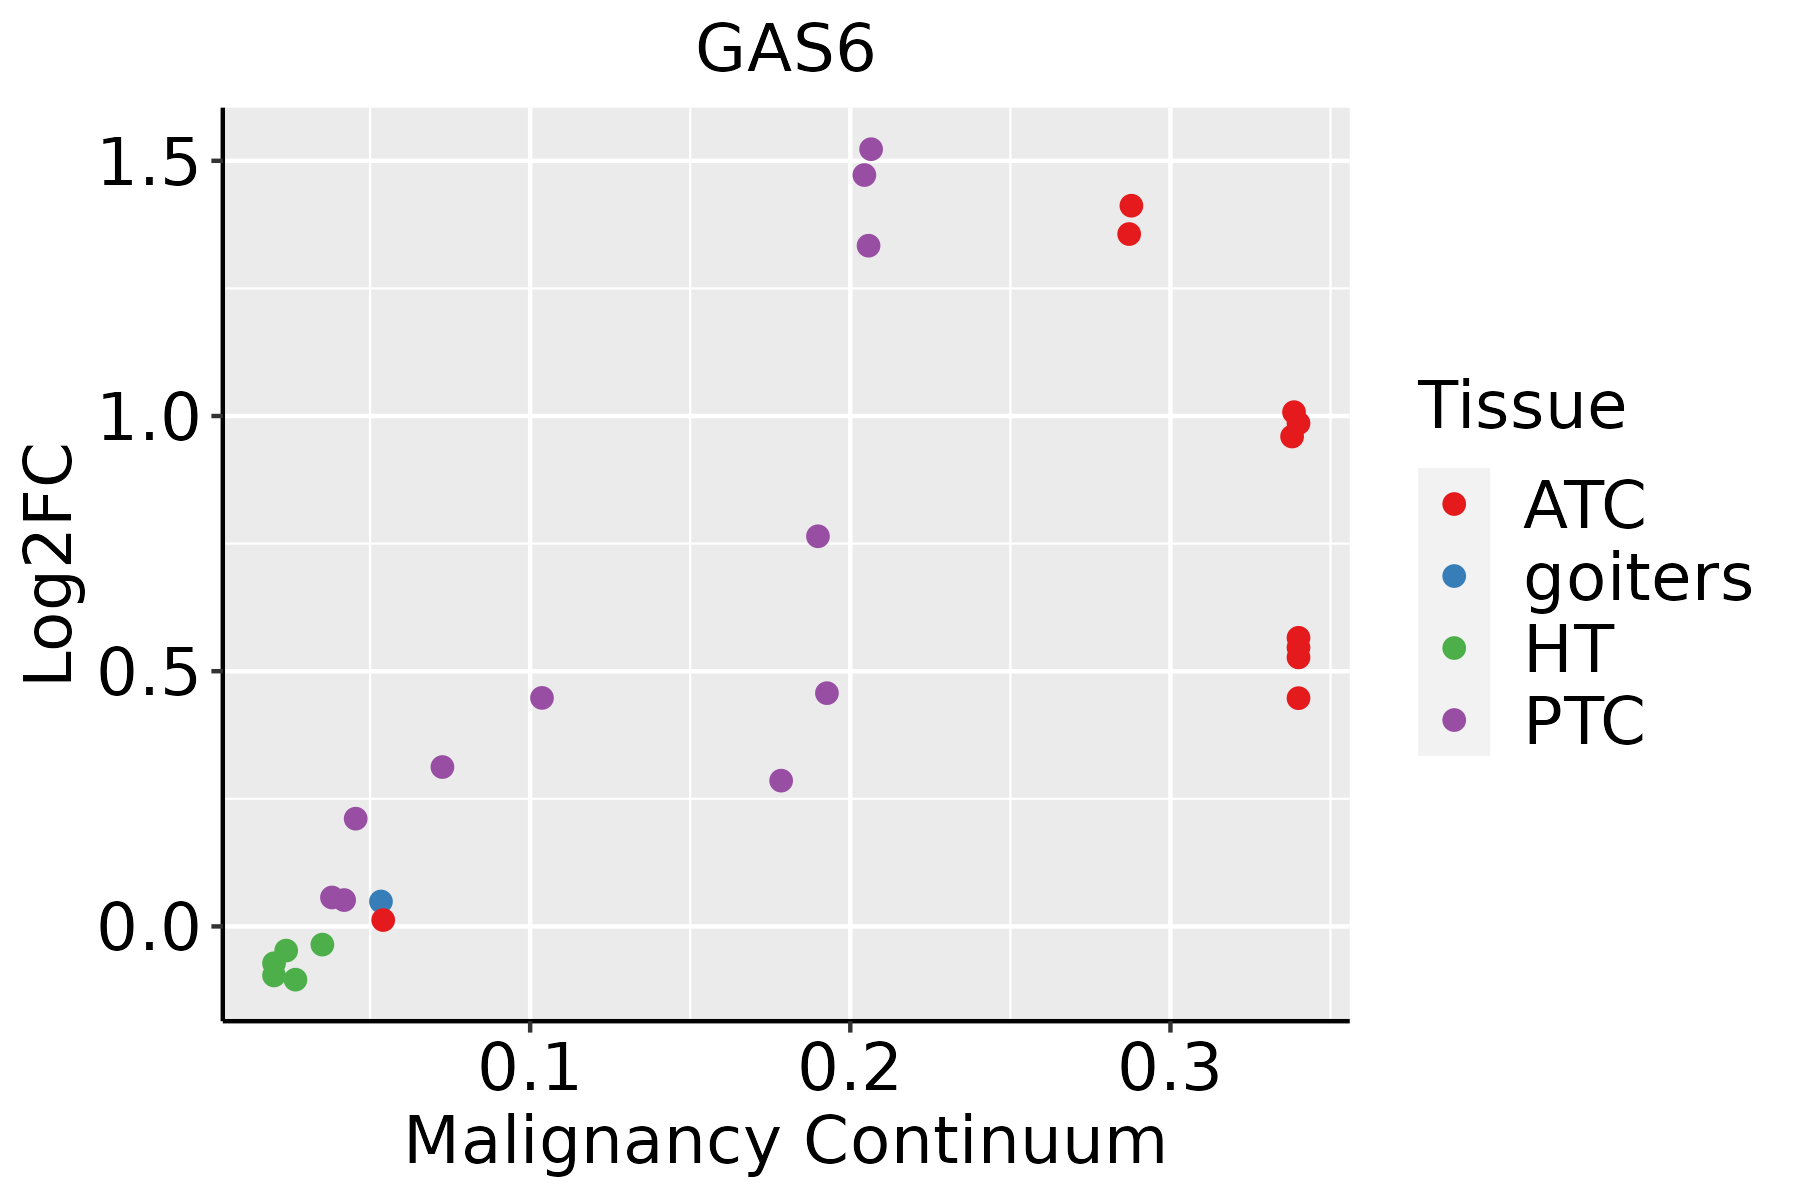 | ATC: Anaplastic thyroid cancer |
| HT: Hashimoto's thyroiditis | ||
| PTC: Papillary thyroid cancer |
| ∗log2FC in expression of this searched gene in stem-like cells from each diseased tissue sample relative to stem-like cells in normal samples in each tissue plotted against the malignancy continuum. Samples are colored based on if they are from different disease stage. |
Top |
Malignant transformation related pathway analysis |
| Find out the enriched GO biological processes and KEGG pathways involved in transition from healthy to precancer to cancer |
| Tissue | Disease Stage | Enriched GO biological Processes |
| Colorectum | AD |  |
| Colorectum | SER |  |
| Colorectum | MSS |  |
| Colorectum | MSI-H |  |
| Colorectum | FAP |  |
| ∗Top 15 enriched GO BP terms are showed in the bar plot of each disease state in each tissue. Each row represents a significant GO biological process which is colored according to the -log10(p.adjust). |
| Page: 1 2 3 4 5 6 7 8 9 |
| GO ID | Tissue | Disease Stage | Description | Gene Ratio | Bg Ratio | pvalue | p.adjust | Count |
| GO:001603216 | Endometrium | AEH | viral process | 110/2100 | 415/18723 | 1.99e-18 | 1.09e-15 | 110 |
| GO:001905816 | Endometrium | AEH | viral life cycle | 86/2100 | 317/18723 | 2.53e-15 | 7.58e-13 | 86 |
| GO:00315899 | Endometrium | AEH | cell-substrate adhesion | 87/2100 | 363/18723 | 3.51e-12 | 5.70e-10 | 87 |
| GO:001907916 | Endometrium | AEH | viral genome replication | 43/2100 | 131/18723 | 3.22e-11 | 4.60e-09 | 43 |
| GO:004440316 | Endometrium | AEH | biological process involved in symbiotic interaction | 70/2100 | 290/18723 | 3.26e-10 | 3.55e-08 | 70 |
| GO:004206016 | Endometrium | AEH | wound healing | 91/2100 | 422/18723 | 4.85e-10 | 4.61e-08 | 91 |
| GO:190495115 | Endometrium | AEH | positive regulation of establishment of protein localization | 74/2100 | 319/18723 | 7.05e-10 | 6.51e-08 | 74 |
| GO:000974316 | Endometrium | AEH | response to carbohydrate | 62/2100 | 253/18723 | 1.76e-09 | 1.51e-07 | 62 |
| GO:003428416 | Endometrium | AEH | response to monosaccharide | 57/2100 | 225/18723 | 2.13e-09 | 1.77e-07 | 57 |
| GO:005170116 | Endometrium | AEH | biological process involved in interaction with host | 53/2100 | 203/18723 | 2.48e-09 | 1.93e-07 | 53 |
| GO:000974615 | Endometrium | AEH | response to hexose | 54/2100 | 219/18723 | 1.54e-08 | 9.72e-07 | 54 |
| GO:005212616 | Endometrium | AEH | movement in host environment | 46/2100 | 175/18723 | 2.20e-08 | 1.31e-06 | 46 |
| GO:000974910 | Endometrium | AEH | response to glucose | 52/2100 | 212/18723 | 3.40e-08 | 1.91e-06 | 52 |
| GO:007265914 | Endometrium | AEH | protein localization to plasma membrane | 63/2100 | 284/18723 | 7.58e-08 | 3.92e-06 | 63 |
| GO:005122215 | Endometrium | AEH | positive regulation of protein transport | 66/2100 | 303/18723 | 7.79e-08 | 3.99e-06 | 66 |
| GO:00016789 | Endometrium | AEH | cellular glucose homeostasis | 44/2100 | 172/18723 | 1.04e-07 | 5.07e-06 | 44 |
| GO:007132210 | Endometrium | AEH | cellular response to carbohydrate stimulus | 41/2100 | 163/18723 | 4.55e-07 | 1.87e-05 | 41 |
| GO:19907789 | Endometrium | AEH | protein localization to cell periphery | 68/2100 | 333/18723 | 6.38e-07 | 2.38e-05 | 68 |
| GO:004671816 | Endometrium | AEH | viral entry into host cell | 37/2100 | 144/18723 | 9.32e-07 | 3.24e-05 | 37 |
| GO:003315710 | Endometrium | AEH | regulation of intracellular protein transport | 51/2100 | 229/18723 | 1.13e-06 | 3.75e-05 | 51 |
| Page: 1 2 3 4 5 6 7 8 9 10 11 12 13 14 15 16 17 18 19 20 21 22 23 24 25 26 27 28 29 30 31 32 33 34 35 36 37 |
| Pathway ID | Tissue | Disease Stage | Description | Gene Ratio | Bg Ratio | pvalue | p.adjust | qvalue | Count |
| hsa0152110 | Esophagus | ESCC | EGFR tyrosine kinase inhibitor resistance | 55/4205 | 79/8465 | 2.44e-04 | 8.78e-04 | 4.50e-04 | 55 |
| hsa0152115 | Esophagus | ESCC | EGFR tyrosine kinase inhibitor resistance | 55/4205 | 79/8465 | 2.44e-04 | 8.78e-04 | 4.50e-04 | 55 |
| hsa015219 | Oral cavity | OSCC | EGFR tyrosine kinase inhibitor resistance | 54/3704 | 79/8465 | 8.11e-06 | 3.72e-05 | 1.89e-05 | 54 |
| hsa0152114 | Oral cavity | OSCC | EGFR tyrosine kinase inhibitor resistance | 54/3704 | 79/8465 | 8.11e-06 | 3.72e-05 | 1.89e-05 | 54 |
| Page: 1 |
Top |
Cell-cell communication analysis |
| Identification of potential cell-cell interactions between two cell types and their ligand-receptor pairs for different disease states |
| Ligand | Receptor | LRpair | Pathway | Tissue | Disease Stage |
| GAS6 | AXL | GAS6_AXL | GAS | Breast | ADJ |
| GAS6 | AXL | GAS6_AXL | GAS | Breast | DCIS |
| GAS6 | MERTK | GAS6_MERTK | GAS | Breast | DCIS |
| GAS6 | AXL | GAS6_AXL | GAS | Breast | Healthy |
| GAS6 | AXL | GAS6_AXL | GAS | Breast | IDC |
| GAS6 | AXL | GAS6_AXL | GAS | Breast | Precancer |
| GAS6 | AXL | GAS6_AXL | GAS | Cervix | ADJ |
| GAS6 | AXL | GAS6_AXL | GAS | Cervix | CC |
| GAS6 | MERTK | GAS6_MERTK | GAS | Cervix | CC |
| GAS6 | AXL | GAS6_AXL | GAS | Cervix | Healthy |
| GAS6 | AXL | GAS6_AXL | GAS | Cervix | Precancer |
| GAS6 | AXL | GAS6_AXL | GAS | CRC | AD |
| GAS6 | MERTK | GAS6_MERTK | GAS | CRC | AD |
| GAS6 | AXL | GAS6_AXL | GAS | CRC | ADJ |
| GAS6 | MERTK | GAS6_MERTK | GAS | CRC | ADJ |
| GAS6 | AXL | GAS6_AXL | GAS | CRC | CRC |
| GAS6 | MERTK | GAS6_MERTK | GAS | CRC | CRC |
| GAS6 | AXL | GAS6_AXL | GAS | CRC | MSI-H |
| GAS6 | MERTK | GAS6_MERTK | GAS | CRC | MSI-H |
| GAS6 | AXL | GAS6_AXL | GAS | CRC | MSS |
| Page: 1 2 3 4 |
Top |
Single-cell gene regulatory network inference analysis |
| Find out the significant the regulons (TFs) and the target genes of each regulon across cell types for different disease states |
| TF | Cell Type | Tissue | Disease Stage | Target Gene | RSS | Regulon Activity |
| ∗The dot plots of a searched regulon are shown for all cell subpopulations in each disease state of each tissue based on the regulon specific score inferred using pySCENIC and by calculating the average expression. |
| Page: 1 |
Top |
Somatic mutation of malignant transformation related genes |
| Annotation of somatic variants for genes involved in malignant transformation |
| Hugo Symbol | Variant Class | Variant Classification | dbSNP RS | HGVSc | HGVSp | HGVSp Short | SWISSPROT | BIOTYPE | SIFT | PolyPhen | Tumor Sample Barcode | Tissue | Histology | Sex | Age | Stage | Therapy Types | Drugs | Outcome |
| GAS6 | SNV | Missense_Mutation | c.870N>C | p.Lys290Asn | p.K290N | Q14393 | protein_coding | deleterious(0) | possibly_damaging(0.769) | TCGA-C8-A132-01 | Breast | breast invasive carcinoma | Female | <65 | I/II | Unknown | Unknown | SD | |
| GAS6 | SNV | Missense_Mutation | rs146140804 | c.1211N>T | p.Ala404Val | p.A404V | Q14393 | protein_coding | tolerated(0.99) | benign(0.277) | TCGA-E2-A1IH-01 | Breast | breast invasive carcinoma | Female | >=65 | I/II | Hormone Therapy | aromasin | SD |
| GAS6 | SNV | Missense_Mutation | rs748222907 | c.337N>A | p.Val113Met | p.V113M | Q14393 | protein_coding | deleterious(0) | possibly_damaging(0.905) | TCGA-GM-A4E0-01 | Breast | breast invasive carcinoma | Female | >=65 | III/IV | Chemotherapy | xeloda | CR |
| GAS6 | deletion | Frame_Shift_Del | c.449delG | p.Gly150AlafsTer49 | p.G150Afs*49 | Q14393 | protein_coding | TCGA-AN-A0AK-01 | Breast | breast invasive carcinoma | Female | >=65 | I/II | Unknown | Unknown | SD | |||
| GAS6 | insertion | Frame_Shift_Ins | rs773341392 | c.449_450insG | p.Arg151ProfsTer27 | p.R151Pfs*27 | Q14393 | protein_coding | TCGA-B6-A0RE-01 | Breast | breast invasive carcinoma | Female | <65 | I/II | Unknown | Unknown | SD | ||
| GAS6 | SNV | Missense_Mutation | novel | c.1921C>T | p.Arg641Cys | p.R641C | Q14393 | protein_coding | deleterious(0.01) | possibly_damaging(0.786) | TCGA-2W-A8YY-01 | Cervix | cervical & endocervical cancer | Female | <65 | I/II | Chemotherapy | cisplatin | CR |
| GAS6 | SNV | Missense_Mutation | novel | c.1297C>A | p.Leu433Ile | p.L433I | Q14393 | protein_coding | deleterious(0.03) | probably_damaging(0.998) | TCGA-2W-A8YY-01 | Cervix | cervical & endocervical cancer | Female | <65 | I/II | Chemotherapy | cisplatin | CR |
| GAS6 | SNV | Missense_Mutation | rs771931132 | c.1163C>T | p.Ala388Val | p.A388V | Q14393 | protein_coding | deleterious(0.01) | benign(0.045) | TCGA-2W-A8YY-01 | Cervix | cervical & endocervical cancer | Female | <65 | I/II | Chemotherapy | cisplatin | CR |
| GAS6 | SNV | Missense_Mutation | c.302N>G | p.Ser101Cys | p.S101C | Q14393 | protein_coding | deleterious(0.03) | possibly_damaging(0.642) | TCGA-C5-A1BQ-01 | Cervix | cervical & endocervical cancer | Female | >=65 | III/IV | Chemotherapy | cisplatin | CR | |
| GAS6 | SNV | Missense_Mutation | c.803T>A | p.Leu268His | p.L268H | Q14393 | protein_coding | tolerated(0.13) | probably_damaging(0.912) | TCGA-EA-A5O9-01 | Cervix | cervical & endocervical cancer | Female | <65 | I/II | Unknown | Unknown | SD |
| Page: 1 2 3 4 5 6 7 |
Top |
Related drugs of malignant transformation related genes |
| Identification of chemicals and drugs interact with genes involved in malignant transfromation |
| (DGIdb 4.0) |
| Entrez ID | Symbol | Category | Interaction Types | Drug Claim Name | Drug Name | PMIDs |
| 2621 | GAS6 | DRUG RESISTANCE, DRUGGABLE GENOME, KINASE | WARFARIN | WARFARIN | 16014032 | |
| 2621 | GAS6 | DRUG RESISTANCE, DRUGGABLE GENOME, KINASE | DOCETAXEL | DOCETAXEL | 27153245 |
| Page: 1 |

Copyright 2023-Present -The University of Texas Health Science Center at Houston |