Schematic overview of the cellular and molecular mechanisms involved in the cancer progression, including the proposed cellular and molecular mechanisms in cancer cells trajectory. AT1: alveolar type 1 cells; AT2: alveolar type 2 cells; AAH: atypical adenomatous hyperplasia; AIS: adenocarcinoma in situ; MIA: minimally invasive adenocarcinoma; IA: invasive adenocarcinoma; EMT: epithelial-mesenchymal transition

Home

Download

Statistics

Help

Contact

Center for Computational Systems Medicine
leaf

Gene summary

leaf

Malignant transformation analysis

leaf

Malignant transformation related pathway analysis

leaf

Cell-cell communication analysis

leaf

Single-cell gene regulatory network inference analysis

leaf

Somatic mutation of malignant transformation related genes

leaf

Related drugs of malignant transformation related genes

Gene: GAS2L1

Gene summary for GAS2L1

check button Gene summary.

Gene informationSpeciesHuman
Gene symbol

GAS2L1

Gene ID

10634

Gene namegrowth arrest specific 2 like 1
Gene AliasGAR22
Cytomap22q12.2
Gene Typeprotein-coding
GO ID

GO:0000226

UniProtAcc

Q99501


Top

Malignant transformation analysis

check button Identification of the aberrant gene expression in precancerous and cancerous lesions by comparing the gene expression of stem-like cells in diseased tissues with normal stem cells
check button Malignant transformation involving gene list.
Entrez IDSymbolReplicatesSpeciesOrganTissueAdj P-valueLog2FCMalignancy
10634GAS2L1P1T-EHumanEsophagusESCC2.74e-105.01e-010.0875
10634GAS2L1P2T-EHumanEsophagusESCC2.08e-121.05e-010.1177
10634GAS2L1P4T-EHumanEsophagusESCC1.17e-144.25e-010.1323
10634GAS2L1P5T-EHumanEsophagusESCC1.07e-141.51e-010.1327
10634GAS2L1P8T-EHumanEsophagusESCC3.15e-081.31e-010.0889
10634GAS2L1P9T-EHumanEsophagusESCC8.90e-154.17e-010.1131
10634GAS2L1P10T-EHumanEsophagusESCC2.32e-212.70e-010.116
10634GAS2L1P11T-EHumanEsophagusESCC5.92e-114.01e-010.1426
10634GAS2L1P12T-EHumanEsophagusESCC1.36e-213.23e-010.1122
10634GAS2L1P15T-EHumanEsophagusESCC7.72e-224.55e-010.1149
10634GAS2L1P16T-EHumanEsophagusESCC1.23e-111.35e-010.1153
10634GAS2L1P17T-EHumanEsophagusESCC9.37e-063.33e-010.1278
10634GAS2L1P19T-EHumanEsophagusESCC6.35e-096.81e-010.1662
10634GAS2L1P20T-EHumanEsophagusESCC3.67e-143.72e-010.1124
10634GAS2L1P21T-EHumanEsophagusESCC1.38e-346.55e-010.1617
10634GAS2L1P22T-EHumanEsophagusESCC5.79e-243.74e-010.1236
10634GAS2L1P23T-EHumanEsophagusESCC3.29e-265.15e-010.108
10634GAS2L1P24T-EHumanEsophagusESCC5.40e-173.63e-010.1287
10634GAS2L1P26T-EHumanEsophagusESCC1.66e-304.35e-010.1276
10634GAS2L1P27T-EHumanEsophagusESCC3.08e-243.37e-010.1055
Page: 1 2 3 4 5 

check button Transcriptomic changes along malignancy continuum.
TissueExpression DynamicsAbbreviation
EsophagusThe image shows the transcriptomic changes along malignancy continuum.log2FC in expression of this searched gene in stem-like cells from each diseased tissue sample relative to stem-like cells in normal samples in each tissue plotted against the malignancy continuum. Samples are colored based on if they are from different disease stage.ESCC: Esophageal squamous cell carcinoma
HGIN: High-grade intraepithelial neoplasias
LGIN: Low-grade intraepithelial neoplasias
Oral CavityThe image shows the transcriptomic changes along malignancy continuum.log2FC in expression of this searched gene in stem-like cells from each diseased tissue sample relative to stem-like cells in normal samples in each tissue plotted against the malignancy continuum. Samples are colored based on if they are from different disease stage.
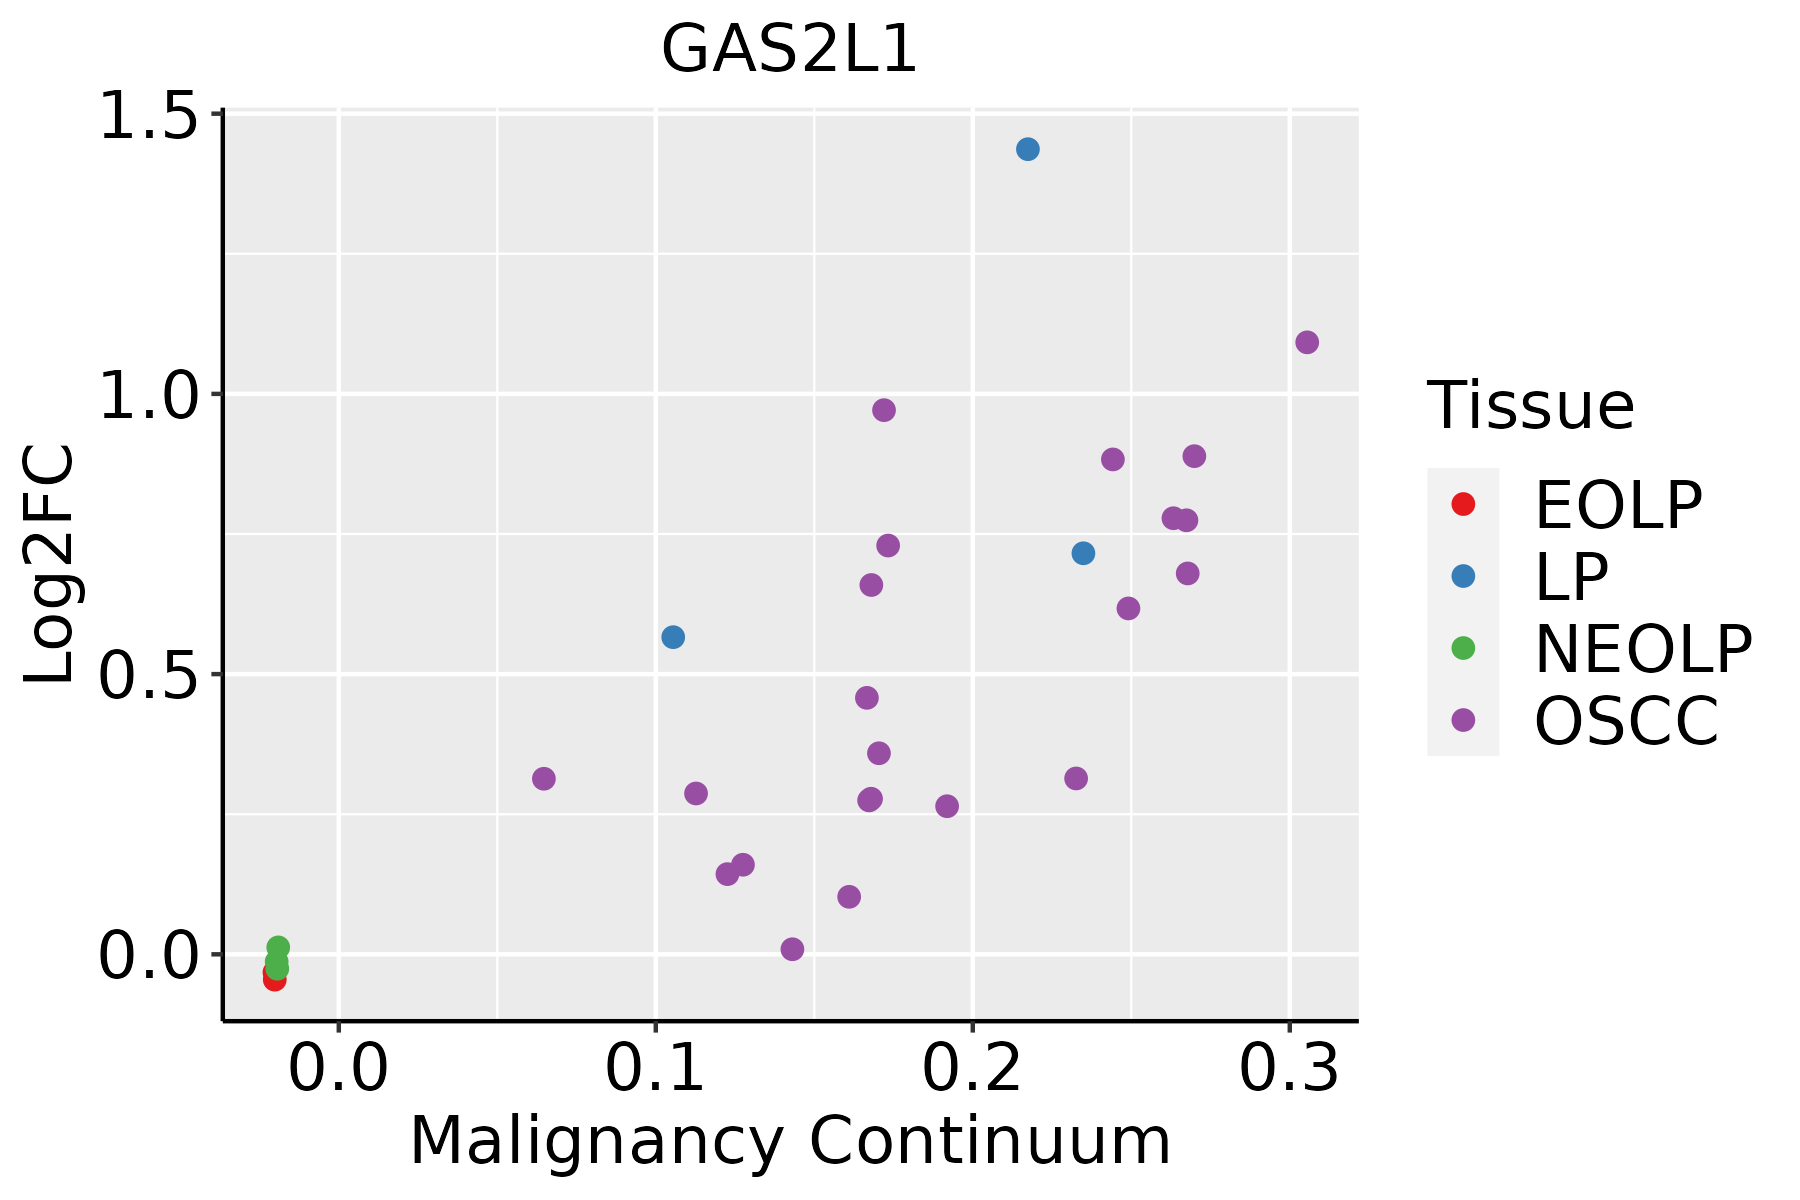
EOLP: Erosive Oral lichen planus
LP: leukoplakia
NEOLP: Non-erosive oral lichen planus
OSCC: Oral squamous cell carcinoma
SkinThe image shows the transcriptomic changes along malignancy continuum.log2FC in expression of this searched gene in stem-like cells from each diseased tissue sample relative to stem-like cells in normal samples in each tissue plotted against the malignancy continuum. Samples are colored based on if they are from different disease stage.
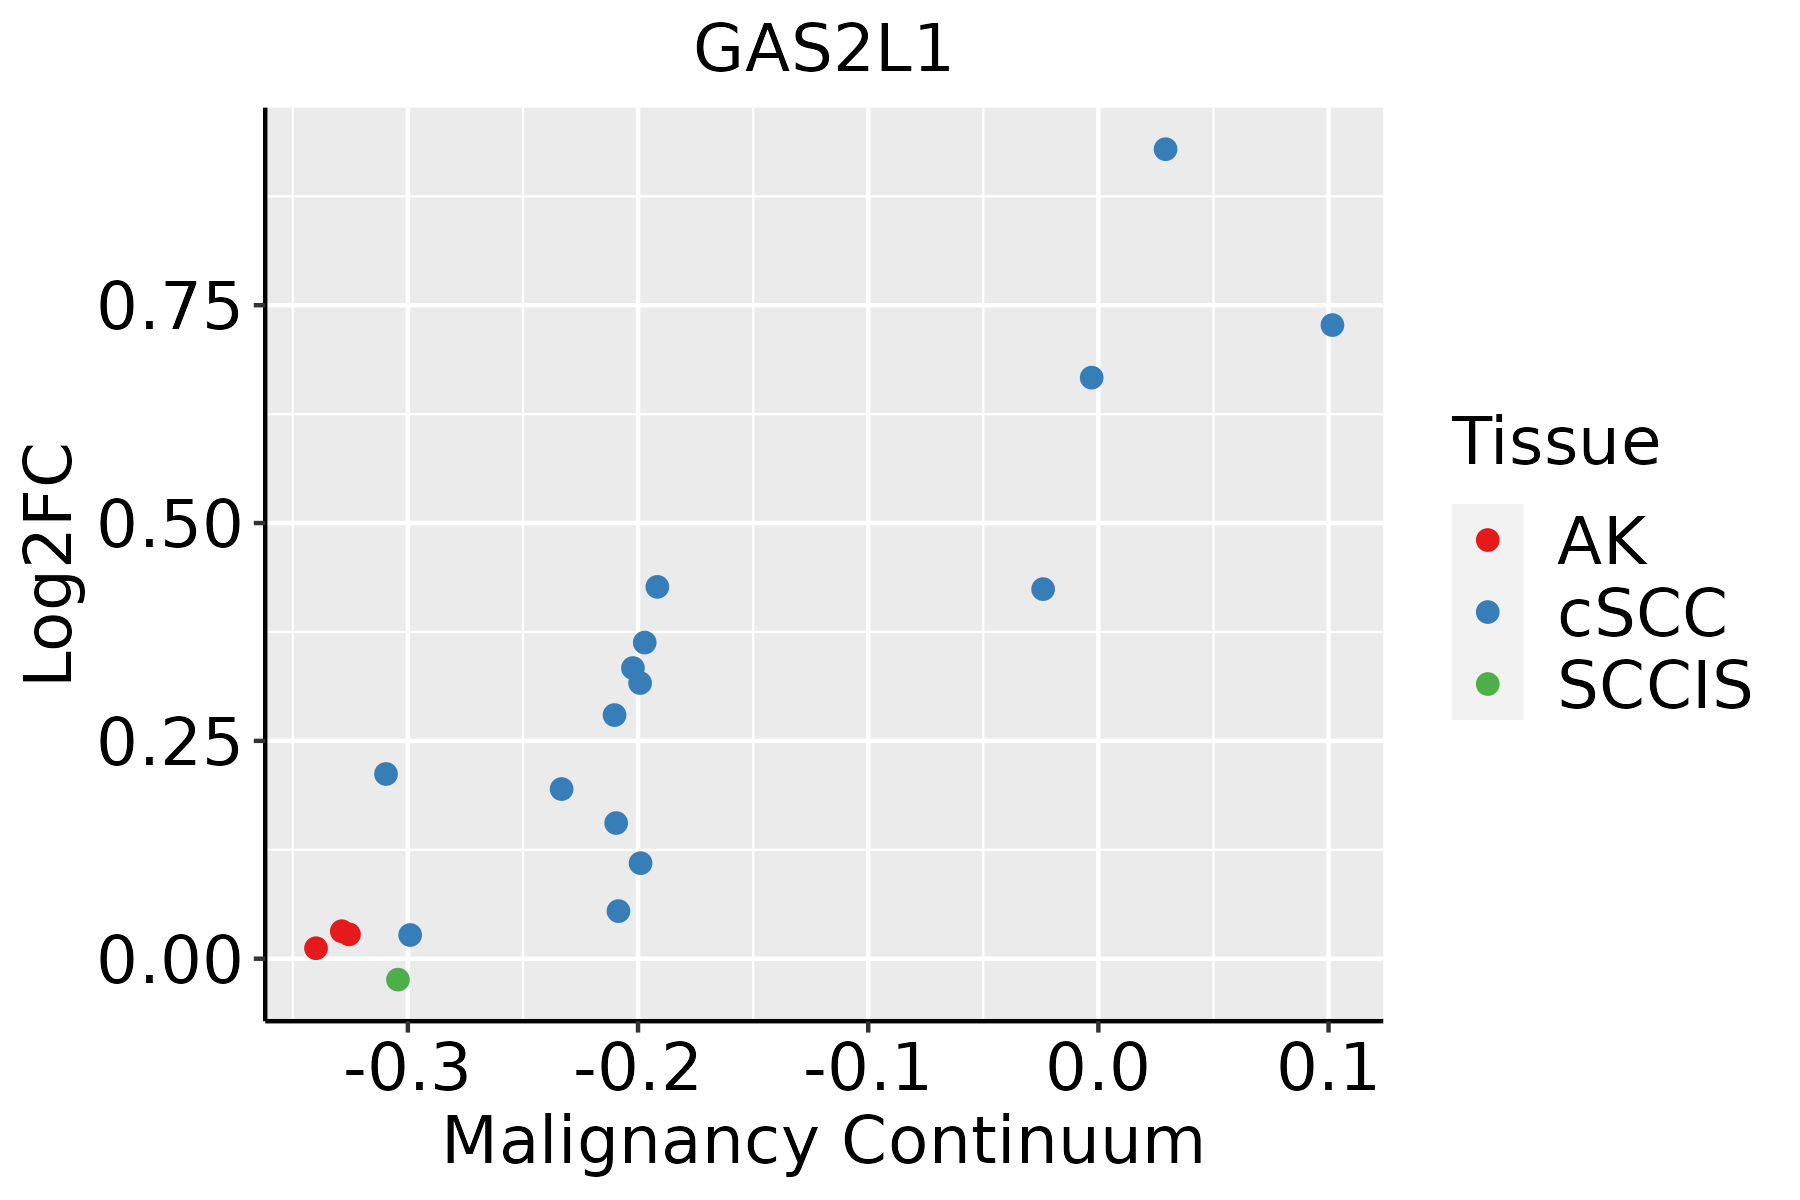
AK: Actinic keratosis
cSCC: Cutaneous squamous cell carcinoma
SCCIS:squamous cell carcinoma in situ
ThyroidThe image shows the transcriptomic changes along malignancy continuum.log2FC in expression of this searched gene in stem-like cells from each diseased tissue sample relative to stem-like cells in normal samples in each tissue plotted against the malignancy continuum. Samples are colored based on if they are from different disease stage.ATC: Anaplastic thyroid cancer
HT: Hashimoto's thyroiditis
PTC: Papillary thyroid cancer
∗log2FC in expression of this searched gene in stem-like cells from each diseased tissue sample relative to stem-like cells in normal samples in each tissue plotted against the malignancy continuum. Samples are colored based on if they are from different disease stage.

Top

Malignant transformation related pathway analysis

check buttonFind out the enriched GO biological processes and KEGG pathways involved in transition from healthy to precancer to cancer
check button Figure of enriched GO biological processes.
TissueDisease StageEnriched GO biological Processes
ColorectumADGO analysis - Figure of enriched GO biological processes: Top 15 enriched GO BP terms are showed in the bar plot of each disease state in each tissue. Each row represents a significant GO biological process which is colored according to the -log10(p.adjust).
ColorectumSERGO analysis - Figure of enriched GO biological processes: Top 15 enriched GO BP terms are showed in the bar plot of each disease state in each tissue. Each row represents a significant GO biological process which is colored according to the -log10(p.adjust).
ColorectumMSSGO analysis - Figure of enriched GO biological processes: Top 15 enriched GO BP terms are showed in the bar plot of each disease state in each tissue. Each row represents a significant GO biological process which is colored according to the -log10(p.adjust).
ColorectumMSI-HGO analysis - Figure of enriched GO biological processes: Top 15 enriched GO BP terms are showed in the bar plot of each disease state in each tissue. Each row represents a significant GO biological process which is colored according to the -log10(p.adjust).
ColorectumFAPGO analysis - Figure of enriched GO biological processes: Top 15 enriched GO BP terms are showed in the bar plot of each disease state in each tissue. Each row represents a significant GO biological process which is colored according to the -log10(p.adjust).
∗Top 15 enriched GO BP terms are showed in the bar plot of each disease state in each tissue. Each row represents a significant GO biological process which is colored according to the -log10(p.adjust).
Page: 1 2 3 4 5 6 7 8 9 

check button Enriched GO biological processes.
GO IDTissueDisease StageDescriptionGene RatioBg Ratiopvaluep.adjustCount
GO:0071496111EsophagusESCCcellular response to external stimulus215/8552320/187234.29e-152.43e-13215
GO:0031668111EsophagusESCCcellular response to extracellular stimulus168/8552246/187234.93e-132.23e-11168
GO:0031669110EsophagusESCCcellular response to nutrient levels148/8552215/187234.58e-121.76e-10148
GO:0031667111EsophagusESCCresponse to nutrient levels289/8552474/187239.25e-123.47e-10289
GO:0009267110EsophagusESCCcellular response to starvation110/8552156/187232.63e-107.37e-09110
GO:004259419EsophagusESCCresponse to starvation133/8552197/187234.31e-101.14e-08133
GO:000701527EsophagusESCCactin filament organization259/8552442/187232.37e-084.50e-07259
GO:00705078EsophagusESCCregulation of microtubule cytoskeleton organization99/8552148/187231.43e-072.29e-0699
GO:00726985EsophagusESCCprotein localization to microtubule cytoskeleton43/855254/187233.28e-074.61e-0643
GO:00443804EsophagusESCCprotein localization to cytoskeleton45/855258/187236.89e-078.99e-0645
GO:00311094EsophagusESCCmicrotubule polymerization or depolymerization77/8552122/187237.60e-055.68e-0477
GO:00311104EsophagusESCCregulation of microtubule polymerization or depolymerization57/855288/187232.32e-041.44e-0357
GO:00328864EsophagusESCCregulation of microtubule-based process134/8552240/187239.44e-044.80e-03134
GO:0035372EsophagusESCCprotein localization to microtubule15/855218/187231.20e-035.88e-0315
GO:007149620Oral cavityOSCCcellular response to external stimulus186/7305320/187232.56e-121.05e-10186
GO:003166819Oral cavityOSCCcellular response to extracellular stimulus141/7305246/187233.99e-098.95e-08141
GO:003166720Oral cavityOSCCresponse to nutrient levels245/7305474/187231.02e-082.10e-07245
GO:000701520Oral cavityOSCCactin filament organization230/7305442/187231.37e-082.77e-07230
GO:003166918Oral cavityOSCCcellular response to nutrient levels121/7305215/187231.96e-073.17e-06121
GO:004259416Oral cavityOSCCresponse to starvation111/7305197/187235.68e-078.19e-06111
Page: 1 2 3 4 

check button Enriched KEGG pathways.
Pathway IDTissueDisease StageDescriptionGene RatioBg Ratiopvaluep.adjustqvalueCount
Page: 1 

Top

Cell-cell communication analysis

check buttonIdentification of potential cell-cell interactions between two cell types and their ligand-receptor pairs for different disease states
LigandReceptorLRpairPathwayTissueDisease Stage
Page: 1 

Top

Single-cell gene regulatory network inference analysis

check buttonFind out the significant the regulons (TFs) and the target genes of each regulon across cell types for different disease states
TFCell TypeTissueDisease StageTarget GeneRSSRegulon Activity
∗The dot plots of a searched regulon are shown for all cell subpopulations in each disease state of each tissue based on the regulon specific score inferred using pySCENIC and by calculating the average expression.
Page: 1 

Top

Somatic mutation of malignant transformation related genes

check buttonAnnotation of somatic variants for genes involved in malignant transformation
Hugo SymbolVariant ClassVariant ClassificationdbSNP RSHGVScHGVSpHGVSp ShortSWISSPROTBIOTYPESIFTPolyPhenTumor Sample BarcodeTissueHistologySexAgeStageTherapy TypesDrugsOutcome
GAS2L1SNVMissense_Mutationrs772163549c.322N>Ap.Gly108Serp.G108Sprotein_codingtolerated(0.4)benign(0.258)TCGA-5T-A9QA-01Breastbreast invasive carcinomaFemale<65I/IIChemotherapytaxolSD
GAS2L1SNVMissense_Mutationrs746848845c.221N>Ap.Arg74Hisp.R74Hprotein_codingtolerated(0.21)benign(0.369)TCGA-EW-A3U0-01Breastbreast invasive carcinomaFemale<65III/IVChemotherapycisplatinCR
GAS2L1SNVMissense_Mutationnovelc.935N>Gp.Glu312Glyp.E312Gprotein_codingtolerated(0.08)possibly_damaging(0.715)TCGA-XX-A899-01Breastbreast invasive carcinomaFemale<65III/IVChemotherapycytoxanCR
GAS2L1insertionFrame_Shift_Insnovelc.707_708insCCCACCTGCTTATTTCCp.Val237ProfsTer19p.V237Pfs*19protein_codingTCGA-A8-A09C-01Breastbreast invasive carcinomaFemale>=65I/IIUnknownUnknownSD
GAS2L1deletionFrame_Shift_Delnovelc.678delCp.Met227Terp.M227*protein_codingTCGA-D8-A27V-01Breastbreast invasive carcinomaFemale<65I/IIHormone TherapytamoxiphenSD
GAS2L1deletionFrame_Shift_Delnovelc.878delCp.Pro293HisfsTer28p.P293Hfs*28protein_codingTCGA-EW-A2FV-01Breastbreast invasive carcinomaFemale<65III/IVChemotherapydocetaxelSD
GAS2L1SNVMissense_Mutationnovelc.1964N>Ap.Arg655Hisp.R655Hprotein_codingdeleterious_low_confidence(0)possibly_damaging(0.683)TCGA-2W-A8YY-01Cervixcervical & endocervical cancerFemale<65I/IIChemotherapycisplatinCR
GAS2L1SNVMissense_Mutationrs376278123c.1451N>Ap.Arg484Glnp.R484Qprotein_codingtolerated(0.25)benign(0)TCGA-5M-AAT6-01Colorectumcolon adenocarcinomaFemale<65III/IVUnknownUnknownPD
GAS2L1SNVMissense_Mutationnovelc.697G>Tp.Gly233Trpp.G233Wprotein_codingdeleterious(0)probably_damaging(1)TCGA-A6-6653-01Colorectumcolon adenocarcinomaMale>=65I/IIUnknownUnknownSD
GAS2L1SNVMissense_Mutationc.164N>Ap.Gly55Glup.G55Eprotein_codingtolerated(0.29)possibly_damaging(0.841)TCGA-AA-3492-01Colorectumcolon adenocarcinomaFemale>=65I/IIUnknownUnknownSD
Page: 1 2 3 4 5 6 7 

Top

Related drugs of malignant transformation related genes

check buttonIdentification of chemicals and drugs interact with genes involved in malignant transfromation
(DGIdb 4.0)
Entrez IDSymbolCategoryInteraction TypesDrug Claim NameDrug NamePMIDs
Page: 1