
|
|||||
|
 | |
| |
| |
| |
| |
| |
|
Gene: GARS |
Gene summary for GARS |
| Gene information | Species | Human | Gene symbol | GARS | Gene ID | 2618 |
| Gene name | phosphoribosylglycinamide formyltransferase, phosphoribosylglycinamide synthetase, phosphoribosylaminoimidazole synthetase | |
| Gene Alias | AIRS | |
| Cytomap | 21q22.11 | |
| Gene Type | protein-coding | GO ID | GO:0003360 | UniProtAcc | P22102 |
Top |
Malignant transformation analysis |
| Identification of the aberrant gene expression in precancerous and cancerous lesions by comparing the gene expression of stem-like cells in diseased tissues with normal stem cells |
| Entrez ID | Symbol | Replicates | Species | Organ | Tissue | Adj P-value | Log2FC | Malignancy |
| 2618 | GARS | CCI_1 | Human | Cervix | CC | 3.77e-04 | 2.28e-01 | 0.528 |
| 2618 | GARS | CCI_2 | Human | Cervix | CC | 3.08e-11 | 4.53e-01 | 0.5249 |
| 2618 | GARS | CCI_3 | Human | Cervix | CC | 2.36e-07 | 2.60e-01 | 0.516 |
| 2618 | GARS | Tumor | Human | Cervix | CC | 1.21e-28 | 4.70e-01 | 0.1241 |
| 2618 | GARS | sample3 | Human | Cervix | CC | 7.46e-51 | 6.26e-01 | 0.1387 |
| 2618 | GARS | H2 | Human | Cervix | HSIL_HPV | 8.11e-04 | 1.42e-01 | 0.0632 |
| 2618 | GARS | T3 | Human | Cervix | CC | 2.87e-52 | 6.40e-01 | 0.1389 |
| 2618 | GARS | LZE2T | Human | Esophagus | ESCC | 2.55e-03 | 6.64e-01 | 0.082 |
| 2618 | GARS | LZE4T | Human | Esophagus | ESCC | 1.68e-27 | 7.46e-01 | 0.0811 |
| 2618 | GARS | LZE5T | Human | Esophagus | ESCC | 1.06e-03 | 6.83e-01 | 0.0514 |
| 2618 | GARS | LZE7T | Human | Esophagus | ESCC | 2.26e-15 | 8.36e-01 | 0.0667 |
| 2618 | GARS | LZE8T | Human | Esophagus | ESCC | 6.27e-06 | 2.52e-01 | 0.067 |
| 2618 | GARS | LZE20T | Human | Esophagus | ESCC | 1.12e-05 | 3.02e-01 | 0.0662 |
| 2618 | GARS | LZE22T | Human | Esophagus | ESCC | 4.09e-04 | 6.04e-01 | 0.068 |
| 2618 | GARS | LZE24T | Human | Esophagus | ESCC | 1.58e-23 | 6.97e-01 | 0.0596 |
| 2618 | GARS | LZE21T | Human | Esophagus | ESCC | 7.42e-05 | 4.86e-01 | 0.0655 |
| 2618 | GARS | LZE6T | Human | Esophagus | ESCC | 1.83e-07 | 3.50e-01 | 0.0845 |
| 2618 | GARS | P1T-E | Human | Esophagus | ESCC | 3.61e-06 | 6.97e-01 | 0.0875 |
| 2618 | GARS | P2T-E | Human | Esophagus | ESCC | 8.41e-46 | 9.02e-01 | 0.1177 |
| 2618 | GARS | P4T-E | Human | Esophagus | ESCC | 3.81e-52 | 1.14e+00 | 0.1323 |
| Page: 1 2 3 4 5 6 7 |
| Tissue | Expression Dynamics | Abbreviation |
| Cervix | 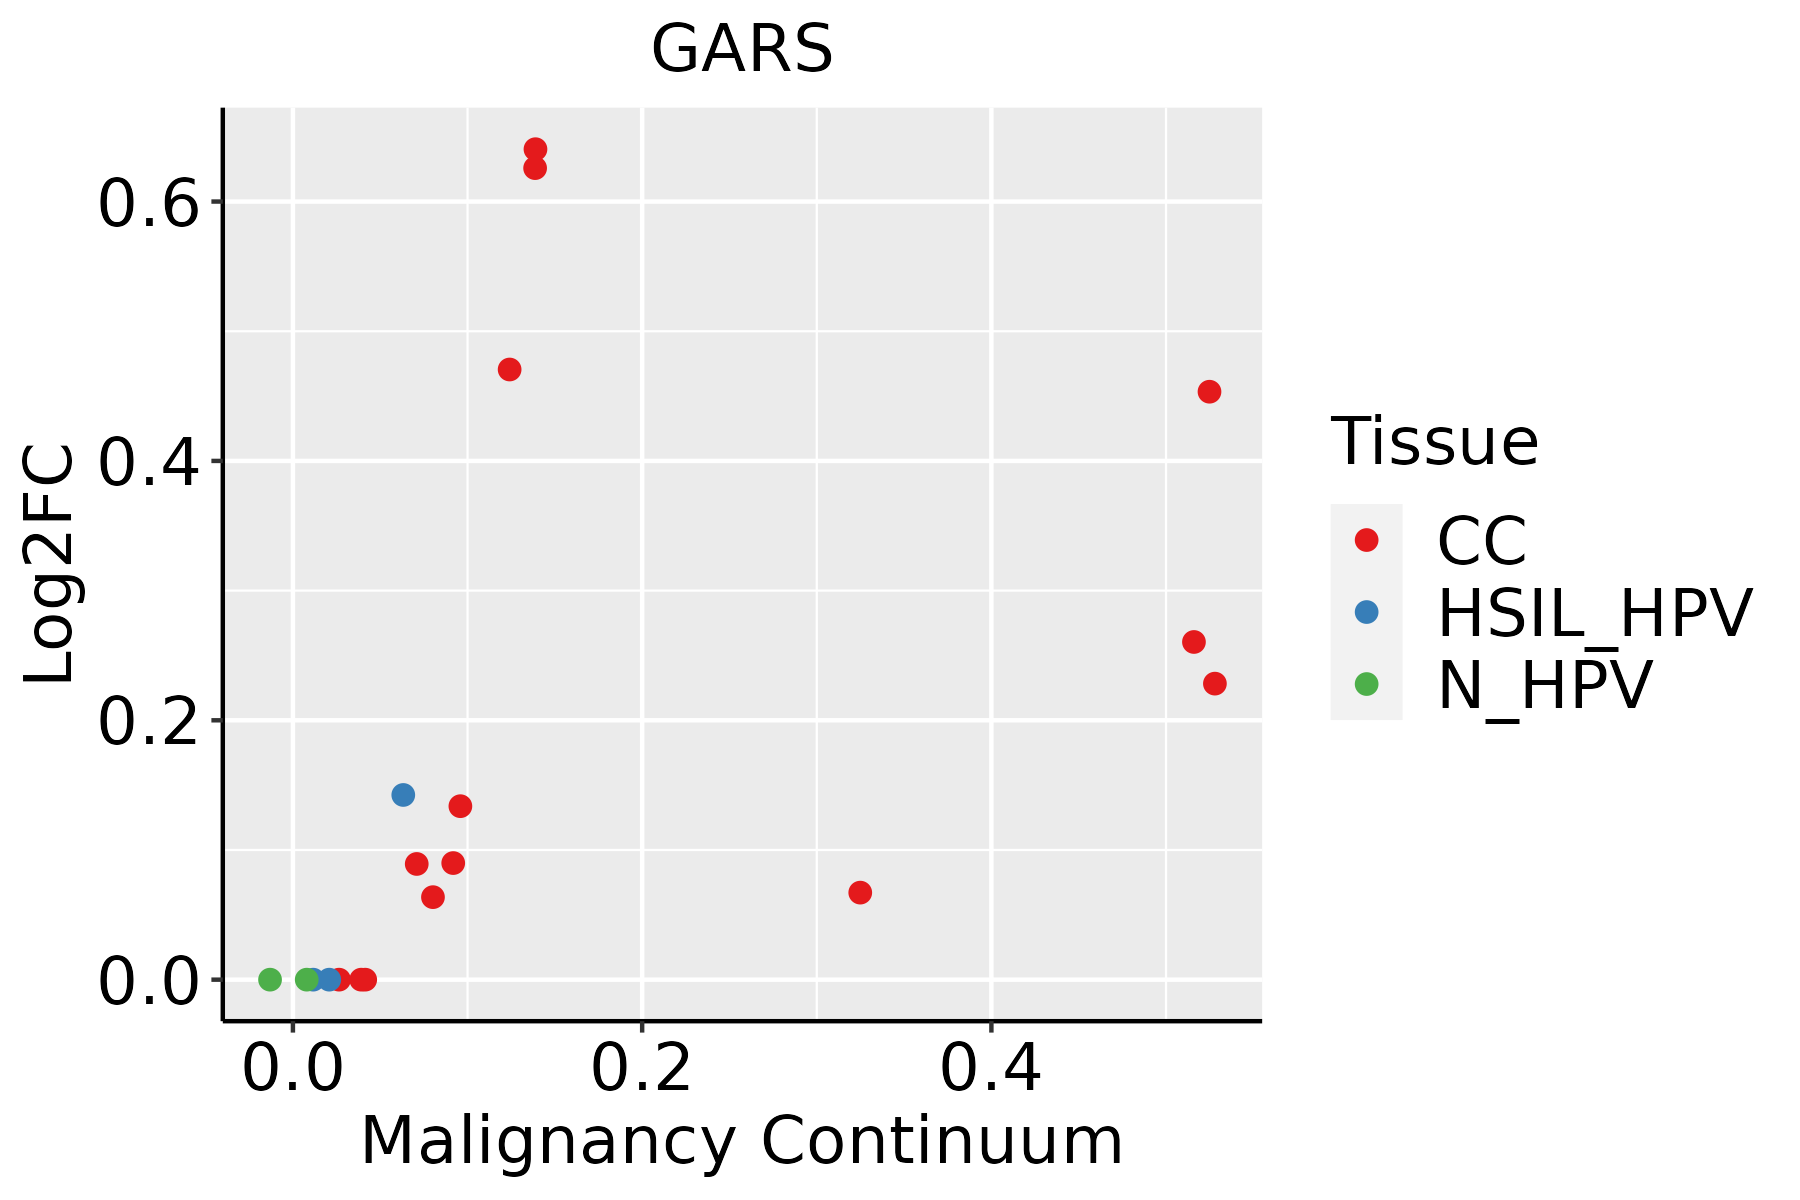 | CC: Cervix cancer |
| HSIL_HPV: HPV-infected high-grade squamous intraepithelial lesions | ||
| N_HPV: HPV-infected normal cervix | ||
| Esophagus |  | ESCC: Esophageal squamous cell carcinoma |
| HGIN: High-grade intraepithelial neoplasias | ||
| LGIN: Low-grade intraepithelial neoplasias | ||
| Liver | 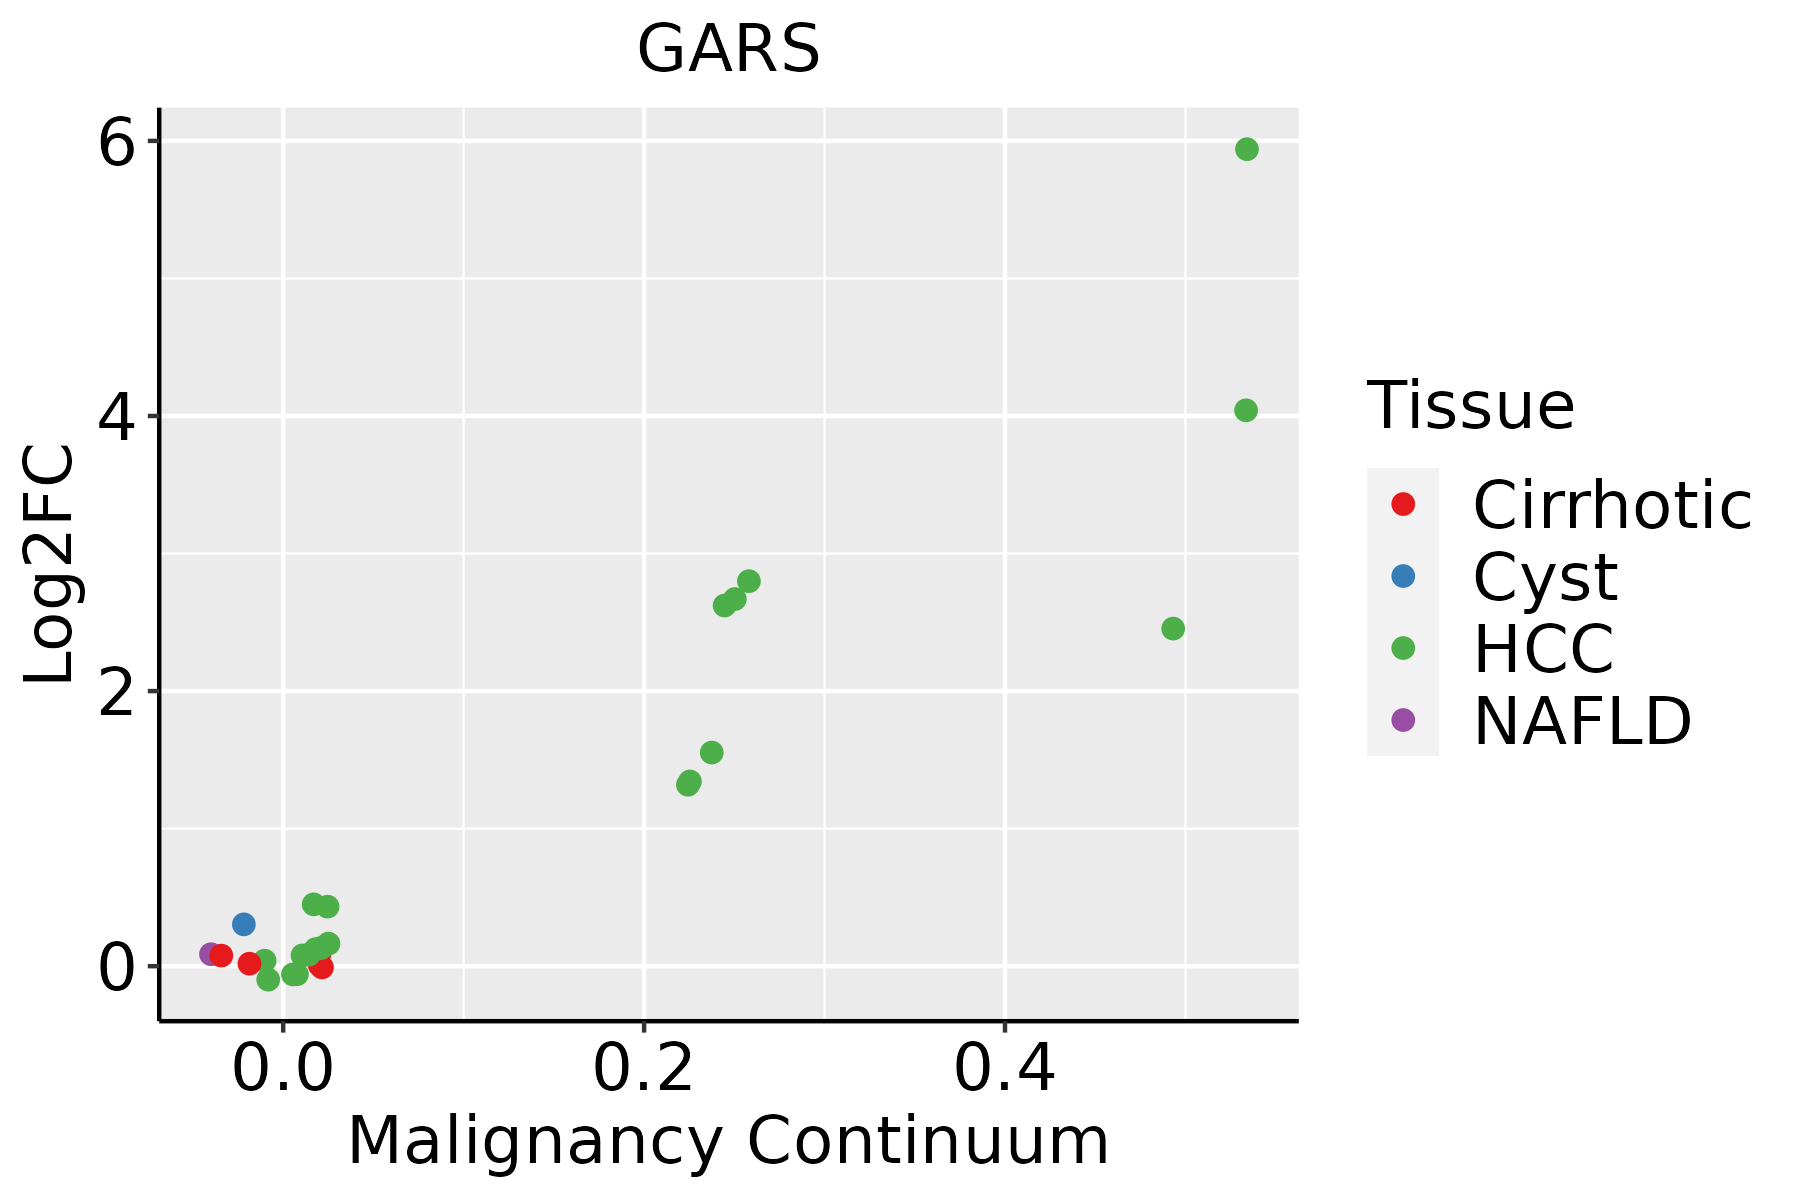 | HCC: Hepatocellular carcinoma |
| NAFLD: Non-alcoholic fatty liver disease | ||
| Oral Cavity | 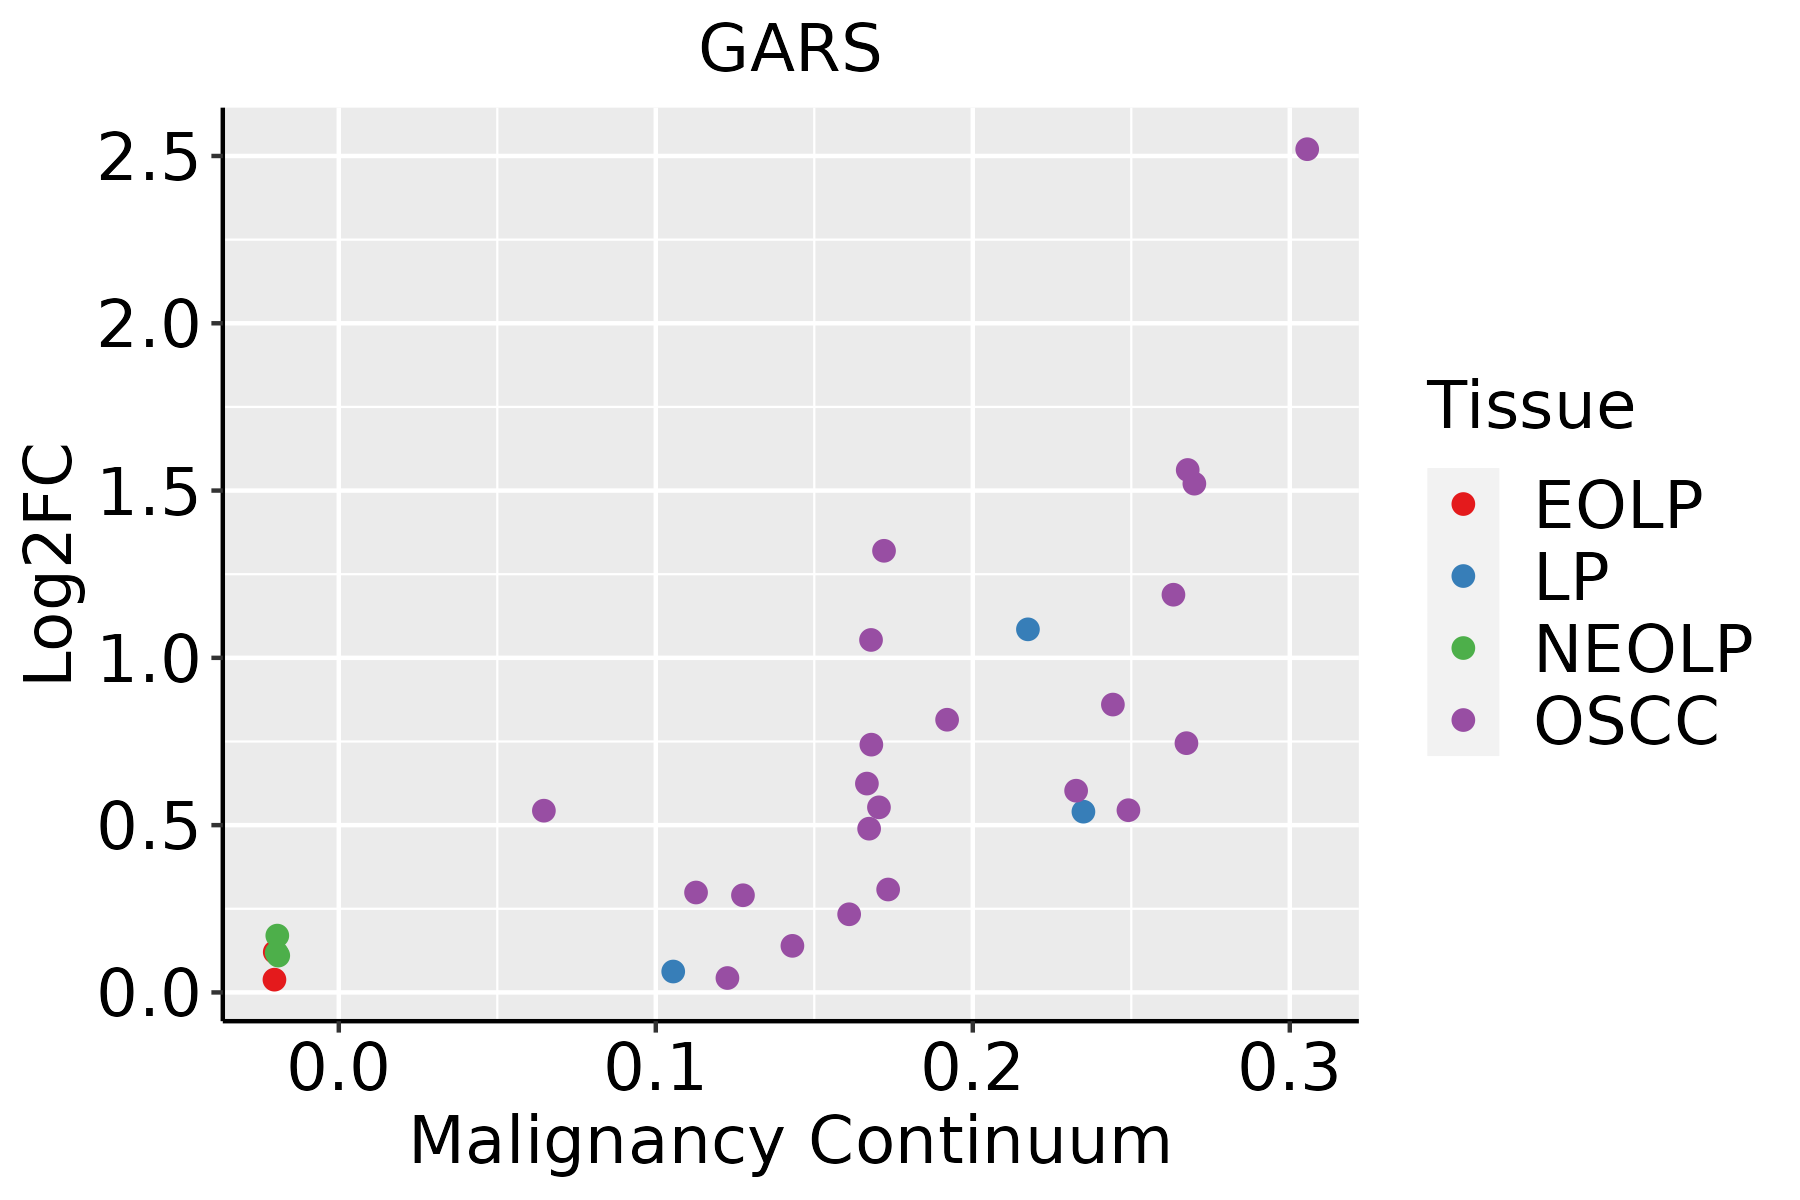 | EOLP: Erosive Oral lichen planus |
| LP: leukoplakia | ||
| NEOLP: Non-erosive oral lichen planus | ||
| OSCC: Oral squamous cell carcinoma | ||
| Prostate |  | BPH: Benign Prostatic Hyperplasia |
| Skin | 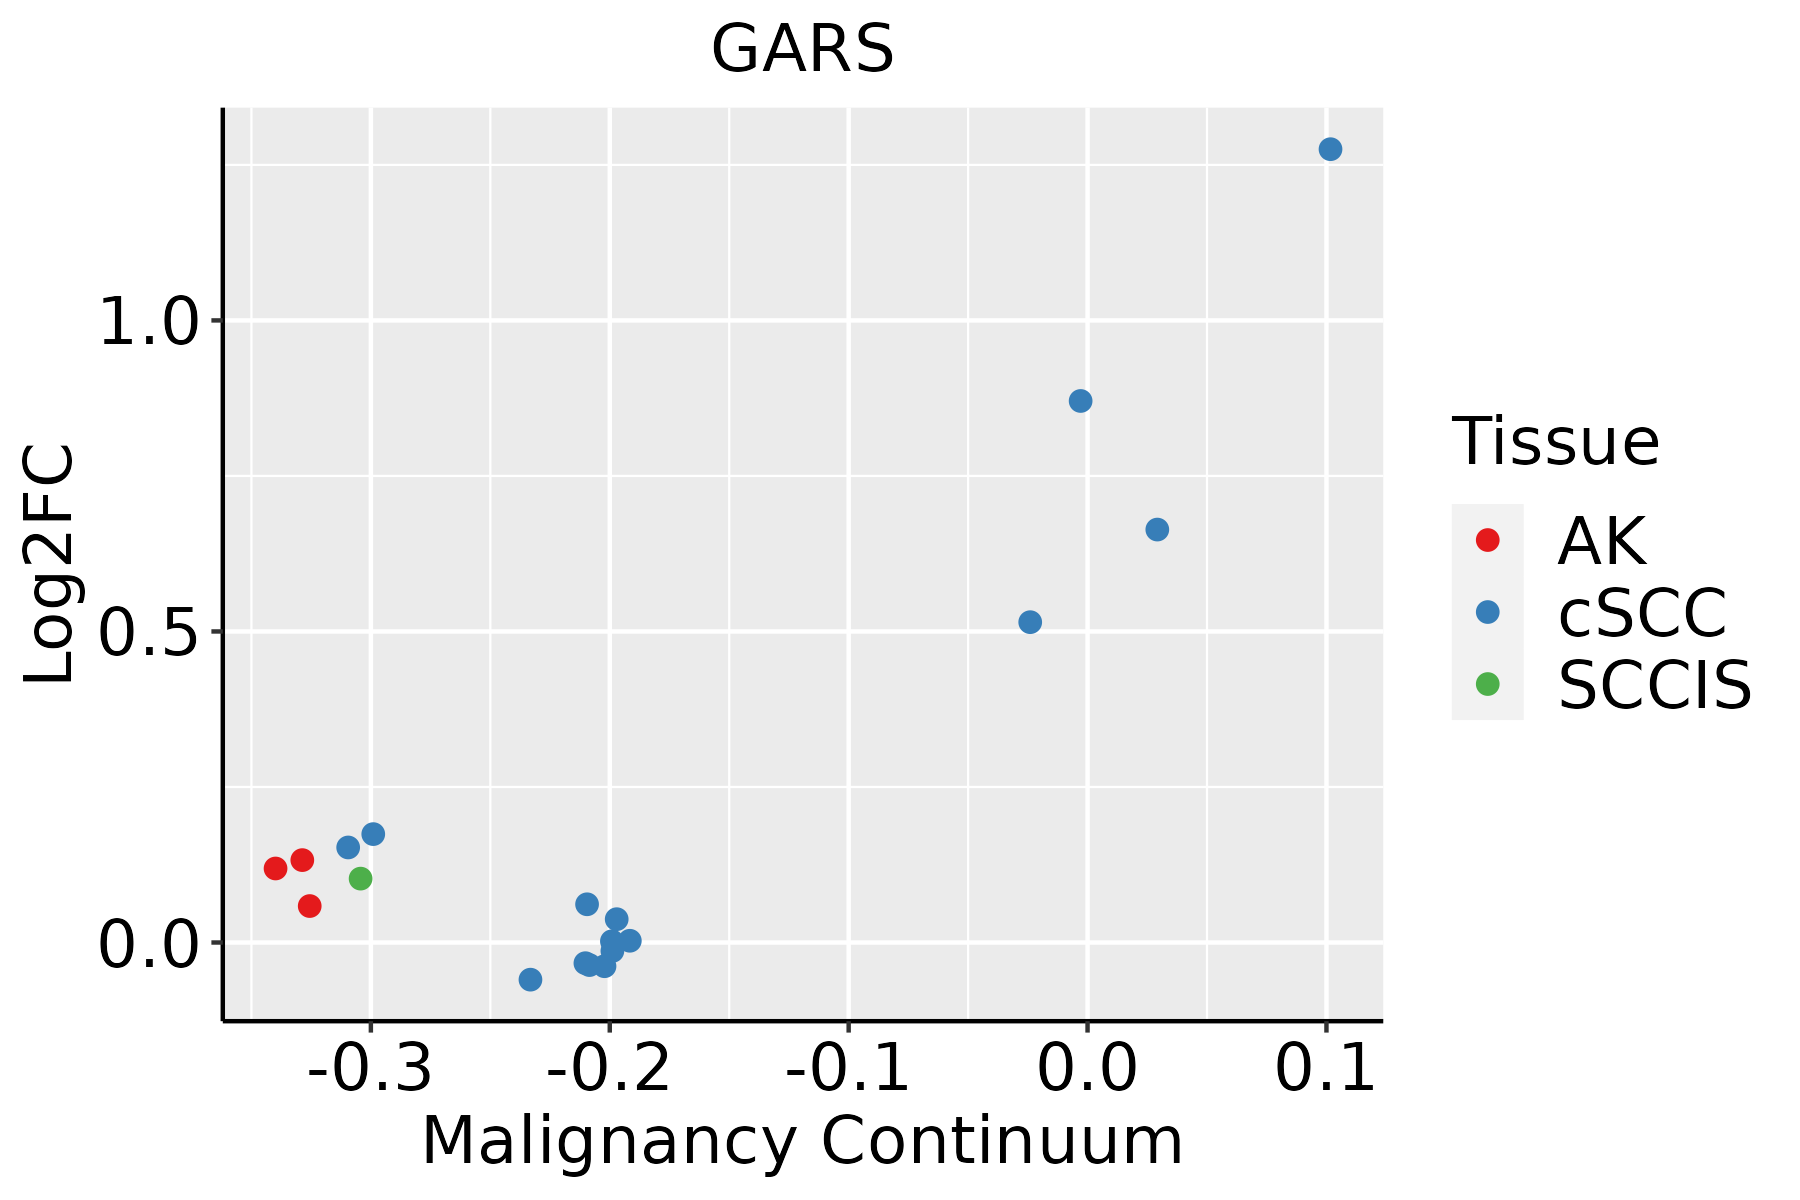 | AK: Actinic keratosis |
| cSCC: Cutaneous squamous cell carcinoma | ||
| SCCIS:squamous cell carcinoma in situ | ||
| Thyroid | 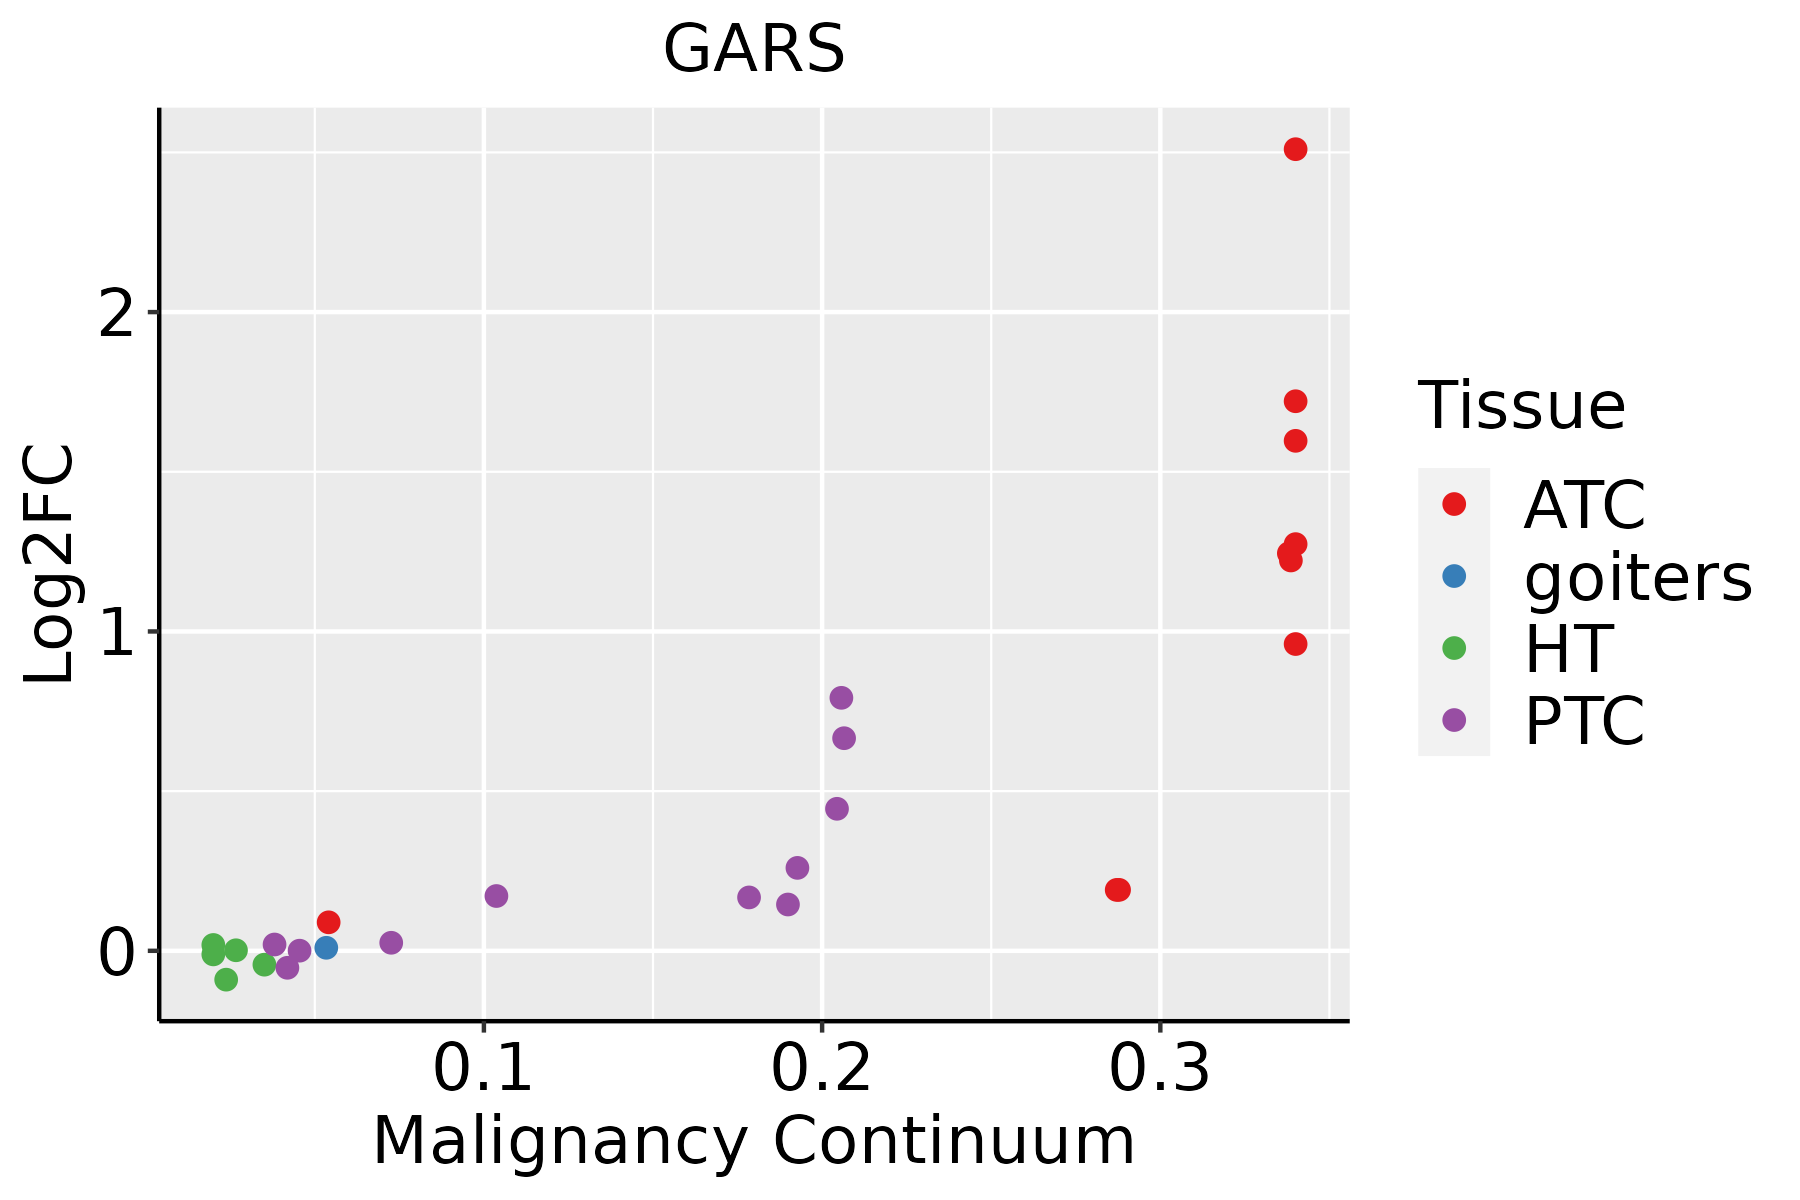 | ATC: Anaplastic thyroid cancer |
| HT: Hashimoto's thyroiditis | ||
| PTC: Papillary thyroid cancer |
| ∗log2FC in expression of this searched gene in stem-like cells from each diseased tissue sample relative to stem-like cells in normal samples in each tissue plotted against the malignancy continuum. Samples are colored based on if they are from different disease stage. |
Top |
Malignant transformation related pathway analysis |
| Find out the enriched GO biological processes and KEGG pathways involved in transition from healthy to precancer to cancer |
| Tissue | Disease Stage | Enriched GO biological Processes |
| Colorectum | AD |  |
| Colorectum | SER |  |
| Colorectum | MSS |  |
| Colorectum | MSI-H |  |
| Colorectum | FAP |  |
| ∗Top 15 enriched GO BP terms are showed in the bar plot of each disease state in each tissue. Each row represents a significant GO biological process which is colored according to the -log10(p.adjust). |
| Page: 1 2 3 4 5 6 7 8 9 |
| GO ID | Tissue | Disease Stage | Description | Gene Ratio | Bg Ratio | pvalue | p.adjust | Count |
| GO:0009117 | Colorectum | AD | nucleotide metabolic process | 168/3918 | 489/18723 | 2.20e-12 | 3.36e-10 | 168 |
| GO:0006753 | Colorectum | AD | nucleoside phosphate metabolic process | 169/3918 | 497/18723 | 4.99e-12 | 6.98e-10 | 169 |
| GO:1901293 | Colorectum | AD | nucleoside phosphate biosynthetic process | 80/3918 | 256/18723 | 6.31e-05 | 1.05e-03 | 80 |
| GO:0009165 | Colorectum | AD | nucleotide biosynthetic process | 79/3918 | 254/18723 | 8.33e-05 | 1.30e-03 | 79 |
| GO:0006418 | Colorectum | AD | tRNA aminoacylation for protein translation | 19/3918 | 41/18723 | 2.37e-04 | 3.03e-03 | 19 |
| GO:0043039 | Colorectum | AD | tRNA aminoacylation | 19/3918 | 44/18723 | 7.13e-04 | 7.21e-03 | 19 |
| GO:0043038 | Colorectum | AD | amino acid activation | 19/3918 | 45/18723 | 9.94e-04 | 9.28e-03 | 19 |
| GO:0006520 | Colorectum | AD | cellular amino acid metabolic process | 81/3918 | 284/18723 | 1.37e-03 | 1.19e-02 | 81 |
| GO:00091171 | Colorectum | SER | nucleotide metabolic process | 122/2897 | 489/18723 | 2.50e-08 | 1.76e-06 | 122 |
| GO:00067531 | Colorectum | SER | nucleoside phosphate metabolic process | 122/2897 | 497/18723 | 6.64e-08 | 4.33e-06 | 122 |
| GO:00064181 | Colorectum | SER | tRNA aminoacylation for protein translation | 17/2897 | 41/18723 | 5.75e-05 | 1.35e-03 | 17 |
| GO:00430391 | Colorectum | SER | tRNA aminoacylation | 17/2897 | 44/18723 | 1.64e-04 | 3.12e-03 | 17 |
| GO:00430381 | Colorectum | SER | amino acid activation | 17/2897 | 45/18723 | 2.25e-04 | 3.91e-03 | 17 |
| GO:00091651 | Colorectum | SER | nucleotide biosynthetic process | 58/2897 | 254/18723 | 1.21e-03 | 1.38e-02 | 58 |
| GO:19012931 | Colorectum | SER | nucleoside phosphate biosynthetic process | 58/2897 | 256/18723 | 1.47e-03 | 1.59e-02 | 58 |
| GO:00065201 | Colorectum | SER | cellular amino acid metabolic process | 61/2897 | 284/18723 | 4.20e-03 | 3.41e-02 | 61 |
| Page: 1 |
| Pathway ID | Tissue | Disease Stage | Description | Gene Ratio | Bg Ratio | pvalue | p.adjust | qvalue | Count |
| hsa00670 | Colorectum | MSI-H | One carbon pool by folate | 7/797 | 20/8465 | 1.65e-03 | 1.73e-02 | 1.45e-02 | 7 |
| hsa006701 | Colorectum | MSI-H | One carbon pool by folate | 7/797 | 20/8465 | 1.65e-03 | 1.73e-02 | 1.45e-02 | 7 |
| hsa015232 | Esophagus | ESCC | Antifolate resistance | 22/4205 | 30/8465 | 7.23e-03 | 1.76e-02 | 8.99e-03 | 22 |
| hsa0152311 | Esophagus | ESCC | Antifolate resistance | 22/4205 | 30/8465 | 7.23e-03 | 1.76e-02 | 8.99e-03 | 22 |
| hsa006702 | Liver | HCC | One carbon pool by folate | 17/4020 | 20/8465 | 6.04e-04 | 2.50e-03 | 1.39e-03 | 17 |
| hsa01523 | Liver | HCC | Antifolate resistance | 21/4020 | 30/8465 | 1.06e-02 | 2.71e-02 | 1.51e-02 | 21 |
| hsa0067011 | Liver | HCC | One carbon pool by folate | 17/4020 | 20/8465 | 6.04e-04 | 2.50e-03 | 1.39e-03 | 17 |
| hsa015231 | Liver | HCC | Antifolate resistance | 21/4020 | 30/8465 | 1.06e-02 | 2.71e-02 | 1.51e-02 | 21 |
| Page: 1 |
Top |
Cell-cell communication analysis |
| Identification of potential cell-cell interactions between two cell types and their ligand-receptor pairs for different disease states |
| Ligand | Receptor | LRpair | Pathway | Tissue | Disease Stage |
| Page: 1 |
Top |
Single-cell gene regulatory network inference analysis |
| Find out the significant the regulons (TFs) and the target genes of each regulon across cell types for different disease states |
| TF | Cell Type | Tissue | Disease Stage | Target Gene | RSS | Regulon Activity |
| ∗The dot plots of a searched regulon are shown for all cell subpopulations in each disease state of each tissue based on the regulon specific score inferred using pySCENIC and by calculating the average expression. |
| Page: 1 |
Top |
Somatic mutation of malignant transformation related genes |
| Annotation of somatic variants for genes involved in malignant transformation |
| Hugo Symbol | Variant Class | Variant Classification | dbSNP RS | HGVSc | HGVSp | HGVSp Short | SWISSPROT | BIOTYPE | SIFT | PolyPhen | Tumor Sample Barcode | Tissue | Histology | Sex | Age | Stage | Therapy Types | Drugs | Outcome |
| GARS | SNV | Missense_Mutation | c.2099N>G | p.Ser700Cys | p.S700C | P41250 | protein_coding | deleterious(0.02) | possibly_damaging(0.774) | TCGA-A2-A25A-01 | Breast | breast invasive carcinoma | Female | <65 | I/II | Unspecific | Cytoxan | SD | |
| GARS | SNV | Missense_Mutation | novel | c.1768N>A | p.Glu590Lys | p.E590K | P41250 | protein_coding | deleterious(0) | probably_damaging(0.999) | TCGA-BH-A0B6-01 | Breast | breast invasive carcinoma | Female | <65 | I/II | Unknown | Unknown | SD |
| GARS | SNV | Missense_Mutation | rs373326652 | c.700N>A | p.Glu234Lys | p.E234K | P41250 | protein_coding | deleterious(0.03) | benign(0.081) | TCGA-C8-A135-01 | Breast | breast invasive carcinoma | Female | <65 | I/II | Chemotherapy | 5-fluorouracil | CR |
| GARS | SNV | Missense_Mutation | rs779225125 | c.1568N>T | p.Asp523Val | p.D523V | P41250 | protein_coding | tolerated(0.07) | benign(0.067) | TCGA-EW-A2FW-01 | Breast | breast invasive carcinoma | Female | <65 | I/II | Hormone Therapy | exemestane | SD |
| GARS | insertion | Frame_Shift_Ins | novel | c.469_470insATCAAAATCTTGTCTGTTTGATAAATTTTATATTTAATTCTGG | p.Leu157TyrfsTer44 | p.L157Yfs*44 | P41250 | protein_coding | TCGA-A8-A07Z-01 | Breast | breast invasive carcinoma | Female | >=65 | I/II | Unspecific | Exemestane | SD | ||
| GARS | SNV | Missense_Mutation | rs775471710 | c.1945G>A | p.Asp649Asn | p.D649N | P41250 | protein_coding | tolerated(0.06) | benign(0.155) | TCGA-LP-A4AW-01 | Cervix | cervical & endocervical cancer | Female | <65 | I/II | Unknown | Unknown | SD |
| GARS | SNV | Missense_Mutation | c.1184N>A | p.Ala395Asp | p.A395D | P41250 | protein_coding | deleterious(0) | probably_damaging(0.999) | TCGA-AA-3663-01 | Colorectum | colon adenocarcinoma | Male | <65 | I/II | Unknown | Unknown | SD | |
| GARS | SNV | Missense_Mutation | c.1235N>A | p.Arg412His | p.R412H | P41250 | protein_coding | deleterious(0) | probably_damaging(1) | TCGA-AA-A010-01 | Colorectum | colon adenocarcinoma | Female | <65 | I/II | Chemotherapy | folinic | CR | |
| GARS | SNV | Missense_Mutation | c.1235N>A | p.Arg412His | p.R412H | P41250 | protein_coding | deleterious(0) | probably_damaging(1) | TCGA-D5-6530-01 | Colorectum | colon adenocarcinoma | Male | <65 | I/II | Unknown | Unknown | SD | |
| GARS | SNV | Missense_Mutation | novel | c.1241A>G | p.Tyr414Cys | p.Y414C | P41250 | protein_coding | deleterious(0) | probably_damaging(0.985) | TCGA-A5-A0G2-01 | Endometrium | uterine corpus endometrioid carcinoma | Female | <65 | III/IV | Unknown | Unknown | SD |
| Page: 1 2 3 4 5 |
Top |
Related drugs of malignant transformation related genes |
| Identification of chemicals and drugs interact with genes involved in malignant transfromation |
| (DGIdb 4.0) |
| Entrez ID | Symbol | Category | Interaction Types | Drug Claim Name | Drug Name | PMIDs |
| Page: 1 |

Copyright 2023-Present -The University of Texas Health Science Center at Houston |