Schematic overview of the cellular and molecular mechanisms involved in the cancer progression, including the proposed cellular and molecular mechanisms in cancer cells trajectory. AT1: alveolar type 1 cells; AT2: alveolar type 2 cells; AAH: atypical adenomatous hyperplasia; AIS: adenocarcinoma in situ; MIA: minimally invasive adenocarcinoma; IA: invasive adenocarcinoma; EMT: epithelial-mesenchymal transition

Home

Download

Statistics

Help

Contact

Center for Computational Systems Medicine
leaf

Gene summary

leaf

Malignant transformation analysis

leaf

Malignant transformation related pathway analysis

leaf

Cell-cell communication analysis

leaf

Single-cell gene regulatory network inference analysis

leaf

Somatic mutation of malignant transformation related genes

leaf

Related drugs of malignant transformation related genes

Gene: GAREM1

Gene summary for GAREM1

check button Gene summary.

Gene informationSpeciesHuman
Gene symbol

GAREM1

Gene ID

64762

Gene nameGRB2 associated regulator of MAPK1 subtype 1
Gene AliasC18orf11
Cytomap18q12.1
Gene Typeprotein-coding
GO ID

GO:0000165

UniProtAcc

Q9H706


Top

Malignant transformation analysis

check button Identification of the aberrant gene expression in precancerous and cancerous lesions by comparing the gene expression of stem-like cells in diseased tissues with normal stem cells
check button Malignant transformation involving gene list.
Entrez IDSymbolReplicatesSpeciesOrganTissueAdj P-valueLog2FCMalignancy
64762GAREM1CCI_1HumanCervixCC3.26e-127.79e-010.528
64762GAREM1CCI_2HumanCervixCC4.57e-098.14e-010.5249
64762GAREM1CCI_3HumanCervixCC7.84e-105.34e-010.516
64762GAREM1HTA11_1938_2000001011HumanColorectumAD3.06e-036.11e-01-0.0811
64762GAREM1HTA11_78_2000001011HumanColorectumAD1.51e-077.61e-01-0.1088
64762GAREM1HTA11_347_2000001011HumanColorectumAD2.19e-188.36e-01-0.1954
64762GAREM1HTA11_1391_2000001011HumanColorectumAD3.70e-066.03e-01-0.059
64762GAREM1HTA11_7862_2000001011HumanColorectumAD5.71e-035.94e-01-0.0179
64762GAREM1HTA11_866_3004761011HumanColorectumAD7.22e-137.87e-010.096
64762GAREM1HTA11_4255_2000001011HumanColorectumSER7.56e-037.45e-010.0446
64762GAREM1HTA11_7663_2000001011HumanColorectumSER5.29e-058.38e-010.0131
64762GAREM1HTA11_10623_2000001011HumanColorectumAD1.21e-089.05e-01-0.0177
64762GAREM1HTA11_6801_2000001011HumanColorectumSER1.78e-121.60e+000.0171
64762GAREM1HTA11_7469_2000001011HumanColorectumAD1.70e-028.31e-01-0.0124
64762GAREM1HTA11_99999970781_79442HumanColorectumMSS6.73e-191.16e+000.294
64762GAREM1HTA11_99999965062_69753HumanColorectumMSI-H3.66e-162.22e+000.3487
64762GAREM1HTA11_99999971662_82457HumanColorectumMSS7.25e-088.45e-010.3859
64762GAREM1A015-C-203HumanColorectumFAP1.23e-27-4.03e-01-0.1294
64762GAREM1A015-C-204HumanColorectumFAP5.28e-05-3.09e-01-0.0228
64762GAREM1A002-C-201HumanColorectumFAP2.09e-08-3.00e-010.0324
Page: 1 2 3 4 

check button Transcriptomic changes along malignancy continuum.
TissueExpression DynamicsAbbreviation
CervixThe image shows the transcriptomic changes along malignancy continuum.log2FC in expression of this searched gene in stem-like cells from each diseased tissue sample relative to stem-like cells in normal samples in each tissue plotted against the malignancy continuum. Samples are colored based on if they are from different disease stage.CC: Cervix cancer
HSIL_HPV: HPV-infected high-grade squamous intraepithelial lesions
N_HPV: HPV-infected normal cervix
Colorectum (GSE201348)The image shows the transcriptomic changes along malignancy continuum.log2FC in expression of this searched gene in stem-like cells from each diseased tissue sample relative to stem-like cells in normal samples in each tissue plotted against the malignancy continuum. Samples are colored based on if they are from different disease stage.FAP: Familial adenomatous polyposis
CRC: Colorectal cancer
Colorectum (HTA11)The image shows the transcriptomic changes along malignancy continuum.log2FC in expression of this searched gene in stem-like cells from each diseased tissue sample relative to stem-like cells in normal samples in each tissue plotted against the malignancy continuum. Samples are colored based on if they are from different disease stage.AD: Adenomas
SER: Sessile serrated lesions
MSI-H: Microsatellite-high colorectal cancer
MSS: Microsatellite stable colorectal cancer
EndometriumThe image shows the transcriptomic changes along malignancy continuum.log2FC in expression of this searched gene in stem-like cells from each diseased tissue sample relative to stem-like cells in normal samples in each tissue plotted against the malignancy continuum. Samples are colored based on if they are from different disease stage.
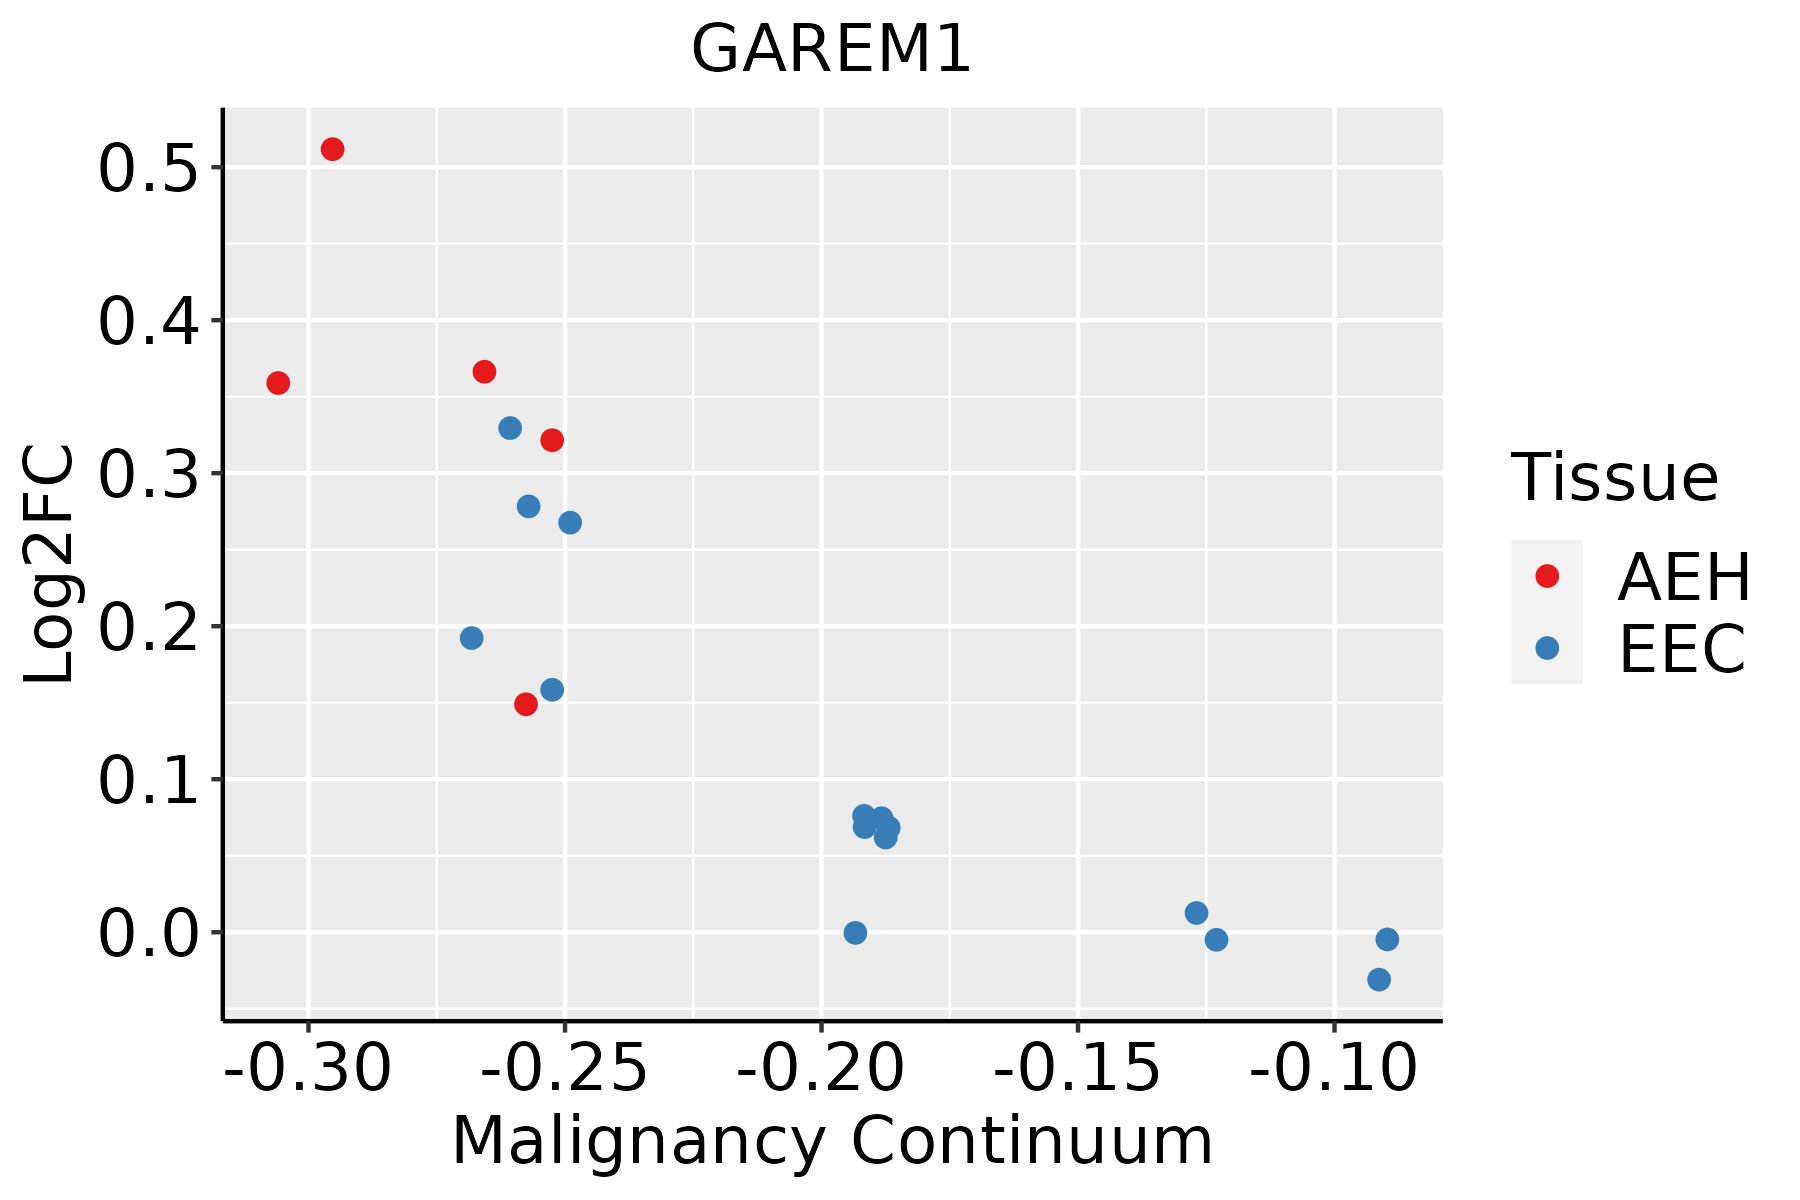
AEH: Atypical endometrial hyperplasia
EEC: Endometrioid Cancer
LiverThe image shows the transcriptomic changes along malignancy continuum.log2FC in expression of this searched gene in stem-like cells from each diseased tissue sample relative to stem-like cells in normal samples in each tissue plotted against the malignancy continuum. Samples are colored based on if they are from different disease stage.
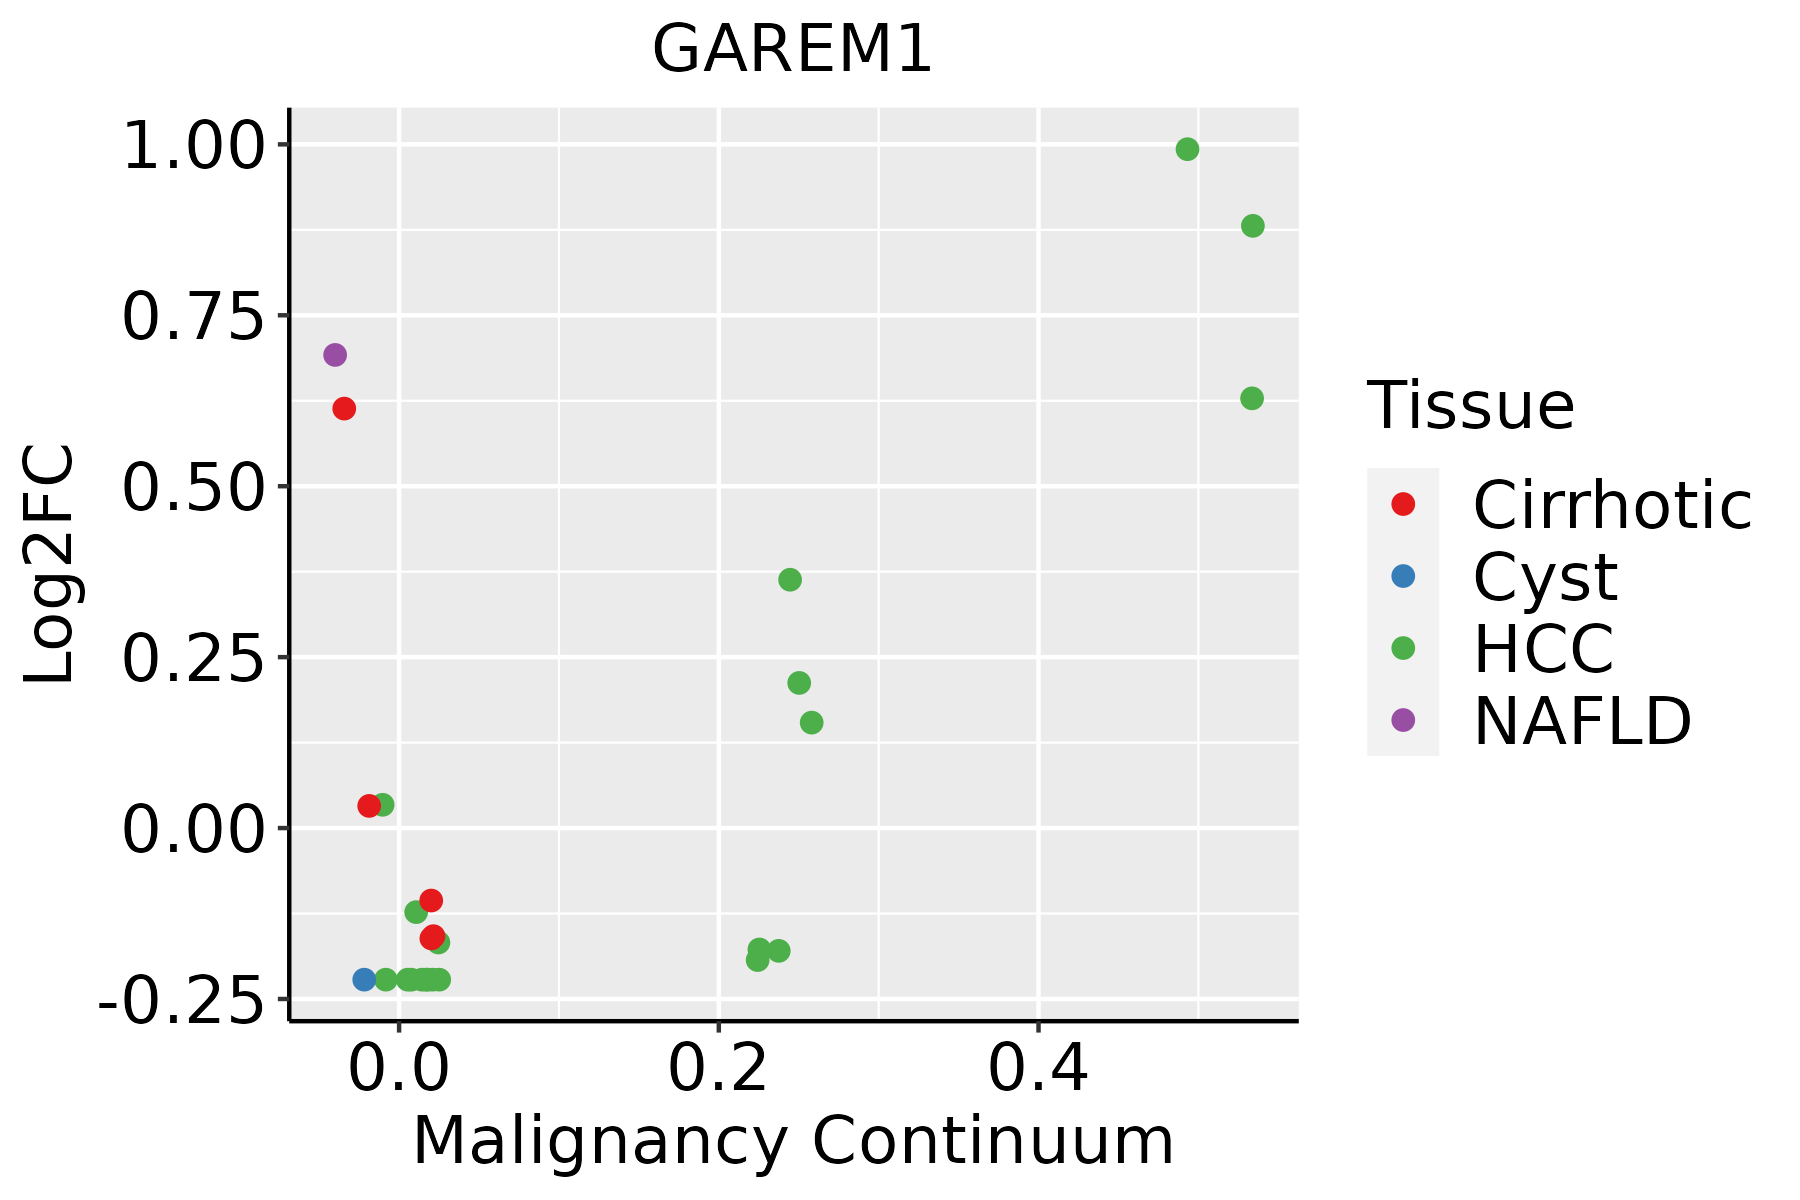
HCC: Hepatocellular carcinoma
NAFLD: Non-alcoholic fatty liver disease
LungThe image shows the transcriptomic changes along malignancy continuum.log2FC in expression of this searched gene in stem-like cells from each diseased tissue sample relative to stem-like cells in normal samples in each tissue plotted against the malignancy continuum. Samples are colored based on if they are from different disease stage.AAH: Atypical adenomatous hyperplasia
AIS: Adenocarcinoma in situ
IAC: Invasive lung adenocarcinoma
MIA: Minimally invasive adenocarcinoma
ProstateThe image shows the transcriptomic changes along malignancy continuum.log2FC in expression of this searched gene in stem-like cells from each diseased tissue sample relative to stem-like cells in normal samples in each tissue plotted against the malignancy continuum. Samples are colored based on if they are from different disease stage.BPH: Benign Prostatic Hyperplasia
∗log2FC in expression of this searched gene in stem-like cells from each diseased tissue sample relative to stem-like cells in normal samples in each tissue plotted against the malignancy continuum. Samples are colored based on if they are from different disease stage.

Top

Malignant transformation related pathway analysis

check buttonFind out the enriched GO biological processes and KEGG pathways involved in transition from healthy to precancer to cancer
check button Figure of enriched GO biological processes.
TissueDisease StageEnriched GO biological Processes
ColorectumADGO analysis - Figure of enriched GO biological processes: Top 15 enriched GO BP terms are showed in the bar plot of each disease state in each tissue. Each row represents a significant GO biological process which is colored according to the -log10(p.adjust).
ColorectumSERGO analysis - Figure of enriched GO biological processes: Top 15 enriched GO BP terms are showed in the bar plot of each disease state in each tissue. Each row represents a significant GO biological process which is colored according to the -log10(p.adjust).
ColorectumMSSGO analysis - Figure of enriched GO biological processes: Top 15 enriched GO BP terms are showed in the bar plot of each disease state in each tissue. Each row represents a significant GO biological process which is colored according to the -log10(p.adjust).
ColorectumMSI-HGO analysis - Figure of enriched GO biological processes: Top 15 enriched GO BP terms are showed in the bar plot of each disease state in each tissue. Each row represents a significant GO biological process which is colored according to the -log10(p.adjust).
ColorectumFAPGO analysis - Figure of enriched GO biological processes: Top 15 enriched GO BP terms are showed in the bar plot of each disease state in each tissue. Each row represents a significant GO biological process which is colored according to the -log10(p.adjust).
∗Top 15 enriched GO BP terms are showed in the bar plot of each disease state in each tissue. Each row represents a significant GO biological process which is colored according to the -log10(p.adjust).
Page: 1 2 3 4 5 6 7 8 9 

check button Enriched GO biological processes.
GO IDTissueDisease StageDescriptionGene RatioBg Ratiopvaluep.adjustCount
GO:00071738CervixCCepidermal growth factor receptor signaling pathway36/2311108/187231.04e-088.44e-0736
GO:00381278CervixCCERBB signaling pathway37/2311121/187238.57e-084.88e-0637
GO:00434104CervixCCpositive regulation of MAPK cascade90/2311480/187232.92e-054.83e-0490
GO:00713648CervixCCcellular response to epidermal growth factor stimulus16/231145/187235.24e-057.83e-0416
GO:00708498CervixCCresponse to epidermal growth factor16/231149/187231.67e-041.99e-0316
GO:00513021CervixCCregulation of cell division39/2311177/187232.05e-042.33e-0339
GO:00703714CervixCCERK1 and ERK2 cascade60/2311330/187231.28e-031.02e-0260
GO:00703723CervixCCregulation of ERK1 and ERK2 cascade54/2311309/187235.11e-033.02e-0254
GO:0038127ColorectumADERBB signaling pathway55/3918121/187231.19e-098.85e-0855
GO:0007173ColorectumADepidermal growth factor receptor signaling pathway50/3918108/187233.08e-092.07e-0750
GO:0070849ColorectumADresponse to epidermal growth factor23/391849/187234.18e-057.37e-0423
GO:0071364ColorectumADcellular response to epidermal growth factor stimulus21/391845/187239.94e-051.50e-0321
GO:00708491ColorectumSERresponse to epidermal growth factor20/289749/187231.72e-055.15e-0420
GO:00713641ColorectumSERcellular response to epidermal growth factor stimulus18/289745/187236.20e-051.44e-0318
GO:00381271ColorectumSERERBB signaling pathway35/2897121/187231.21e-042.49e-0335
GO:00071731ColorectumSERepidermal growth factor receptor signaling pathway32/2897108/187231.42e-042.82e-0332
GO:00071732ColorectumMSSepidermal growth factor receptor signaling pathway43/3467108/187231.92e-078.31e-0643
GO:00381272ColorectumMSSERBB signaling pathway46/3467121/187233.63e-071.45e-0546
GO:00708492ColorectumMSSresponse to epidermal growth factor20/346749/187232.36e-043.24e-0320
GO:00713642ColorectumMSScellular response to epidermal growth factor stimulus18/346745/187236.38e-046.99e-0318
Page: 1 2 3 4 5 

check button Enriched KEGG pathways.
Pathway IDTissueDisease StageDescriptionGene RatioBg Ratiopvaluep.adjustqvalueCount
Page: 1 

Top

Cell-cell communication analysis

check buttonIdentification of potential cell-cell interactions between two cell types and their ligand-receptor pairs for different disease states
LigandReceptorLRpairPathwayTissueDisease Stage
Page: 1 

Top

Single-cell gene regulatory network inference analysis

check buttonFind out the significant the regulons (TFs) and the target genes of each regulon across cell types for different disease states
TFCell TypeTissueDisease StageTarget GeneRSSRegulon Activity
∗The dot plots of a searched regulon are shown for all cell subpopulations in each disease state of each tissue based on the regulon specific score inferred using pySCENIC and by calculating the average expression.
Page: 1 

Top

Somatic mutation of malignant transformation related genes

check buttonAnnotation of somatic variants for genes involved in malignant transformation
Hugo SymbolVariant ClassVariant ClassificationdbSNP RSHGVScHGVSpHGVSp ShortSWISSPROTBIOTYPESIFTPolyPhenTumor Sample BarcodeTissueHistologySexAgeStageTherapy TypesDrugsOutcome
GAREM1SNVMissense_Mutationnovelc.561N>Gp.Ile187Metp.I187MQ9H706protein_codingdeleterious(0.04)possibly_damaging(0.824)TCGA-5L-AAT1-01Breastbreast invasive carcinomaFemale<65III/IVHormone TherapyletrozolSD
GAREM1SNVMissense_Mutationc.1124N>Tp.Ala375Valp.A375VQ9H706protein_codingdeleterious(0)probably_damaging(0.994)TCGA-A2-A0ET-01Breastbreast invasive carcinomaFemale<65III/IVChemotherapycytoxanSD
GAREM1SNVMissense_Mutationc.2254N>Ap.Glu752Lysp.E752KQ9H706protein_codingtolerated(0.08)possibly_damaging(0.551)TCGA-AN-A0FY-01Breastbreast invasive carcinomaFemale<65I/IIUnknownUnknownSD
GAREM1insertionNonsense_Mutationnovelc.941_942insTTTAGGAATTAGAGTTTTACTCTATGTCTGATGAGAACCTCp.Lys314AsnfsTer11p.K314Nfs*11Q9H706protein_codingTCGA-A2-A0EX-01Breastbreast invasive carcinomaFemale<65I/IIHormone TherapytamoxiphenSD
GAREM1insertionNonsense_Mutationnovelc.398_399insATTTGTATGAATCACCGGACCAACGAAAGCATTAGCCTp.Ser134PhefsTer3p.S134Ffs*3Q9H706protein_codingTCGA-A7-A0CJ-01Breastbreast invasive carcinomaFemale<65I/IIChemotherapycytoxanSD
GAREM1insertionNonsense_Mutationnovelc.2221_2222insTTGCAGGTGAAGAAGATAATGCAATTCATTAATGGCTGGAGGp.Thr741delinsIleAlaGlyGluGluAspAsnAlaIleHisTerTrpLeuGluAlap.T741delinsIAGEEDNAIH*WLEAQ9H706protein_codingTCGA-A7-A0D9-01Breastbreast invasive carcinomaFemale<65I/IIChemotherapytaxotereSD
GAREM1insertionNonsense_Mutationnovelc.1395_1396insACAACAAATTAGCTGGGCGTGGTGGCGGGCGCCTCTAGTCCCAAGp.His465_Gln466insThrThrAsnTerLeuGlyValValAlaGlyAlaSerSerProLysp.H465_Q466insTTN*LGVVAGASSPKQ9H706protein_codingTCGA-A8-A07J-01Breastbreast invasive carcinomaFemale<65I/IIChemotherapy5-fluorouracilCR
GAREM1insertionFrame_Shift_Insnovelc.2104_2105insGGAGGCCp.Ser702TrpfsTer50p.S702Wfs*50Q9H706protein_codingTCGA-BH-A0BM-01Breastbreast invasive carcinomaFemale<65I/IIChemotherapyadriamycinSD
GAREM1insertionNonsense_Mutationnovelc.2102_2103insTAATGCAATTCATTAATGGp.Ser702AsnfsTer5p.S702Nfs*5Q9H706protein_codingTCGA-BH-A0BM-01Breastbreast invasive carcinomaFemale<65I/IIChemotherapyadriamycinSD
GAREM1SNVMissense_Mutationc.2506N>Ap.Glu836Lysp.E836KQ9H706protein_codingdeleterious(0)probably_damaging(0.985)TCGA-EK-A3GK-01Cervixcervical & endocervical cancerFemale<65I/IIUnknownUnknownSD
Page: 1 2 3 4 5 6 7 8 9 10 

Top

Related drugs of malignant transformation related genes

check buttonIdentification of chemicals and drugs interact with genes involved in malignant transfromation
(DGIdb 4.0)
Entrez IDSymbolCategoryInteraction TypesDrug Claim NameDrug NamePMIDs
Page: 1