
|
|||||
|
 | |
| |
| |
| |
| |
| |
|
Gene: GAPVD1 |
Gene summary for GAPVD1 |
| Gene information | Species | Human | Gene symbol | GAPVD1 | Gene ID | 26130 |
| Gene name | GTPase activating protein and VPS9 domains 1 | |
| Gene Alias | GAPEX5 | |
| Cytomap | 9q33.3 | |
| Gene Type | protein-coding | GO ID | GO:0006810 | UniProtAcc | Q14C86 |
Top |
Malignant transformation analysis |
| Identification of the aberrant gene expression in precancerous and cancerous lesions by comparing the gene expression of stem-like cells in diseased tissues with normal stem cells |
| Entrez ID | Symbol | Replicates | Species | Organ | Tissue | Adj P-value | Log2FC | Malignancy |
| 26130 | GAPVD1 | CCI_1 | Human | Cervix | CC | 1.82e-02 | 5.01e-01 | 0.528 |
| 26130 | GAPVD1 | CCI_2 | Human | Cervix | CC | 2.38e-14 | 1.28e+00 | 0.5249 |
| 26130 | GAPVD1 | CCI_3 | Human | Cervix | CC | 1.13e-07 | 8.05e-01 | 0.516 |
| 26130 | GAPVD1 | AEH-subject4 | Human | Endometrium | AEH | 1.11e-02 | 2.68e-01 | -0.2657 |
| 26130 | GAPVD1 | EEC-subject3 | Human | Endometrium | EEC | 4.46e-03 | 5.64e-02 | -0.2525 |
| 26130 | GAPVD1 | GSM6177620_NYU_UCEC1_lib1_lib1 | Human | Endometrium | EEC | 2.00e-04 | -2.23e-02 | -0.1869 |
| 26130 | GAPVD1 | GSM6177620_NYU_UCEC1_lib2_lib2 | Human | Endometrium | EEC | 1.14e-05 | -6.66e-02 | -0.1875 |
| 26130 | GAPVD1 | GSM6177620_NYU_UCEC1_lib3_lib3 | Human | Endometrium | EEC | 2.44e-08 | 2.61e-02 | -0.1883 |
| 26130 | GAPVD1 | GSM6177621_NYU_UCEC2_lib1_lib1 | Human | Endometrium | EEC | 1.61e-06 | 2.36e-02 | -0.1934 |
| 26130 | GAPVD1 | GSM6177622_NYU_UCEC3_lib1_lib1 | Human | Endometrium | EEC | 4.59e-16 | 6.64e-02 | -0.1917 |
| 26130 | GAPVD1 | GSM6177622_NYU_UCEC3_lib2_lib2 | Human | Endometrium | EEC | 4.26e-12 | -1.06e-02 | -0.1916 |
| 26130 | GAPVD1 | LZE2T | Human | Esophagus | ESCC | 7.11e-08 | 5.80e-01 | 0.082 |
| 26130 | GAPVD1 | LZE4T | Human | Esophagus | ESCC | 2.37e-12 | 4.10e-01 | 0.0811 |
| 26130 | GAPVD1 | LZE5T | Human | Esophagus | ESCC | 2.77e-05 | 2.63e-01 | 0.0514 |
| 26130 | GAPVD1 | LZE7T | Human | Esophagus | ESCC | 1.65e-08 | 4.34e-01 | 0.0667 |
| 26130 | GAPVD1 | LZE8T | Human | Esophagus | ESCC | 2.50e-07 | 1.61e-01 | 0.067 |
| 26130 | GAPVD1 | LZE20T | Human | Esophagus | ESCC | 2.11e-12 | 3.18e-01 | 0.0662 |
| 26130 | GAPVD1 | LZE22T | Human | Esophagus | ESCC | 4.08e-02 | 1.79e-01 | 0.068 |
| 26130 | GAPVD1 | LZE24T | Human | Esophagus | ESCC | 3.75e-16 | 3.49e-01 | 0.0596 |
| 26130 | GAPVD1 | LZE6T | Human | Esophagus | ESCC | 9.03e-07 | 2.09e-01 | 0.0845 |
| Page: 1 2 3 4 5 6 7 |
| Tissue | Expression Dynamics | Abbreviation |
| Cervix | 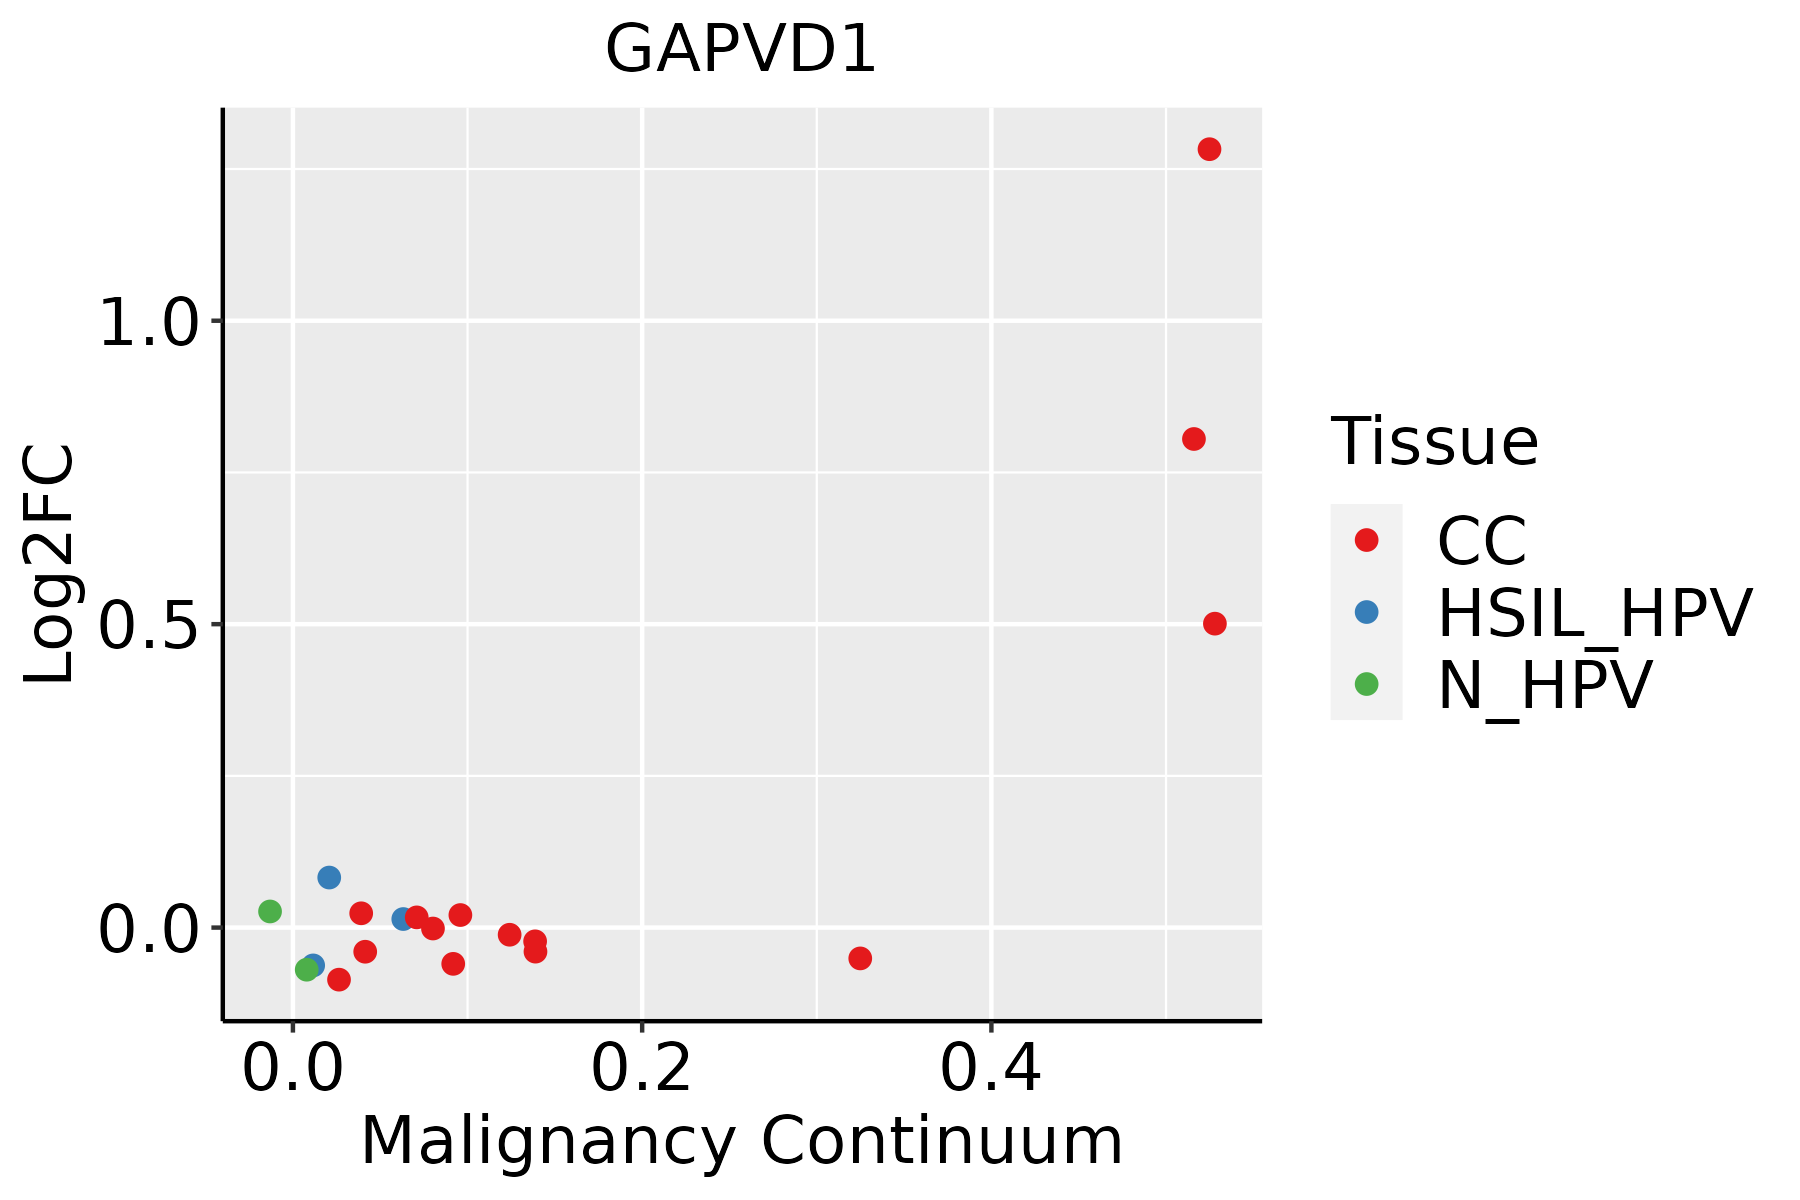 | CC: Cervix cancer |
| HSIL_HPV: HPV-infected high-grade squamous intraepithelial lesions | ||
| N_HPV: HPV-infected normal cervix | ||
| Endometrium | 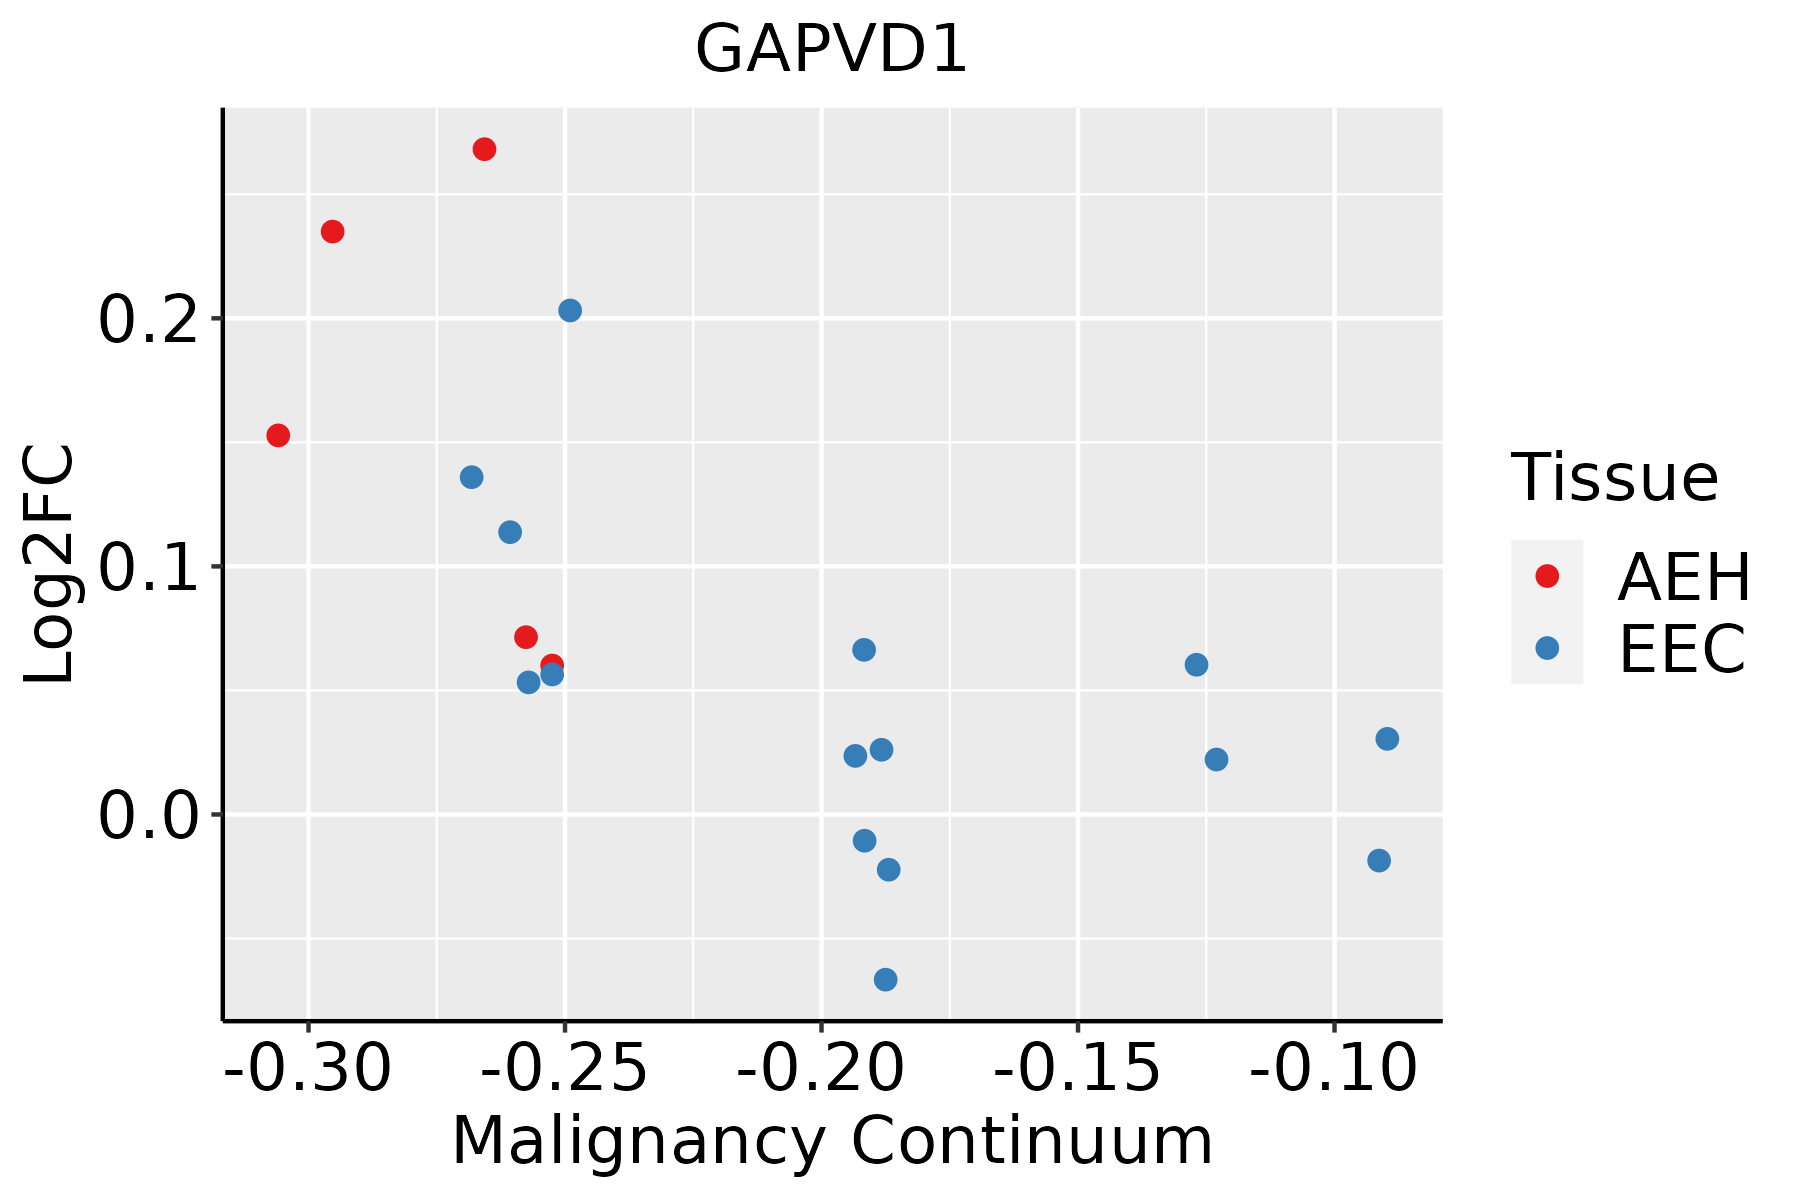 | AEH: Atypical endometrial hyperplasia |
| EEC: Endometrioid Cancer | ||
| Esophagus | 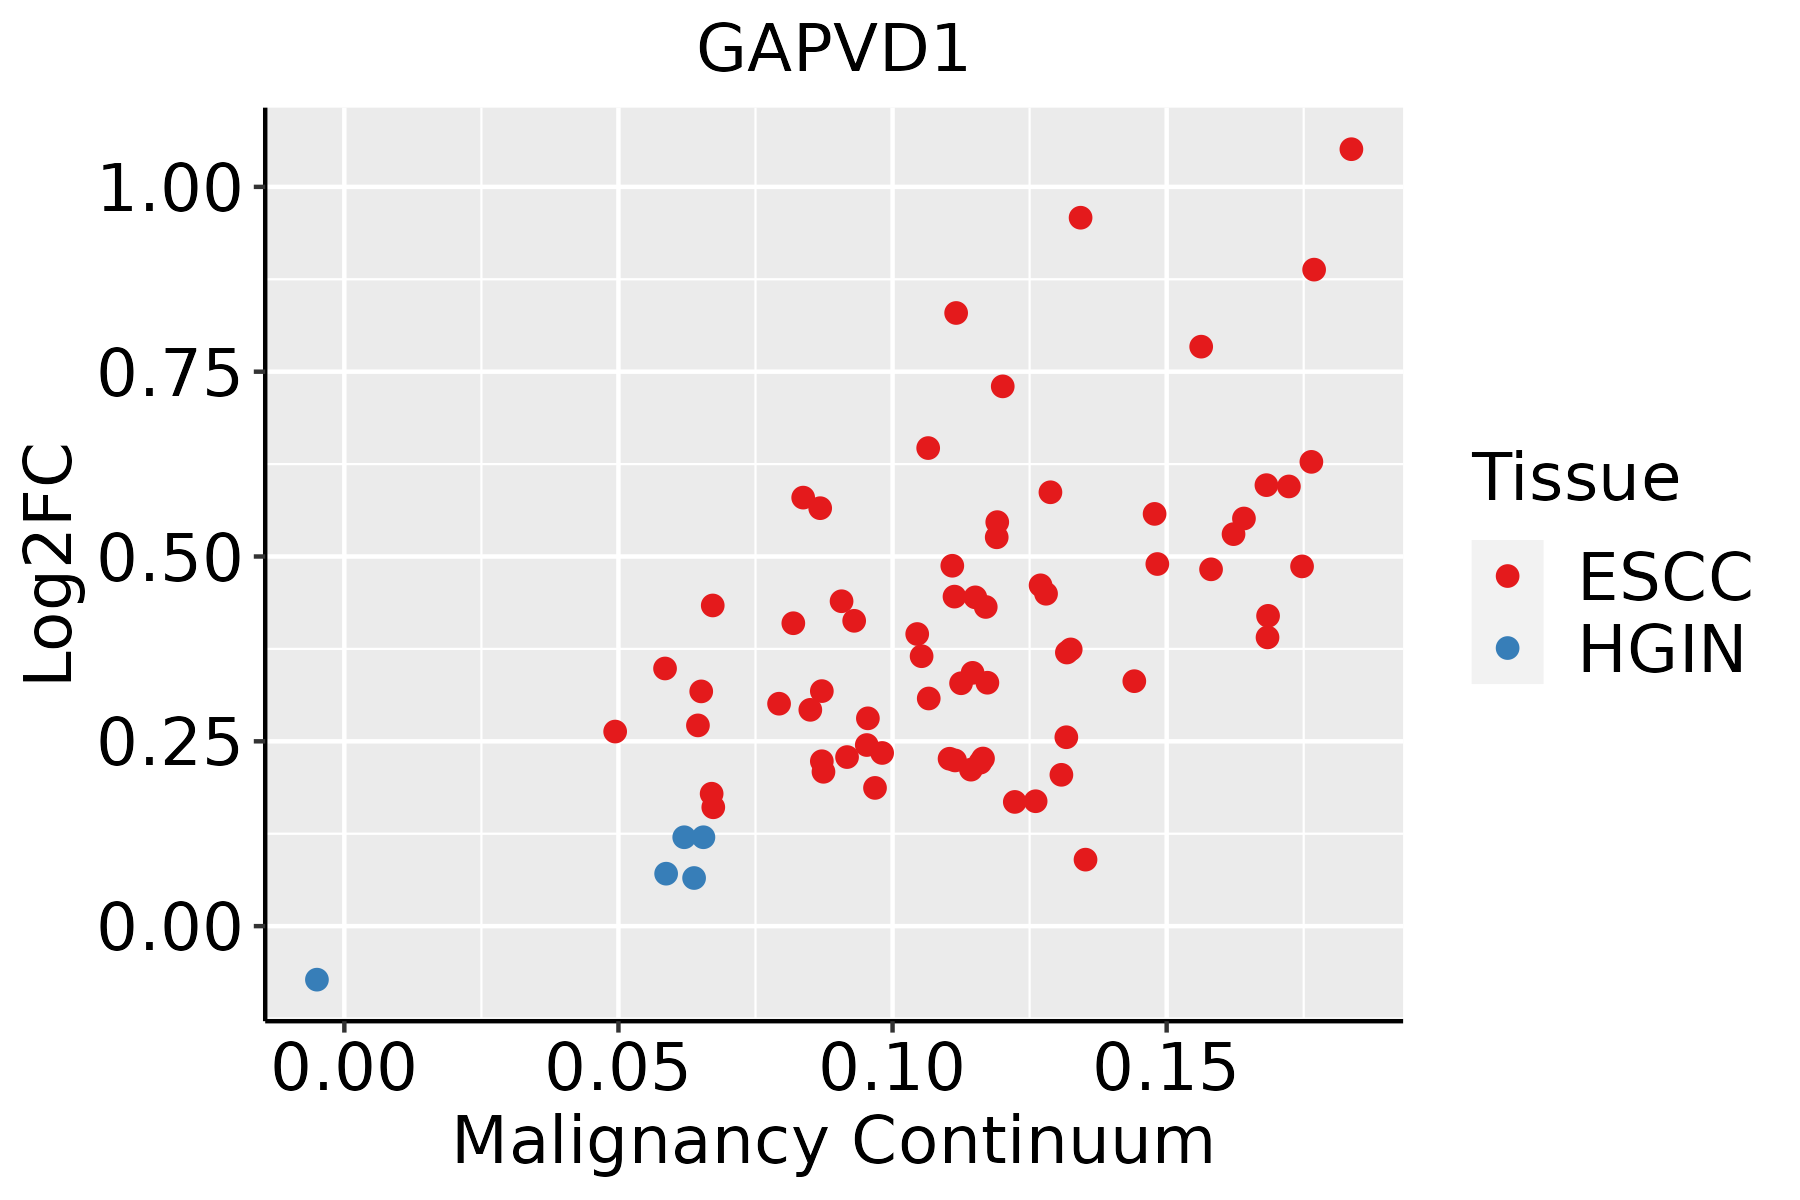 | ESCC: Esophageal squamous cell carcinoma |
| HGIN: High-grade intraepithelial neoplasias | ||
| LGIN: Low-grade intraepithelial neoplasias | ||
| Liver | 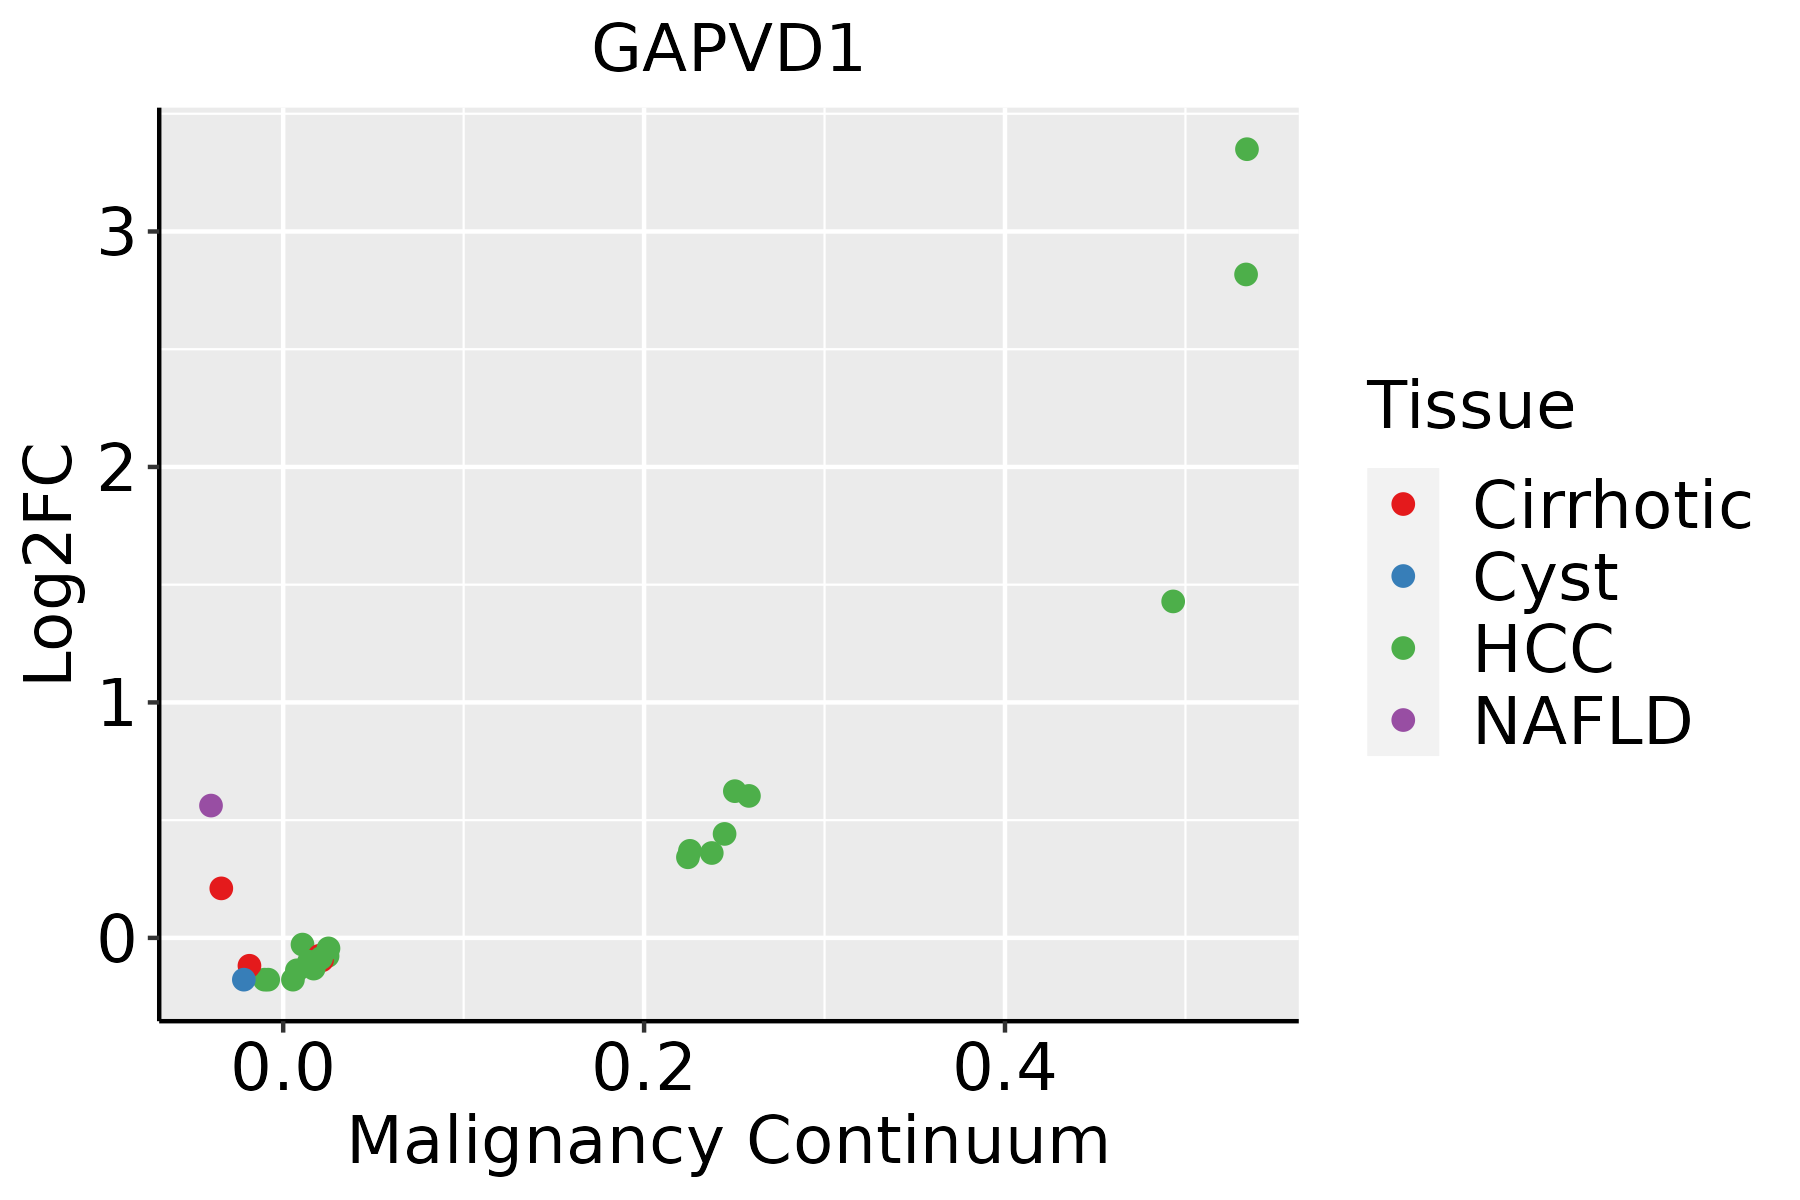 | HCC: Hepatocellular carcinoma |
| NAFLD: Non-alcoholic fatty liver disease | ||
| Oral Cavity |  | EOLP: Erosive Oral lichen planus |
| LP: leukoplakia | ||
| NEOLP: Non-erosive oral lichen planus | ||
| OSCC: Oral squamous cell carcinoma | ||
| Prostate | 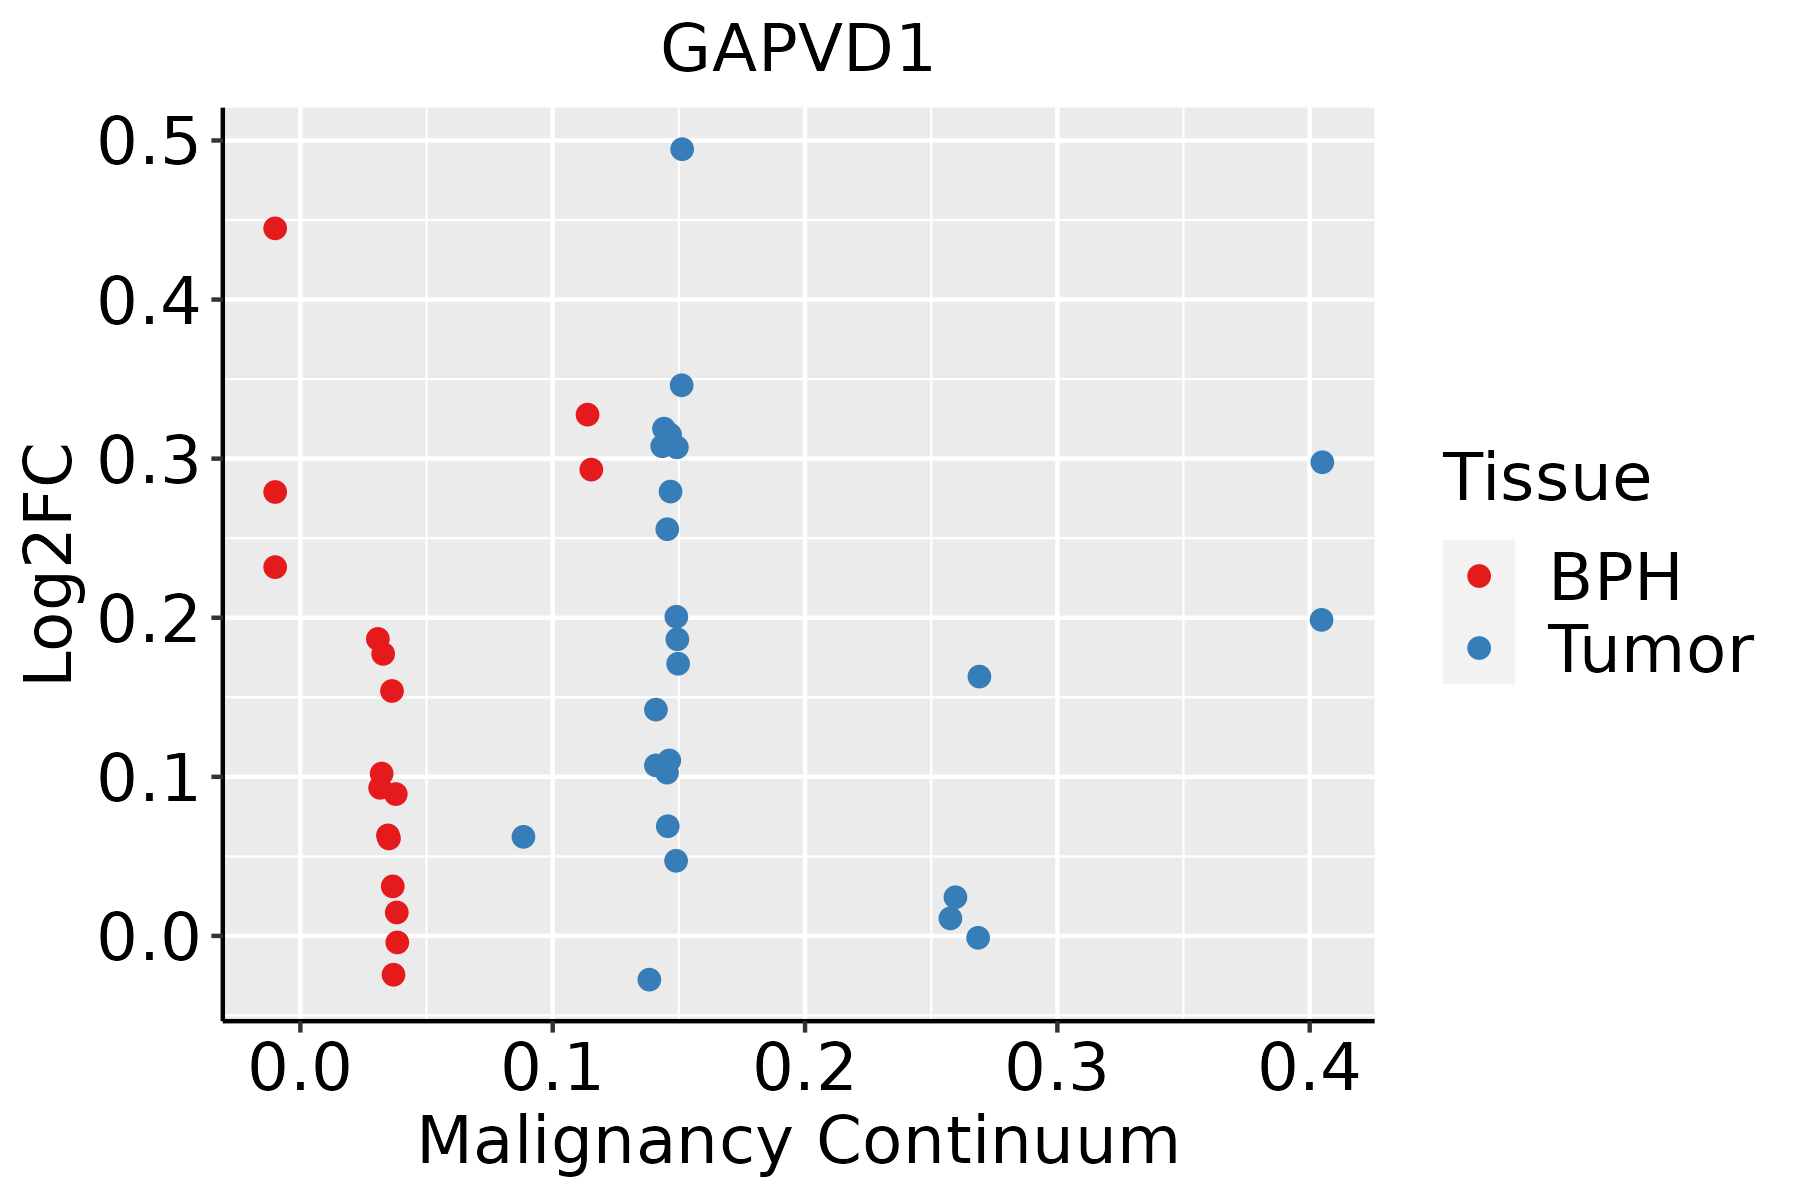 | BPH: Benign Prostatic Hyperplasia |
| Skin |  | AK: Actinic keratosis |
| cSCC: Cutaneous squamous cell carcinoma | ||
| SCCIS:squamous cell carcinoma in situ | ||
| Thyroid | 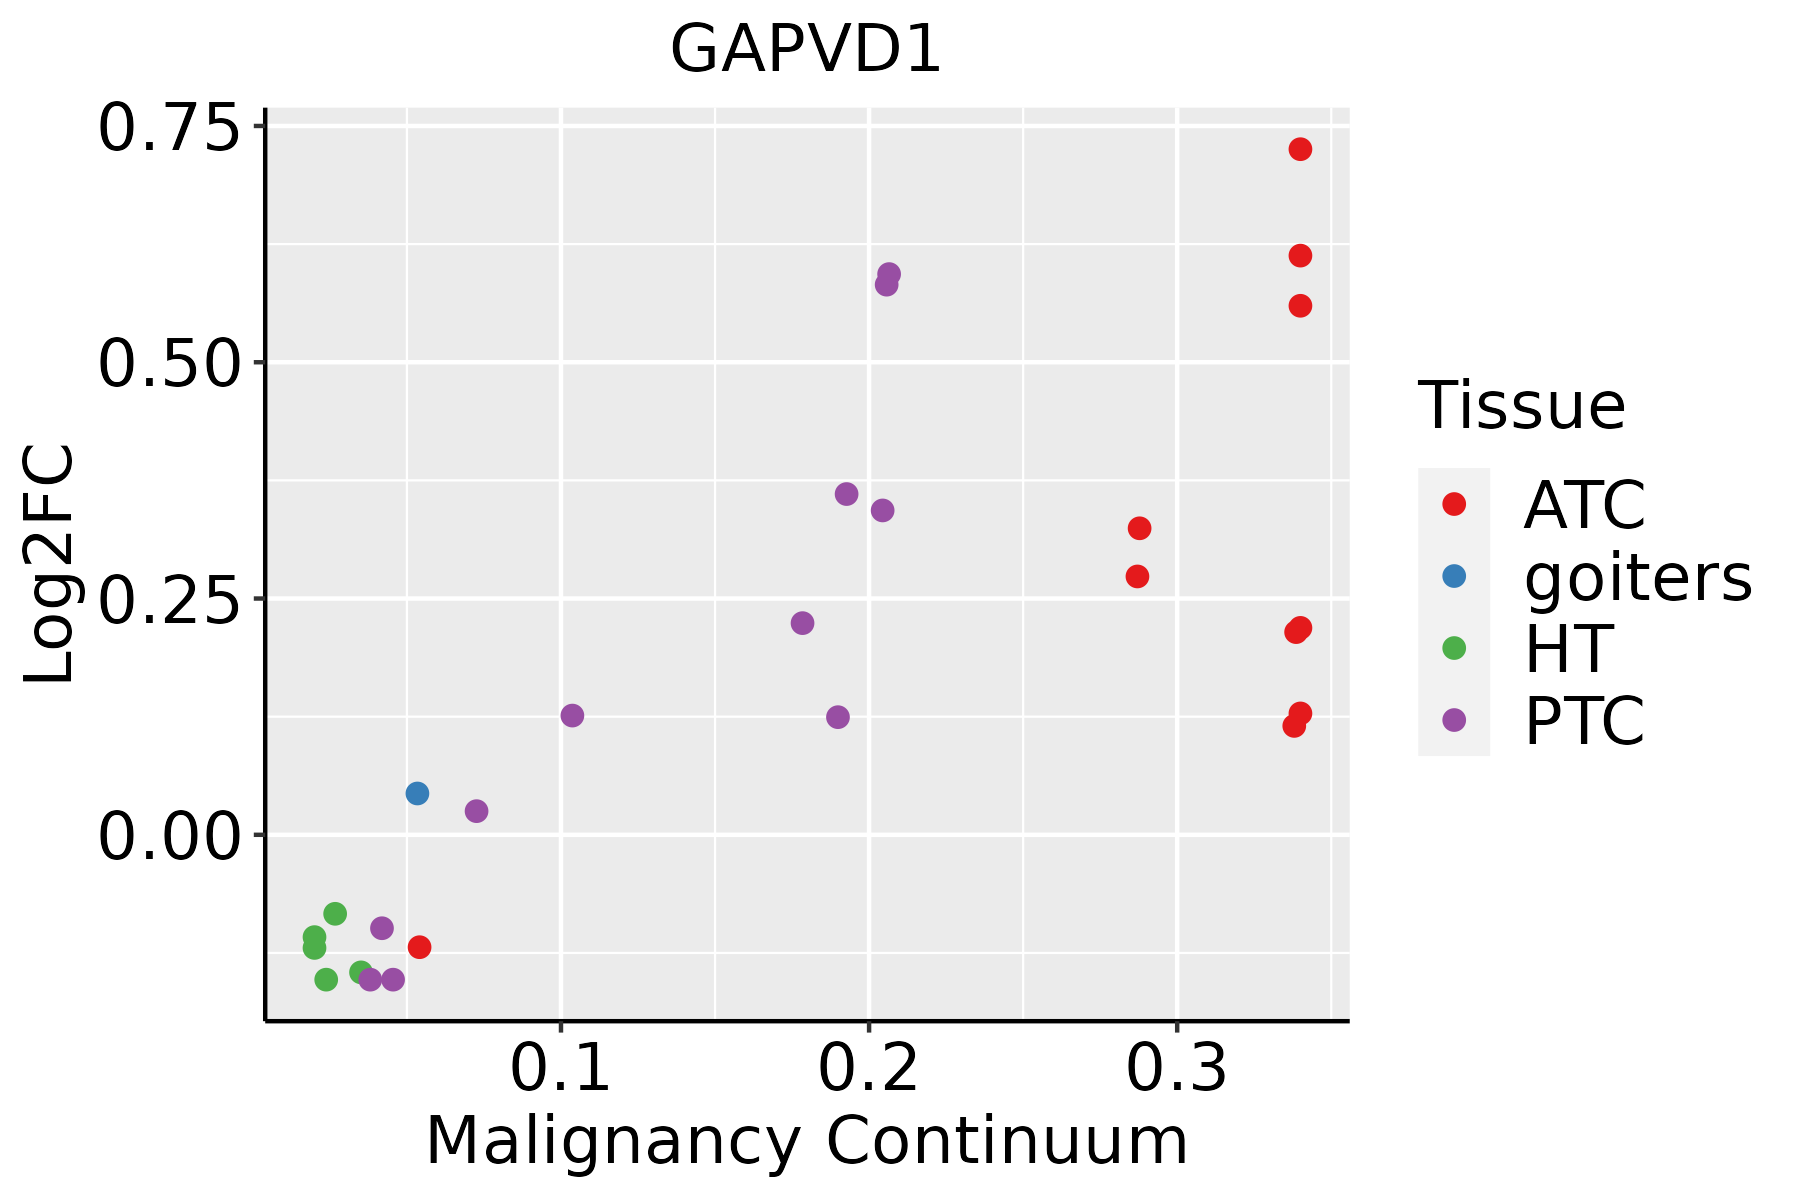 | ATC: Anaplastic thyroid cancer |
| HT: Hashimoto's thyroiditis | ||
| PTC: Papillary thyroid cancer |
| ∗log2FC in expression of this searched gene in stem-like cells from each diseased tissue sample relative to stem-like cells in normal samples in each tissue plotted against the malignancy continuum. Samples are colored based on if they are from different disease stage. |
Top |
Malignant transformation related pathway analysis |
| Find out the enriched GO biological processes and KEGG pathways involved in transition from healthy to precancer to cancer |
| Tissue | Disease Stage | Enriched GO biological Processes |
| Colorectum | AD |  |
| Colorectum | SER |  |
| Colorectum | MSS |  |
| Colorectum | MSI-H |  |
| Colorectum | FAP |  |
| ∗Top 15 enriched GO BP terms are showed in the bar plot of each disease state in each tissue. Each row represents a significant GO biological process which is colored according to the -log10(p.adjust). |
| Page: 1 2 3 4 5 6 7 8 9 |
| GO ID | Tissue | Disease Stage | Description | Gene Ratio | Bg Ratio | pvalue | p.adjust | Count |
| GO:00430877 | Cervix | CC | regulation of GTPase activity | 79/2311 | 348/18723 | 4.21e-08 | 2.60e-06 | 79 |
| GO:00430878 | Endometrium | AEH | regulation of GTPase activity | 66/2100 | 348/18723 | 1.26e-05 | 2.77e-04 | 66 |
| GO:004308712 | Endometrium | EEC | regulation of GTPase activity | 67/2168 | 348/18723 | 1.84e-05 | 3.43e-04 | 67 |
| GO:004308715 | Esophagus | ESCC | regulation of GTPase activity | 183/8552 | 348/18723 | 5.34e-03 | 2.00e-02 | 183 |
| GO:00430875 | Liver | NAFLD | regulation of GTPase activity | 62/1882 | 348/18723 | 5.65e-06 | 2.03e-04 | 62 |
| GO:004308710 | Oral cavity | OSCC | regulation of GTPase activity | 165/7305 | 348/18723 | 7.94e-04 | 4.27e-03 | 165 |
| GO:004308714 | Oral cavity | EOLP | regulation of GTPase activity | 66/2218 | 348/18723 | 6.92e-05 | 8.55e-04 | 66 |
| GO:004308722 | Oral cavity | NEOLP | regulation of GTPase activity | 54/2005 | 348/18723 | 3.36e-03 | 2.00e-02 | 54 |
| GO:00430879 | Prostate | BPH | regulation of GTPase activity | 88/3107 | 348/18723 | 2.04e-05 | 2.49e-04 | 88 |
| GO:004308713 | Prostate | Tumor | regulation of GTPase activity | 88/3246 | 348/18723 | 1.04e-04 | 1.00e-03 | 88 |
| GO:004308716 | Skin | AK | regulation of GTPase activity | 54/1910 | 348/18723 | 1.17e-03 | 8.98e-03 | 54 |
| GO:004308718 | Thyroid | PTC | regulation of GTPase activity | 148/5968 | 348/18723 | 1.63e-05 | 1.71e-04 | 148 |
| GO:004308719 | Thyroid | ATC | regulation of GTPase activity | 153/6293 | 348/18723 | 3.24e-05 | 2.68e-04 | 153 |
| Page: 1 |
| Pathway ID | Tissue | Disease Stage | Description | Gene Ratio | Bg Ratio | pvalue | p.adjust | qvalue | Count |
| Page: 1 |
Top |
Cell-cell communication analysis |
| Identification of potential cell-cell interactions between two cell types and their ligand-receptor pairs for different disease states |
| Ligand | Receptor | LRpair | Pathway | Tissue | Disease Stage |
| Page: 1 |
Top |
Single-cell gene regulatory network inference analysis |
| Find out the significant the regulons (TFs) and the target genes of each regulon across cell types for different disease states |
| TF | Cell Type | Tissue | Disease Stage | Target Gene | RSS | Regulon Activity |
| ∗The dot plots of a searched regulon are shown for all cell subpopulations in each disease state of each tissue based on the regulon specific score inferred using pySCENIC and by calculating the average expression. |
| Page: 1 |
Top |
Somatic mutation of malignant transformation related genes |
| Annotation of somatic variants for genes involved in malignant transformation |
| Hugo Symbol | Variant Class | Variant Classification | dbSNP RS | HGVSc | HGVSp | HGVSp Short | SWISSPROT | BIOTYPE | SIFT | PolyPhen | Tumor Sample Barcode | Tissue | Histology | Sex | Age | Stage | Therapy Types | Drugs | Outcome |
| GAPVD1 | SNV | Missense_Mutation | c.3915G>A | p.Met1305Ile | p.M1305I | Q14C86 | protein_coding | tolerated(0.07) | benign(0.033) | TCGA-A2-A0CP-01 | Breast | breast invasive carcinoma | Female | <65 | I/II | Chemotherapy | cytoxan | SD | |
| GAPVD1 | SNV | Missense_Mutation | novel | c.4141N>C | p.Ala1381Pro | p.A1381P | Q14C86 | protein_coding | deleterious(0.03) | probably_damaging(0.991) | TCGA-AC-A3W5-01 | Breast | breast invasive carcinoma | Female | >=65 | I/II | Chemotherapy | docetaxel | CR |
| GAPVD1 | SNV | Missense_Mutation | novel | c.297N>A | p.Phe99Leu | p.F99L | Q14C86 | protein_coding | tolerated(0.18) | benign(0.006) | TCGA-AN-A046-01 | Breast | breast invasive carcinoma | Female | >=65 | I/II | Unknown | Unknown | SD |
| GAPVD1 | SNV | Missense_Mutation | c.2428N>A | p.Asp810Asn | p.D810N | Q14C86 | protein_coding | tolerated_low_confidence(0.7) | benign(0) | TCGA-AN-A046-01 | Breast | breast invasive carcinoma | Female | >=65 | I/II | Unknown | Unknown | SD | |
| GAPVD1 | SNV | Missense_Mutation | rs763020566 | c.3767N>A | p.Arg1256Gln | p.R1256Q | Q14C86 | protein_coding | tolerated(0.13) | benign(0.116) | TCGA-BH-A1EU-01 | Breast | breast invasive carcinoma | Female | >=65 | I/II | Unknown | Unknown | SD |
| GAPVD1 | SNV | Missense_Mutation | rs368177393 | c.329N>C | p.Ile110Thr | p.I110T | Q14C86 | protein_coding | tolerated(0.09) | benign(0.088) | TCGA-BH-A203-01 | Breast | breast invasive carcinoma | Female | >=65 | I/II | Unknown | Unknown | PD |
| GAPVD1 | SNV | Missense_Mutation | c.3791N>C | p.Arg1264Thr | p.R1264T | Q14C86 | protein_coding | deleterious(0.02) | possibly_damaging(0.694) | TCGA-D8-A1JA-01 | Breast | breast invasive carcinoma | Female | <65 | III/IV | Chemotherapy | adriamycin | PD | |
| GAPVD1 | SNV | Missense_Mutation | c.4360N>T | p.Ile1454Phe | p.I1454F | Q14C86 | protein_coding | deleterious(0) | probably_damaging(0.963) | TCGA-E9-A1NH-01 | Breast | breast invasive carcinoma | Female | >=65 | I/II | Hormone Therapy | tamoxiphen | SD | |
| GAPVD1 | SNV | Missense_Mutation | novel | c.1600N>A | p.Glu534Lys | p.E534K | Q14C86 | protein_coding | tolerated(1) | probably_damaging(0.979) | TCGA-E9-A1R4-01 | Breast | breast invasive carcinoma | Female | >=65 | I/II | Chemotherapy | 5-fluorouracil | SD |
| GAPVD1 | SNV | Missense_Mutation | c.3754G>C | p.Glu1252Gln | p.E1252Q | Q14C86 | protein_coding | tolerated(0.11) | benign(0.362) | TCGA-GM-A2DO-01 | Breast | breast invasive carcinoma | Female | <65 | I/II | Hormone Therapy | tamoxiphen | CR |
| Page: 1 2 3 4 5 6 7 8 9 10 11 12 13 14 15 |
Top |
Related drugs of malignant transformation related genes |
| Identification of chemicals and drugs interact with genes involved in malignant transfromation |
| (DGIdb 4.0) |
| Entrez ID | Symbol | Category | Interaction Types | Drug Claim Name | Drug Name | PMIDs |
| 26130 | GAPVD1 | NA | interferon beta-1a | 27001119 | ||
| 26130 | GAPVD1 | NA | interferon beta-1b | 27001119 |
| Page: 1 |

Copyright 2023-Present -The University of Texas Health Science Center at Houston |