
|
|||||
|
 | |
| |
| |
| |
| |
| |
|
Gene: GANC |
Gene summary for GANC |
| Gene information | Species | Human | Gene symbol | GANC | Gene ID | 2595 |
| Gene name | glucosidase alpha, neutral C | |
| Gene Alias | GANC | |
| Cytomap | 15q15.1 | |
| Gene Type | protein-coding | GO ID | GO:0000023 | UniProtAcc | H3BN99 |
Top |
Malignant transformation analysis |
| Identification of the aberrant gene expression in precancerous and cancerous lesions by comparing the gene expression of stem-like cells in diseased tissues with normal stem cells |
| Entrez ID | Symbol | Replicates | Species | Organ | Tissue | Adj P-value | Log2FC | Malignancy |
| 2595 | GANC | LZE4T | Human | Esophagus | ESCC | 4.15e-07 | 1.21e-01 | 0.0811 |
| 2595 | GANC | LZE8T | Human | Esophagus | ESCC | 1.79e-02 | 6.96e-02 | 0.067 |
| 2595 | GANC | LZE24T | Human | Esophagus | ESCC | 4.12e-06 | 1.47e-01 | 0.0596 |
| 2595 | GANC | P1T-E | Human | Esophagus | ESCC | 1.88e-05 | 3.13e-01 | 0.0875 |
| 2595 | GANC | P2T-E | Human | Esophagus | ESCC | 2.77e-10 | 9.82e-02 | 0.1177 |
| 2595 | GANC | P4T-E | Human | Esophagus | ESCC | 4.32e-04 | 8.44e-02 | 0.1323 |
| 2595 | GANC | P5T-E | Human | Esophagus | ESCC | 1.38e-06 | 1.70e-01 | 0.1327 |
| 2595 | GANC | P8T-E | Human | Esophagus | ESCC | 9.13e-13 | 2.07e-01 | 0.0889 |
| 2595 | GANC | P9T-E | Human | Esophagus | ESCC | 2.13e-08 | 2.75e-01 | 0.1131 |
| 2595 | GANC | P10T-E | Human | Esophagus | ESCC | 2.42e-10 | 1.31e-01 | 0.116 |
| 2595 | GANC | P11T-E | Human | Esophagus | ESCC | 2.94e-02 | 2.00e-01 | 0.1426 |
| 2595 | GANC | P12T-E | Human | Esophagus | ESCC | 1.25e-15 | 2.39e-01 | 0.1122 |
| 2595 | GANC | P15T-E | Human | Esophagus | ESCC | 3.78e-09 | 2.01e-01 | 0.1149 |
| 2595 | GANC | P16T-E | Human | Esophagus | ESCC | 3.01e-09 | 1.82e-01 | 0.1153 |
| 2595 | GANC | P20T-E | Human | Esophagus | ESCC | 2.82e-13 | 1.51e-01 | 0.1124 |
| 2595 | GANC | P21T-E | Human | Esophagus | ESCC | 1.21e-10 | 2.54e-01 | 0.1617 |
| 2595 | GANC | P22T-E | Human | Esophagus | ESCC | 6.33e-08 | 8.87e-02 | 0.1236 |
| 2595 | GANC | P23T-E | Human | Esophagus | ESCC | 1.54e-13 | 2.65e-01 | 0.108 |
| 2595 | GANC | P24T-E | Human | Esophagus | ESCC | 1.86e-02 | 8.44e-02 | 0.1287 |
| 2595 | GANC | P26T-E | Human | Esophagus | ESCC | 1.08e-16 | 1.22e-01 | 0.1276 |
| Page: 1 2 3 4 |
| Tissue | Expression Dynamics | Abbreviation |
| Esophagus |  | ESCC: Esophageal squamous cell carcinoma |
| HGIN: High-grade intraepithelial neoplasias | ||
| LGIN: Low-grade intraepithelial neoplasias | ||
| Lung | 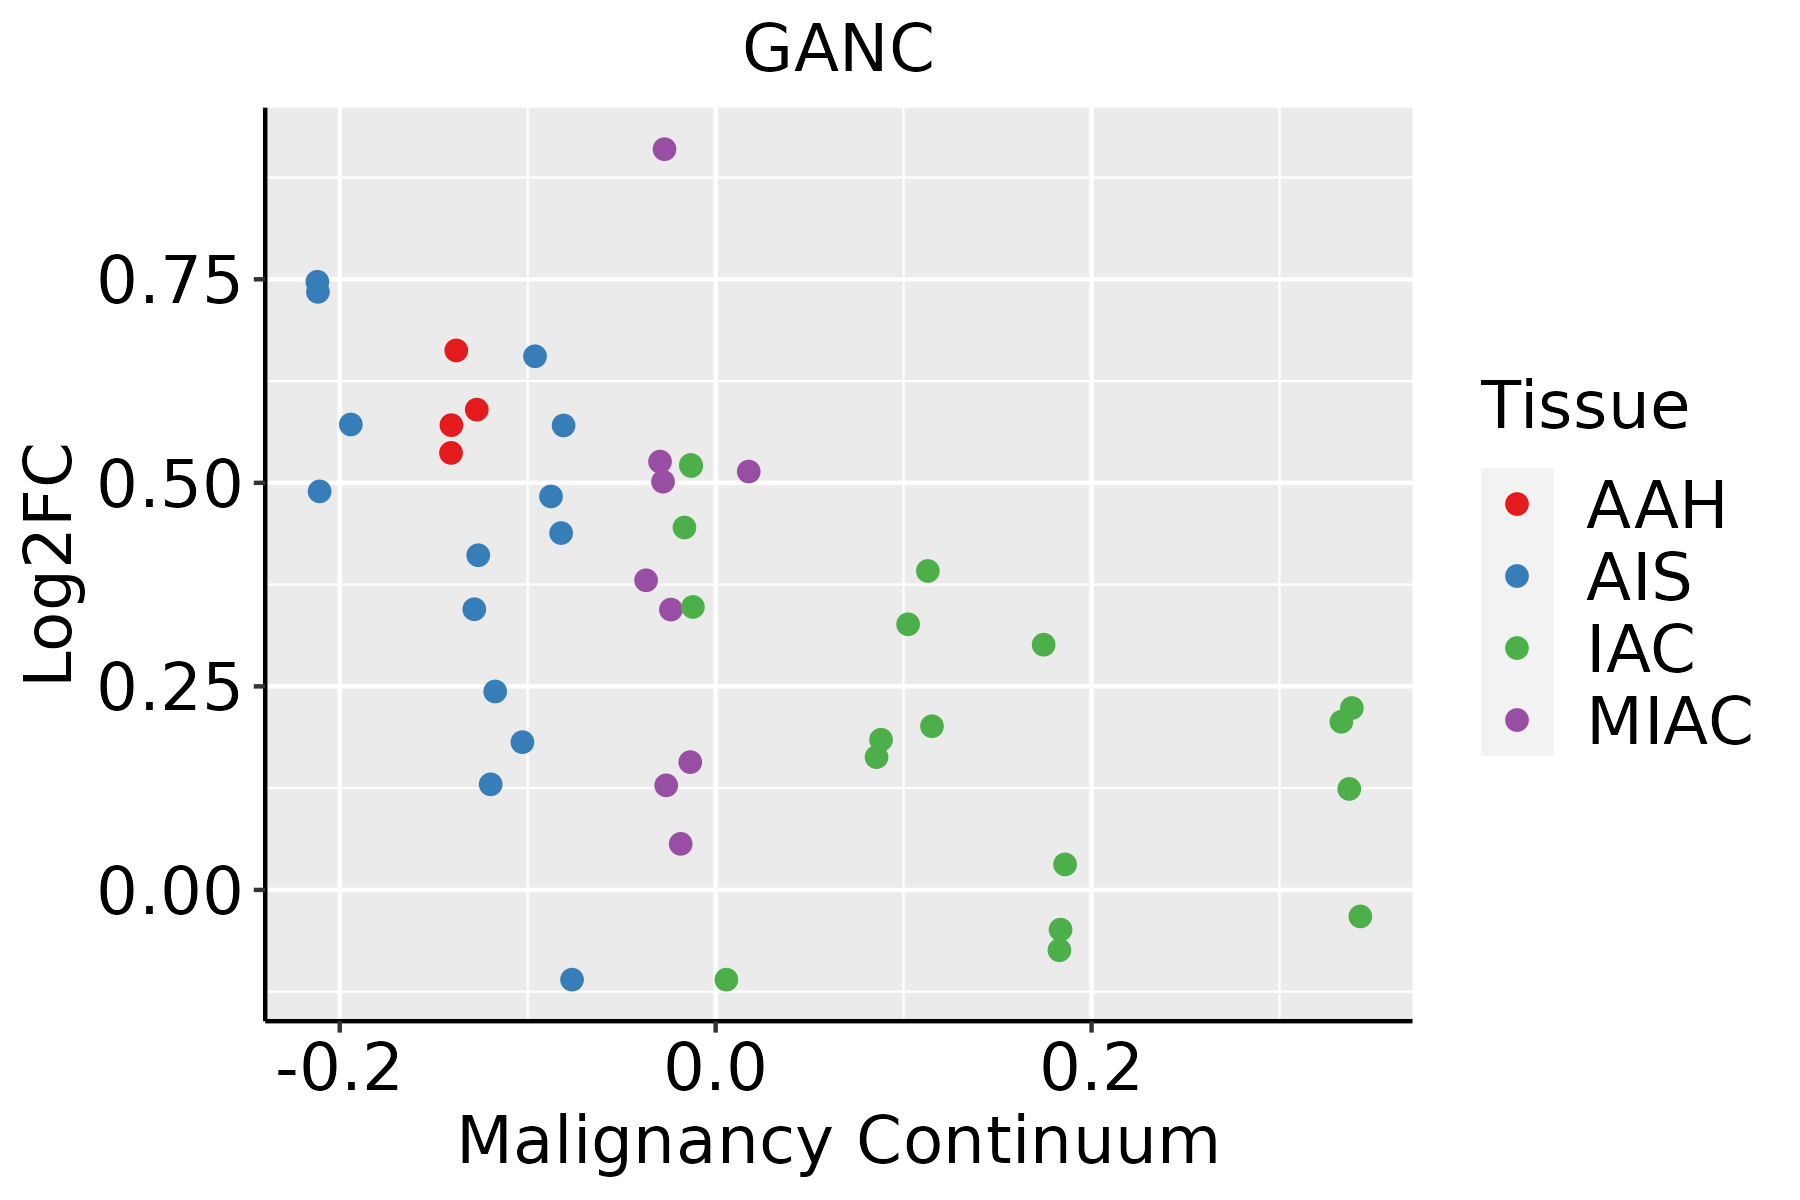 | AAH: Atypical adenomatous hyperplasia |
| AIS: Adenocarcinoma in situ | ||
| IAC: Invasive lung adenocarcinoma | ||
| MIA: Minimally invasive adenocarcinoma | ||
| Oral Cavity | 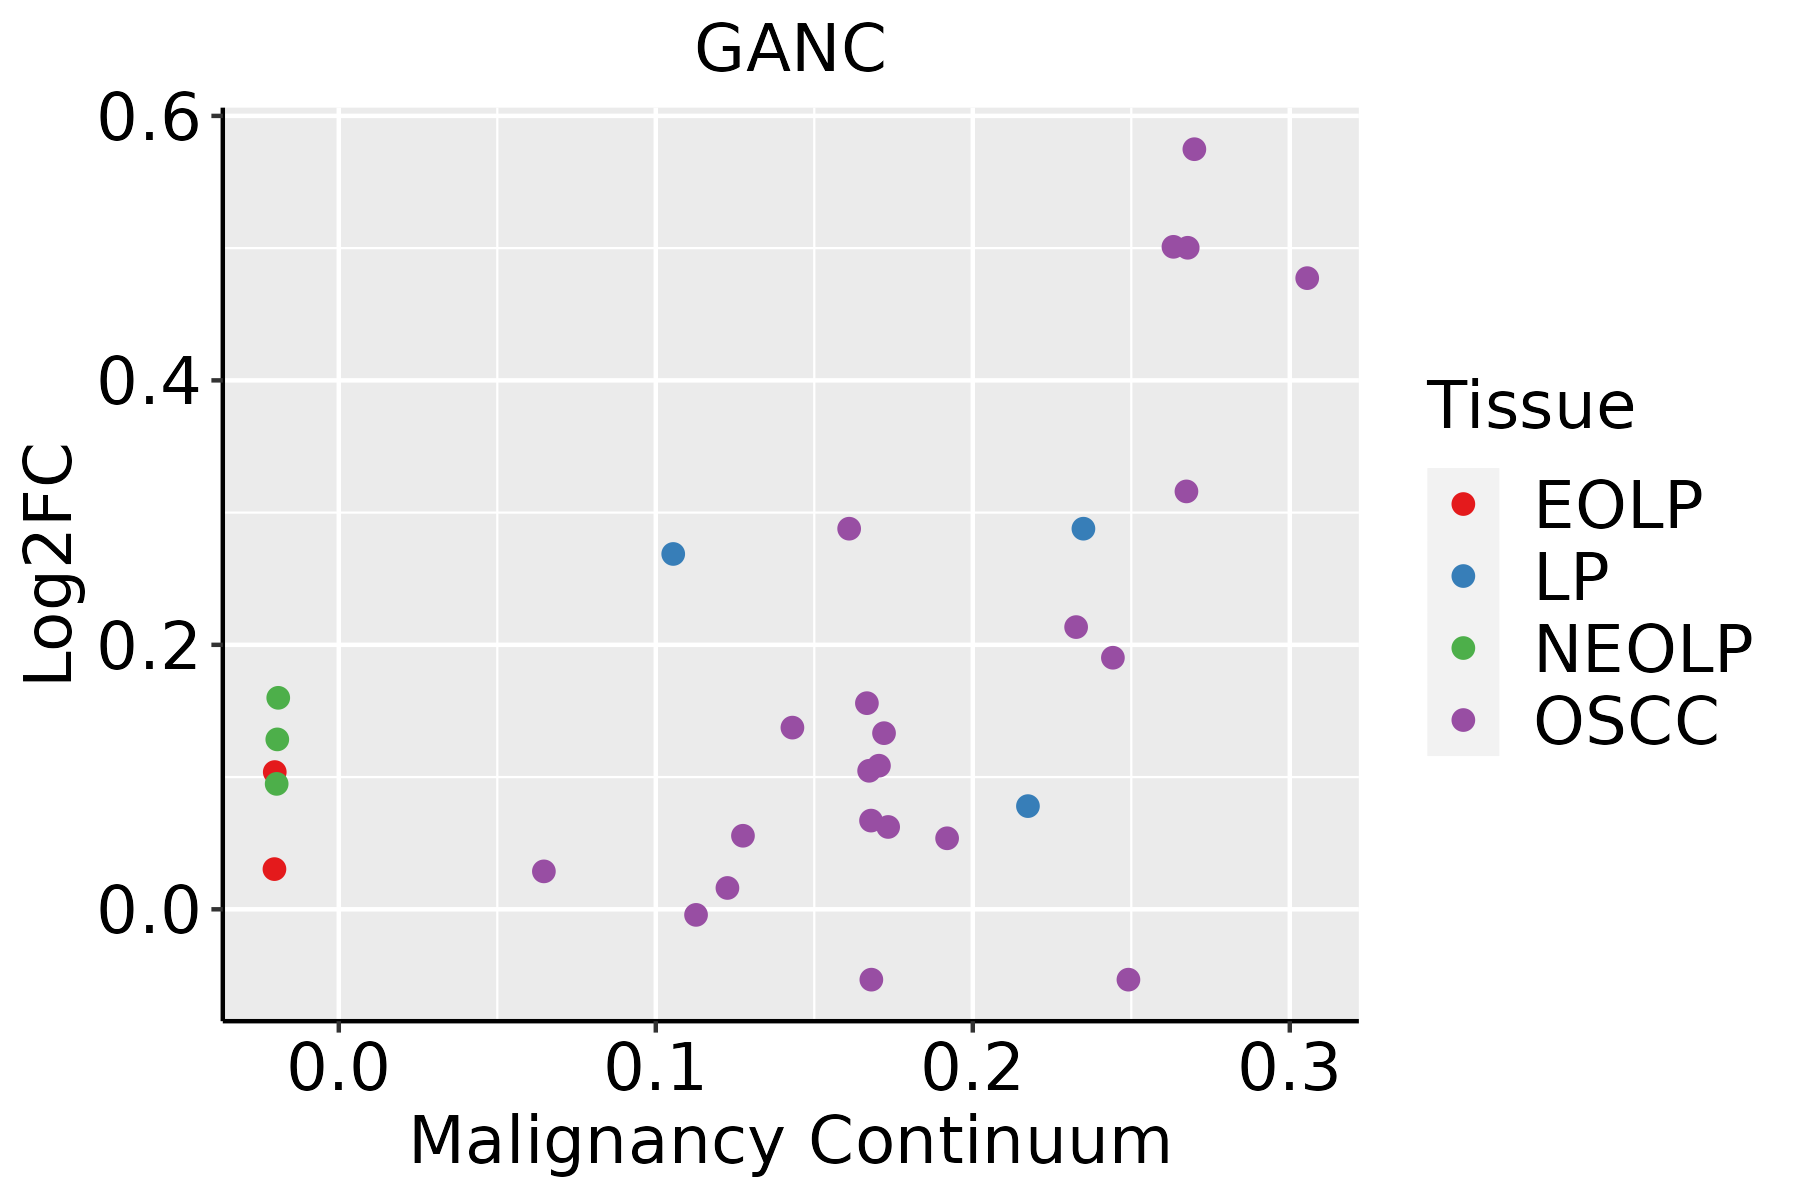 | EOLP: Erosive Oral lichen planus |
| LP: leukoplakia | ||
| NEOLP: Non-erosive oral lichen planus | ||
| OSCC: Oral squamous cell carcinoma |
| ∗log2FC in expression of this searched gene in stem-like cells from each diseased tissue sample relative to stem-like cells in normal samples in each tissue plotted against the malignancy continuum. Samples are colored based on if they are from different disease stage. |
Top |
Malignant transformation related pathway analysis |
| Find out the enriched GO biological processes and KEGG pathways involved in transition from healthy to precancer to cancer |
| Tissue | Disease Stage | Enriched GO biological Processes |
| Colorectum | AD |  |
| Colorectum | SER |  |
| Colorectum | MSS |  |
| Colorectum | MSI-H |  |
| Colorectum | FAP |  |
| ∗Top 15 enriched GO BP terms are showed in the bar plot of each disease state in each tissue. Each row represents a significant GO biological process which is colored according to the -log10(p.adjust). |
| Page: 1 2 3 4 5 6 7 8 9 |
| GO ID | Tissue | Disease Stage | Description | Gene Ratio | Bg Ratio | pvalue | p.adjust | Count |
| GO:00091002 | Esophagus | ESCC | glycoprotein metabolic process | 226/8552 | 387/18723 | 2.64e-07 | 3.94e-06 | 226 |
| GO:00442626 | Esophagus | ESCC | cellular carbohydrate metabolic process | 160/8552 | 283/18723 | 1.43e-04 | 9.66e-04 | 160 |
| GO:00091001 | Oral cavity | OSCC | glycoprotein metabolic process | 185/7305 | 387/18723 | 2.37e-04 | 1.54e-03 | 185 |
| GO:00442625 | Oral cavity | OSCC | cellular carbohydrate metabolic process | 130/7305 | 283/18723 | 9.98e-03 | 3.49e-02 | 130 |
| Page: 1 |
| Pathway ID | Tissue | Disease Stage | Description | Gene Ratio | Bg Ratio | pvalue | p.adjust | qvalue | Count |
| Page: 1 |
Top |
Cell-cell communication analysis |
| Identification of potential cell-cell interactions between two cell types and their ligand-receptor pairs for different disease states |
| Ligand | Receptor | LRpair | Pathway | Tissue | Disease Stage |
| Page: 1 |
Top |
Single-cell gene regulatory network inference analysis |
| Find out the significant the regulons (TFs) and the target genes of each regulon across cell types for different disease states |
| TF | Cell Type | Tissue | Disease Stage | Target Gene | RSS | Regulon Activity |
| ∗The dot plots of a searched regulon are shown for all cell subpopulations in each disease state of each tissue based on the regulon specific score inferred using pySCENIC and by calculating the average expression. |
| Page: 1 |
Top |
Somatic mutation of malignant transformation related genes |
| Annotation of somatic variants for genes involved in malignant transformation |
| Hugo Symbol | Variant Class | Variant Classification | dbSNP RS | HGVSc | HGVSp | HGVSp Short | SWISSPROT | BIOTYPE | SIFT | PolyPhen | Tumor Sample Barcode | Tissue | Histology | Sex | Age | Stage | Therapy Types | Drugs | Outcome |
| GANC | SNV | Missense_Mutation | c.1438N>A | p.Asp480Asn | p.D480N | Q8TET4 | protein_coding | probably_damaging(0.999) | TCGA-A1-A0SQ-01 | Breast | breast invasive carcinoma | Female | <65 | I/II | Chemotherapy | ac | SD | ||
| GANC | SNV | Missense_Mutation | novel | c.949N>G | p.Arg317Gly | p.R317G | Q8TET4 | protein_coding | benign(0) | TCGA-A7-A0CG-01 | Breast | breast invasive carcinoma | Female | >=65 | I/II | Unknown | Unknown | SD | |
| GANC | SNV | Missense_Mutation | c.2536N>T | p.Ala846Ser | p.A846S | Q8TET4 | protein_coding | benign(0.01) | TCGA-E2-A1BC-01 | Breast | breast invasive carcinoma | Female | <65 | I/II | Hormone Therapy | arimidex | SD | ||
| GANC | SNV | Missense_Mutation | novel | c.2229G>T | p.Glu743Asp | p.E743D | Q8TET4 | protein_coding | benign(0.147) | TCGA-UU-A93S-01 | Breast | breast invasive carcinoma | Female | <65 | III/IV | Unknown | Unknown | PD | |
| GANC | SNV | Missense_Mutation | c.1360N>A | p.Asp454Asn | p.D454N | Q8TET4 | protein_coding | benign(0.014) | TCGA-2W-A8YY-01 | Cervix | cervical & endocervical cancer | Female | <65 | I/II | Chemotherapy | cisplatin | CR | ||
| GANC | SNV | Missense_Mutation | c.1846G>C | p.Asp616His | p.D616H | Q8TET4 | protein_coding | probably_damaging(1) | TCGA-Q1-A73O-01 | Cervix | cervical & endocervical cancer | Female | <65 | I/II | Chemotherapy | cisplatin | CR | ||
| GANC | SNV | Missense_Mutation | novel | c.2615N>G | p.Ser872Cys | p.S872C | Q8TET4 | protein_coding | benign(0.113) | TCGA-UC-A7PG-06 | Cervix | cervical & endocervical cancer | Female | <65 | III/IV | Chemotherapy | cisplatin | PD | |
| GANC | SNV | Missense_Mutation | c.2594N>A | p.Gly865Asp | p.G865D | Q8TET4 | protein_coding | probably_damaging(0.995) | TCGA-AA-3506-01 | Colorectum | colon adenocarcinoma | Male | >=65 | I/II | Unknown | Unknown | SD | ||
| GANC | SNV | Missense_Mutation | rs368575859 | c.1288C>T | p.Arg430Cys | p.R430C | Q8TET4 | protein_coding | probably_damaging(1) | TCGA-AA-3864-01 | Colorectum | colon adenocarcinoma | Male | >=65 | I/II | Unknown | Unknown | SD | |
| GANC | SNV | Missense_Mutation | c.1484N>T | p.Ala495Val | p.A495V | Q8TET4 | protein_coding | benign(0.281) | TCGA-AA-A00N-01 | Colorectum | colon adenocarcinoma | Male | >=65 | I/II | Unknown | Unknown | PD |
| Page: 1 2 3 4 5 6 7 8 |
Top |
Related drugs of malignant transformation related genes |
| Identification of chemicals and drugs interact with genes involved in malignant transfromation |
| (DGIdb 4.0) |
| Entrez ID | Symbol | Category | Interaction Types | Drug Claim Name | Drug Name | PMIDs |
| Page: 1 |

Copyright 2023-Present -The University of Texas Health Science Center at Houston |