
|
|||||
|
 | |
| |
| |
| |
| |
| |
|
Gene: GANAB |
Gene summary for GANAB |
| Gene information | Species | Human | Gene symbol | GANAB | Gene ID | 23193 |
| Gene name | glucosidase II alpha subunit | |
| Gene Alias | G2AN | |
| Cytomap | 11q12.3 | |
| Gene Type | protein-coding | GO ID | GO:0005975 | UniProtAcc | B4DZ53 |
Top |
Malignant transformation analysis |
| Identification of the aberrant gene expression in precancerous and cancerous lesions by comparing the gene expression of stem-like cells in diseased tissues with normal stem cells |
| Entrez ID | Symbol | Replicates | Species | Organ | Tissue | Adj P-value | Log2FC | Malignancy |
| 23193 | GANAB | HTA11_3410_2000001011 | Human | Colorectum | AD | 1.39e-16 | 4.70e-01 | 0.0155 |
| 23193 | GANAB | HTA11_2487_2000001011 | Human | Colorectum | SER | 1.00e-24 | 7.78e-01 | -0.1808 |
| 23193 | GANAB | HTA11_2951_2000001011 | Human | Colorectum | AD | 8.35e-07 | 7.20e-01 | 0.0216 |
| 23193 | GANAB | HTA11_1938_2000001011 | Human | Colorectum | AD | 4.64e-13 | 7.89e-01 | -0.0811 |
| 23193 | GANAB | HTA11_78_2000001011 | Human | Colorectum | AD | 3.47e-08 | 4.60e-01 | -0.1088 |
| 23193 | GANAB | HTA11_347_2000001011 | Human | Colorectum | AD | 2.53e-38 | 9.22e-01 | -0.1954 |
| 23193 | GANAB | HTA11_411_2000001011 | Human | Colorectum | SER | 1.47e-08 | 8.77e-01 | -0.2602 |
| 23193 | GANAB | HTA11_2112_2000001011 | Human | Colorectum | SER | 5.52e-04 | 8.09e-01 | -0.2196 |
| 23193 | GANAB | HTA11_3361_2000001011 | Human | Colorectum | AD | 1.54e-09 | 6.32e-01 | -0.1207 |
| 23193 | GANAB | HTA11_83_2000001011 | Human | Colorectum | SER | 7.79e-18 | 7.85e-01 | -0.1526 |
| 23193 | GANAB | HTA11_696_2000001011 | Human | Colorectum | AD | 1.16e-36 | 9.63e-01 | -0.1464 |
| 23193 | GANAB | HTA11_866_2000001011 | Human | Colorectum | AD | 1.00e-15 | 5.94e-01 | -0.1001 |
| 23193 | GANAB | HTA11_1391_2000001011 | Human | Colorectum | AD | 1.04e-36 | 1.18e+00 | -0.059 |
| 23193 | GANAB | HTA11_2992_2000001011 | Human | Colorectum | SER | 9.11e-05 | 6.88e-01 | -0.1706 |
| 23193 | GANAB | HTA11_5212_2000001011 | Human | Colorectum | AD | 4.39e-03 | 4.11e-01 | -0.2061 |
| 23193 | GANAB | HTA11_5216_2000001011 | Human | Colorectum | SER | 2.44e-04 | 6.64e-01 | -0.1462 |
| 23193 | GANAB | HTA11_546_2000001011 | Human | Colorectum | AD | 5.12e-14 | 7.45e-01 | -0.0842 |
| 23193 | GANAB | HTA11_9341_2000001011 | Human | Colorectum | SER | 4.50e-02 | 7.12e-01 | -0.00410000000000005 |
| 23193 | GANAB | HTA11_7862_2000001011 | Human | Colorectum | AD | 7.37e-11 | 7.43e-01 | -0.0179 |
| 23193 | GANAB | HTA11_866_3004761011 | Human | Colorectum | AD | 3.66e-44 | 1.07e+00 | 0.096 |
| Page: 1 2 3 4 5 6 7 8 |
| Tissue | Expression Dynamics | Abbreviation |
| Colorectum (GSE201348) |  | FAP: Familial adenomatous polyposis |
| CRC: Colorectal cancer | ||
| Colorectum (HTA11) |  | AD: Adenomas |
| SER: Sessile serrated lesions | ||
| MSI-H: Microsatellite-high colorectal cancer | ||
| MSS: Microsatellite stable colorectal cancer | ||
| Esophagus | 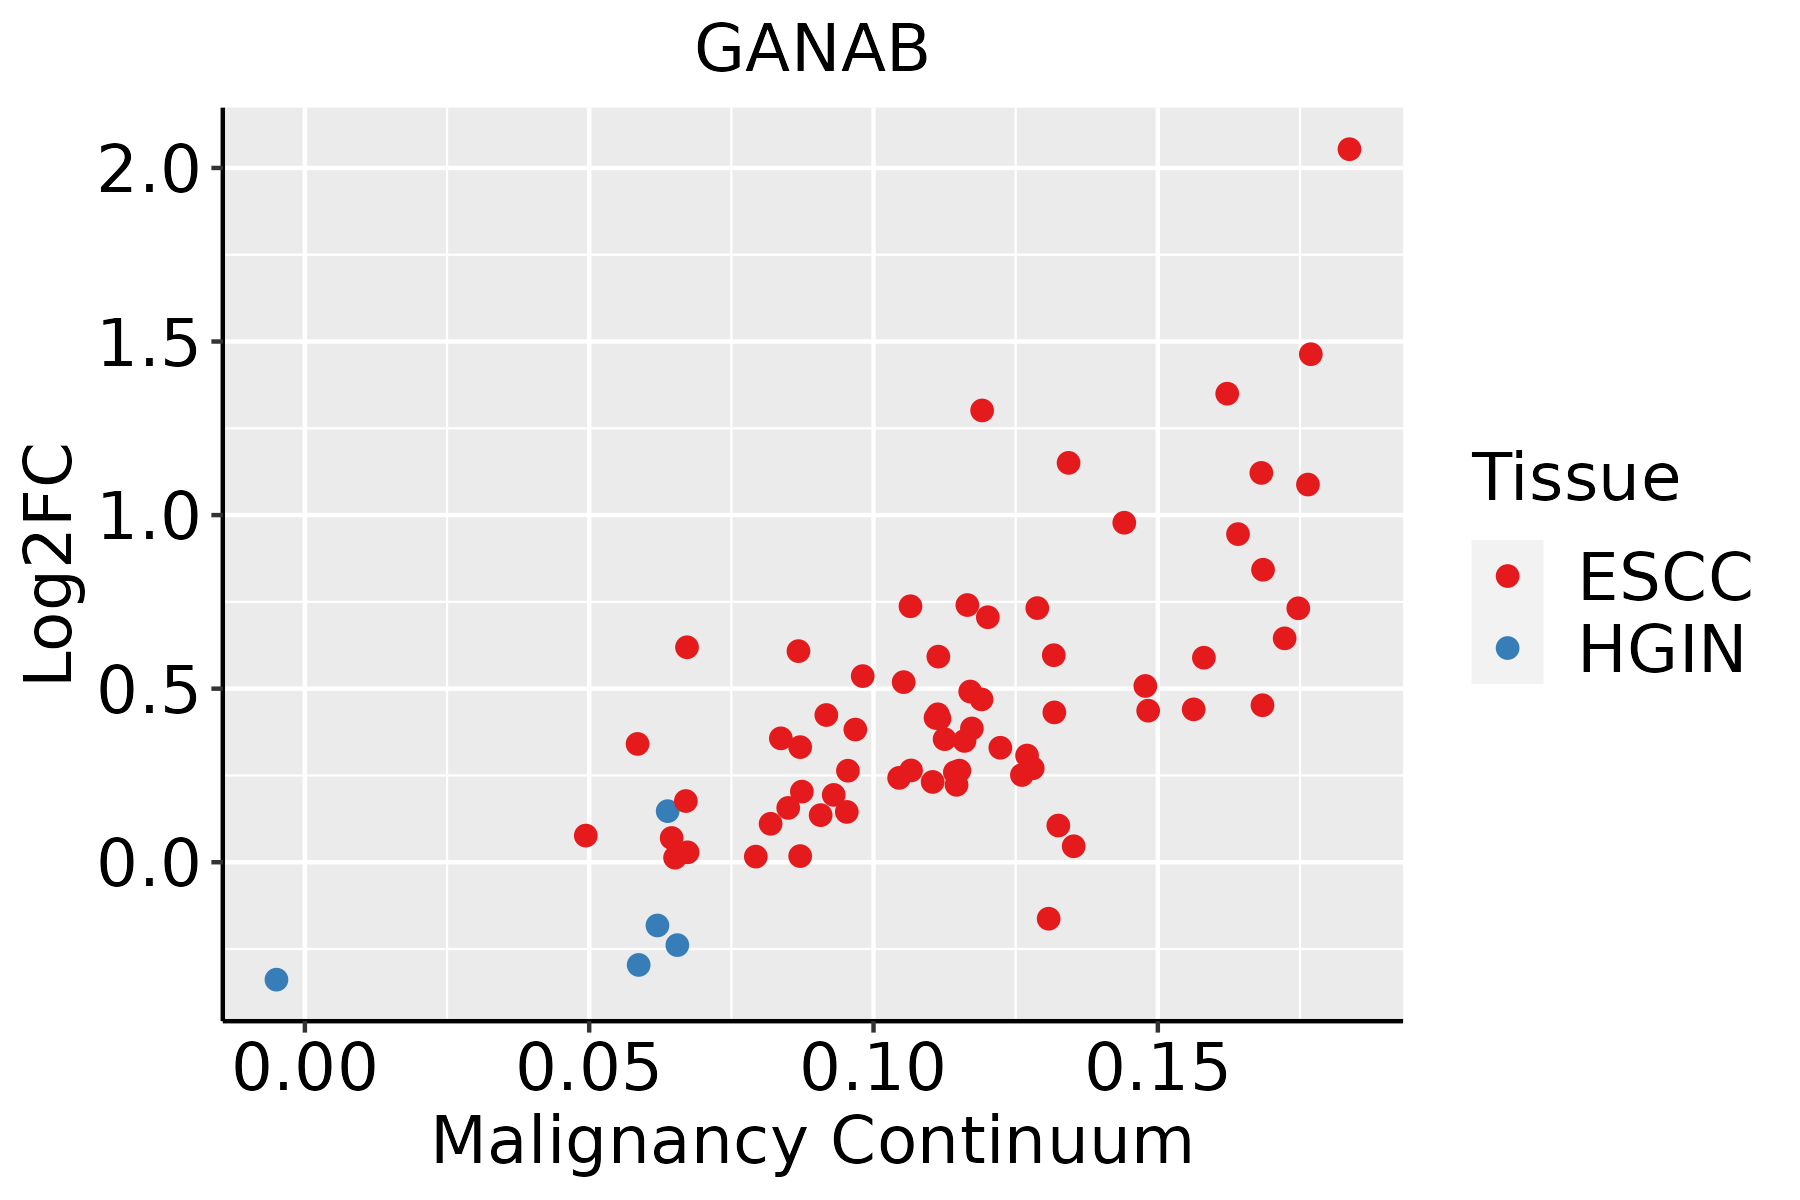 | ESCC: Esophageal squamous cell carcinoma |
| HGIN: High-grade intraepithelial neoplasias | ||
| LGIN: Low-grade intraepithelial neoplasias | ||
| Liver | 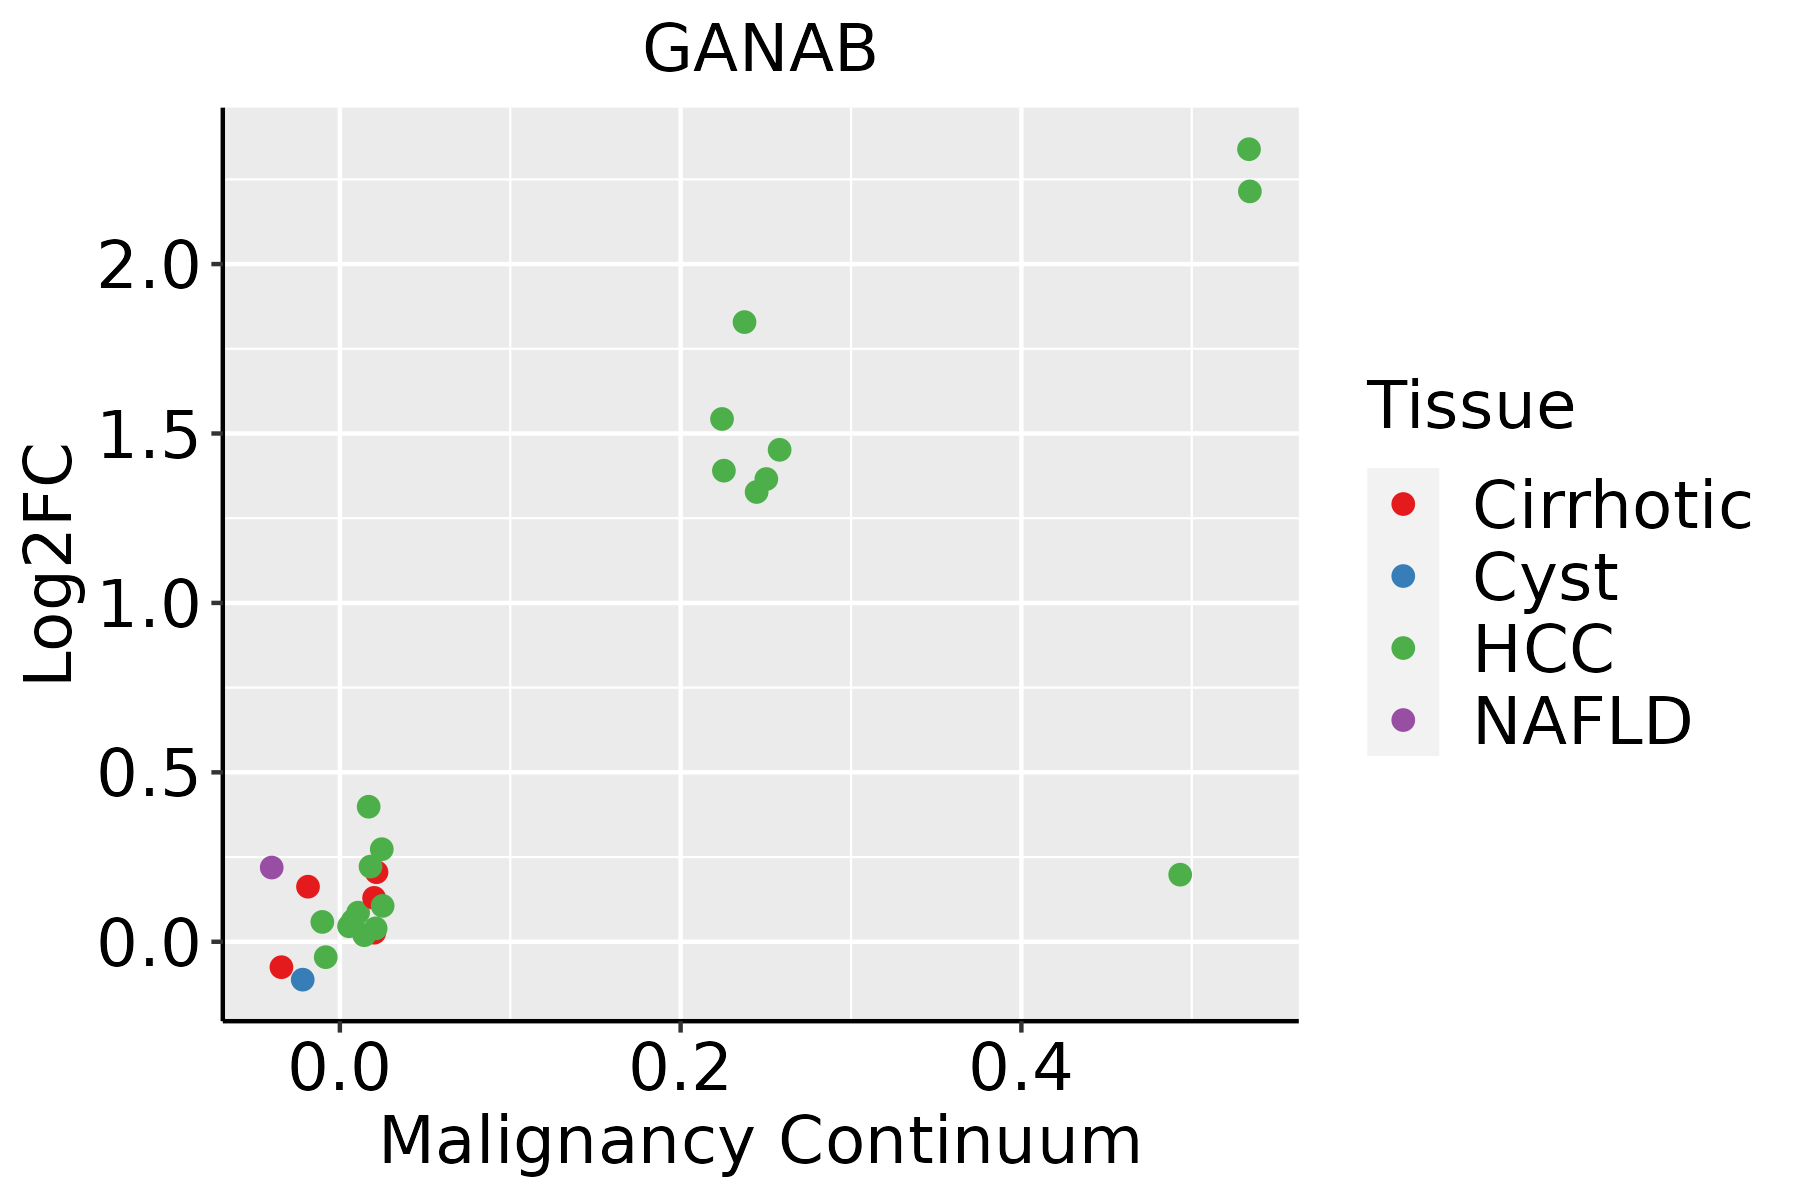 | HCC: Hepatocellular carcinoma |
| NAFLD: Non-alcoholic fatty liver disease | ||
| Oral Cavity | 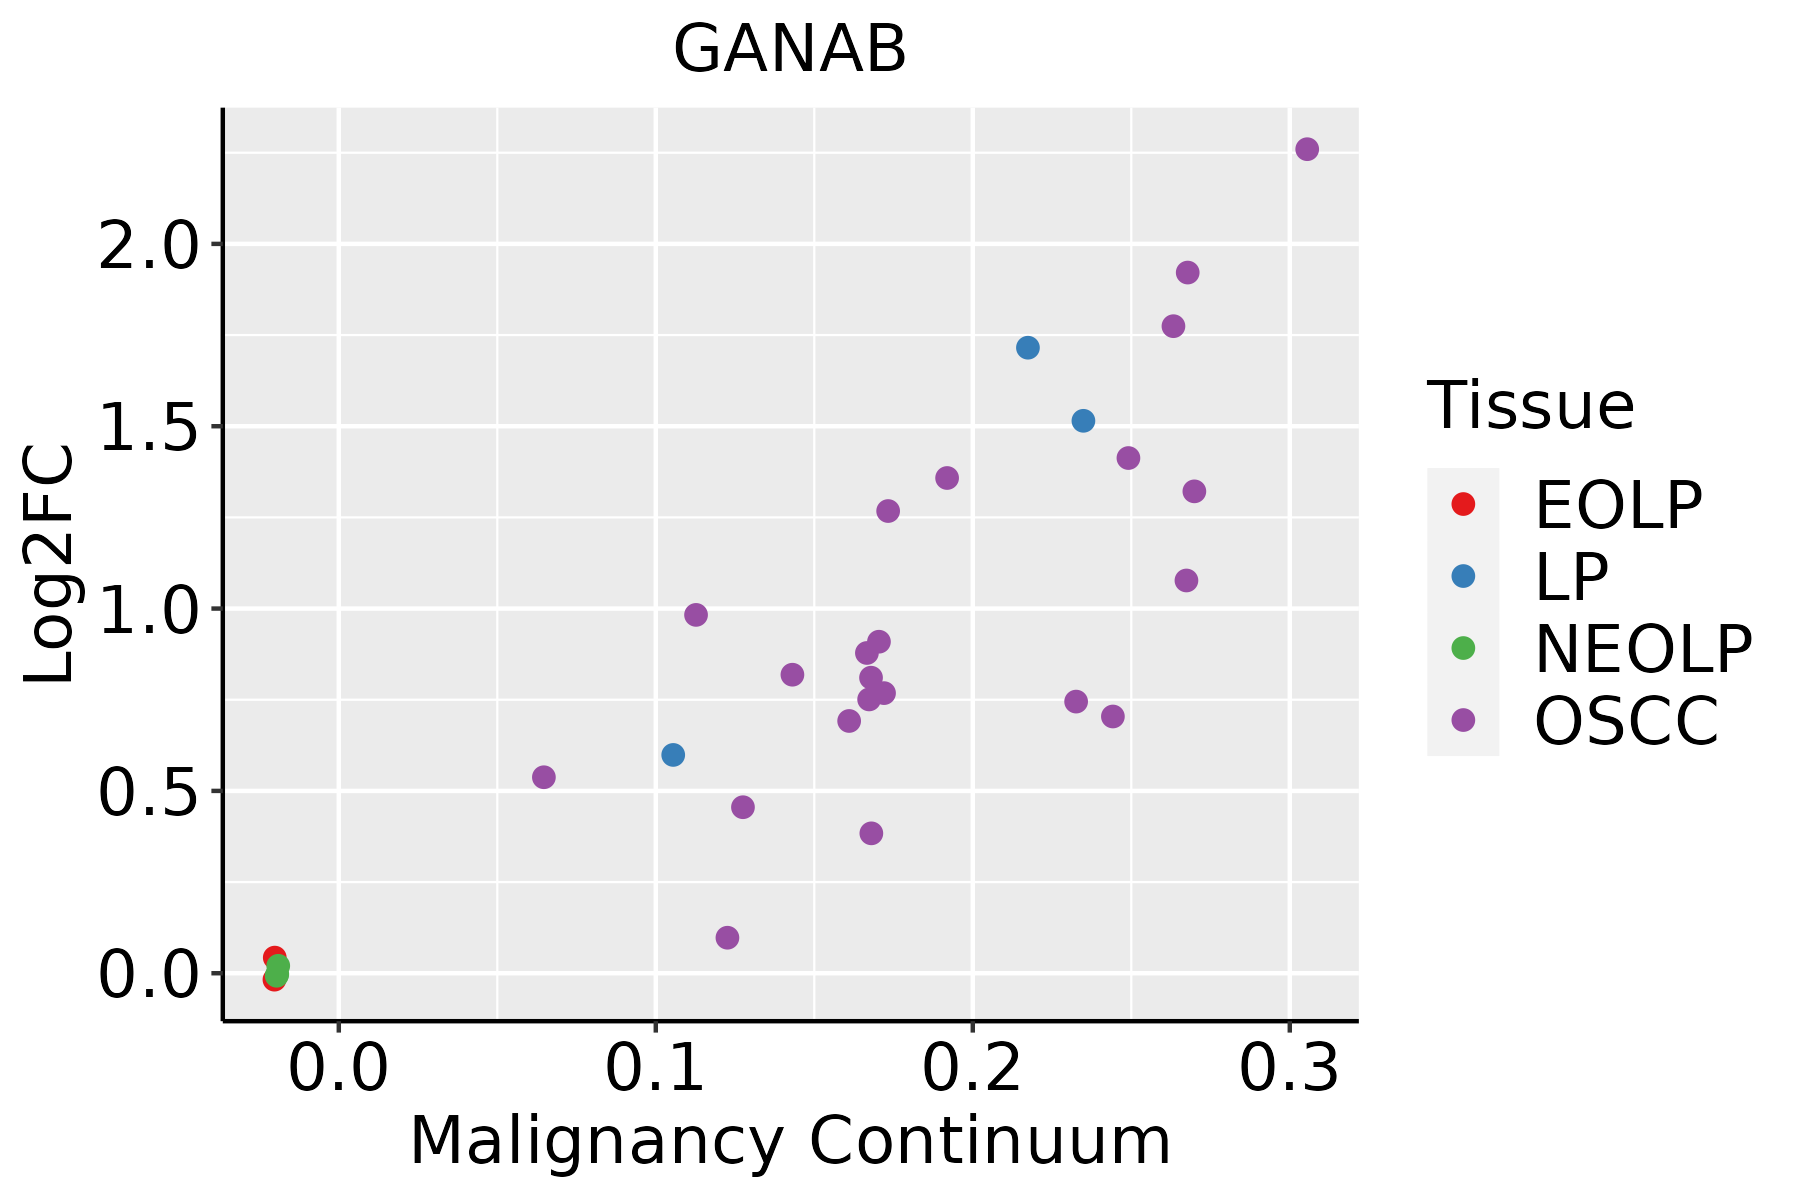 | EOLP: Erosive Oral lichen planus |
| LP: leukoplakia | ||
| NEOLP: Non-erosive oral lichen planus | ||
| OSCC: Oral squamous cell carcinoma | ||
| Skin | 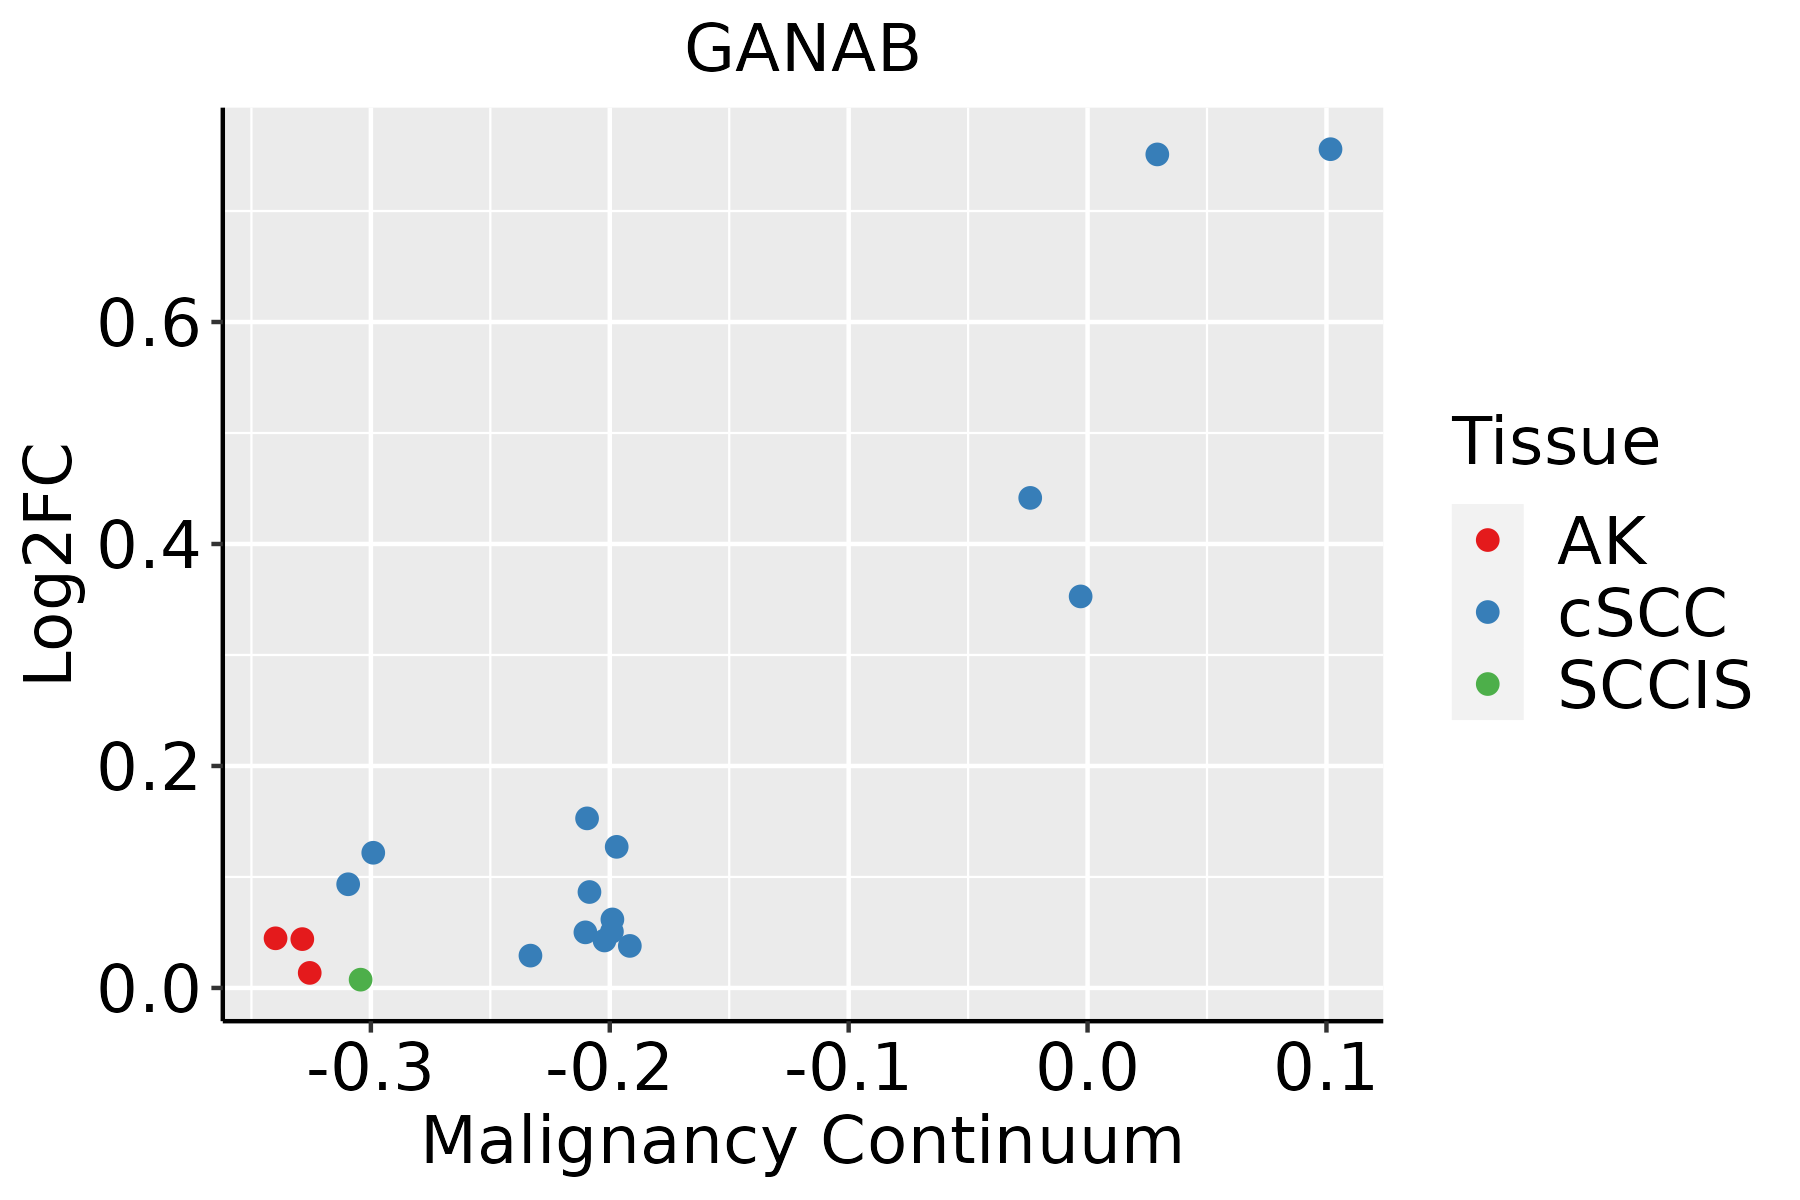 | AK: Actinic keratosis |
| cSCC: Cutaneous squamous cell carcinoma | ||
| SCCIS:squamous cell carcinoma in situ | ||
| Thyroid | 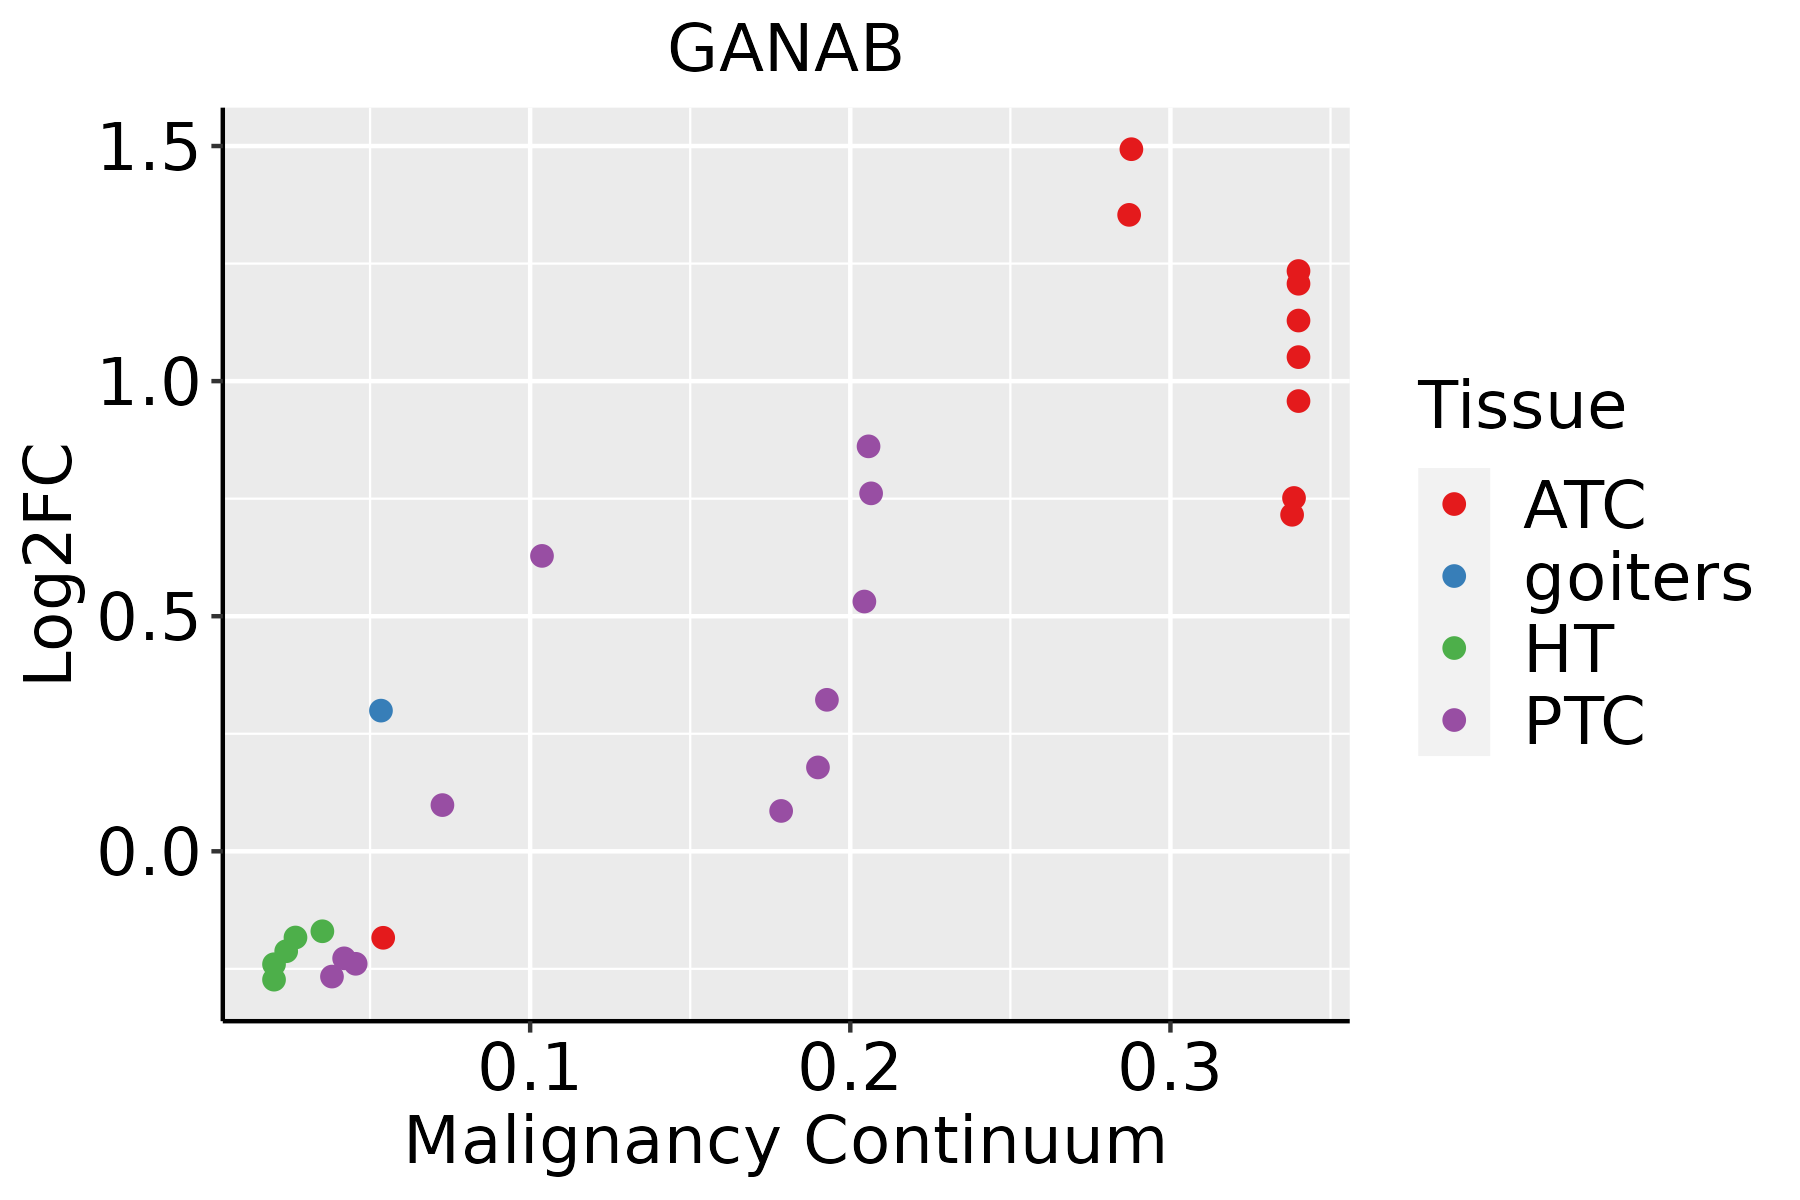 | ATC: Anaplastic thyroid cancer |
| HT: Hashimoto's thyroiditis | ||
| PTC: Papillary thyroid cancer |
| ∗log2FC in expression of this searched gene in stem-like cells from each diseased tissue sample relative to stem-like cells in normal samples in each tissue plotted against the malignancy continuum. Samples are colored based on if they are from different disease stage. |
Top |
Malignant transformation related pathway analysis |
| Find out the enriched GO biological processes and KEGG pathways involved in transition from healthy to precancer to cancer |
| Tissue | Disease Stage | Enriched GO biological Processes |
| Colorectum | AD |  |
| Colorectum | SER |  |
| Colorectum | MSS |  |
| Colorectum | MSI-H |  |
| Colorectum | FAP |  |
| ∗Top 15 enriched GO BP terms are showed in the bar plot of each disease state in each tissue. Each row represents a significant GO biological process which is colored according to the -log10(p.adjust). |
| Page: 1 2 3 4 5 6 7 8 9 |
| GO ID | Tissue | Disease Stage | Description | Gene Ratio | Bg Ratio | pvalue | p.adjust | Count |
| GO:00091002 | Esophagus | ESCC | glycoprotein metabolic process | 226/8552 | 387/18723 | 2.64e-07 | 3.94e-06 | 226 |
| GO:0009100 | Liver | HCC | glycoprotein metabolic process | 193/7958 | 387/18723 | 1.89e-03 | 9.62e-03 | 193 |
| GO:00091001 | Oral cavity | OSCC | glycoprotein metabolic process | 185/7305 | 387/18723 | 2.37e-04 | 1.54e-03 | 185 |
| GO:00091003 | Thyroid | PTC | glycoprotein metabolic process | 147/5968 | 387/18723 | 5.87e-03 | 2.64e-02 | 147 |
| GO:000910011 | Thyroid | ATC | glycoprotein metabolic process | 153/6293 | 387/18723 | 7.90e-03 | 3.06e-02 | 153 |
| Page: 1 |
| Pathway ID | Tissue | Disease Stage | Description | Gene Ratio | Bg Ratio | pvalue | p.adjust | qvalue | Count |
| hsa04141 | Colorectum | AD | Protein processing in endoplasmic reticulum | 80/2092 | 174/8465 | 5.96e-10 | 1.25e-08 | 7.96e-09 | 80 |
| hsa00510 | Colorectum | AD | N-Glycan biosynthesis | 21/2092 | 53/8465 | 1.15e-02 | 4.24e-02 | 2.71e-02 | 21 |
| hsa041411 | Colorectum | AD | Protein processing in endoplasmic reticulum | 80/2092 | 174/8465 | 5.96e-10 | 1.25e-08 | 7.96e-09 | 80 |
| hsa005101 | Colorectum | AD | N-Glycan biosynthesis | 21/2092 | 53/8465 | 1.15e-02 | 4.24e-02 | 2.71e-02 | 21 |
| hsa041412 | Colorectum | SER | Protein processing in endoplasmic reticulum | 60/1580 | 174/8465 | 4.20e-07 | 7.33e-06 | 5.32e-06 | 60 |
| hsa041413 | Colorectum | SER | Protein processing in endoplasmic reticulum | 60/1580 | 174/8465 | 4.20e-07 | 7.33e-06 | 5.32e-06 | 60 |
| hsa041414 | Colorectum | MSS | Protein processing in endoplasmic reticulum | 75/1875 | 174/8465 | 3.78e-10 | 8.44e-09 | 5.17e-09 | 75 |
| hsa005102 | Colorectum | MSS | N-Glycan biosynthesis | 20/1875 | 53/8465 | 7.17e-03 | 2.83e-02 | 1.73e-02 | 20 |
| hsa041415 | Colorectum | MSS | Protein processing in endoplasmic reticulum | 75/1875 | 174/8465 | 3.78e-10 | 8.44e-09 | 5.17e-09 | 75 |
| hsa005103 | Colorectum | MSS | N-Glycan biosynthesis | 20/1875 | 53/8465 | 7.17e-03 | 2.83e-02 | 1.73e-02 | 20 |
| hsa041418 | Colorectum | FAP | Protein processing in endoplasmic reticulum | 50/1404 | 174/8465 | 3.64e-05 | 3.68e-04 | 2.24e-04 | 50 |
| hsa041419 | Colorectum | FAP | Protein processing in endoplasmic reticulum | 50/1404 | 174/8465 | 3.64e-05 | 3.68e-04 | 2.24e-04 | 50 |
| hsa04141211 | Esophagus | ESCC | Protein processing in endoplasmic reticulum | 147/4205 | 174/8465 | 3.29e-22 | 1.10e-19 | 5.64e-20 | 147 |
| hsa0051023 | Esophagus | ESCC | N-Glycan biosynthesis | 39/4205 | 53/8465 | 3.26e-04 | 1.15e-03 | 5.89e-04 | 39 |
| hsa04141310 | Esophagus | ESCC | Protein processing in endoplasmic reticulum | 147/4205 | 174/8465 | 3.29e-22 | 1.10e-19 | 5.64e-20 | 147 |
| hsa0051033 | Esophagus | ESCC | N-Glycan biosynthesis | 39/4205 | 53/8465 | 3.26e-04 | 1.15e-03 | 5.89e-04 | 39 |
| hsa0414114 | Liver | Cirrhotic | Protein processing in endoplasmic reticulum | 114/2530 | 174/8465 | 1.16e-22 | 9.67e-21 | 5.96e-21 | 114 |
| hsa005104 | Liver | Cirrhotic | N-Glycan biosynthesis | 32/2530 | 53/8465 | 3.82e-06 | 4.10e-05 | 2.53e-05 | 32 |
| hsa0414115 | Liver | Cirrhotic | Protein processing in endoplasmic reticulum | 114/2530 | 174/8465 | 1.16e-22 | 9.67e-21 | 5.96e-21 | 114 |
| hsa0051011 | Liver | Cirrhotic | N-Glycan biosynthesis | 32/2530 | 53/8465 | 3.82e-06 | 4.10e-05 | 2.53e-05 | 32 |
| Page: 1 2 |
Top |
Cell-cell communication analysis |
| Identification of potential cell-cell interactions between two cell types and their ligand-receptor pairs for different disease states |
| Ligand | Receptor | LRpair | Pathway | Tissue | Disease Stage |
| Page: 1 |
Top |
Single-cell gene regulatory network inference analysis |
| Find out the significant the regulons (TFs) and the target genes of each regulon across cell types for different disease states |
| TF | Cell Type | Tissue | Disease Stage | Target Gene | RSS | Regulon Activity |
| ∗The dot plots of a searched regulon are shown for all cell subpopulations in each disease state of each tissue based on the regulon specific score inferred using pySCENIC and by calculating the average expression. |
| Page: 1 |
Top |
Somatic mutation of malignant transformation related genes |
| Annotation of somatic variants for genes involved in malignant transformation |
| Hugo Symbol | Variant Class | Variant Classification | dbSNP RS | HGVSc | HGVSp | HGVSp Short | SWISSPROT | BIOTYPE | SIFT | PolyPhen | Tumor Sample Barcode | Tissue | Histology | Sex | Age | Stage | Therapy Types | Drugs | Outcome |
| GANAB | SNV | Missense_Mutation | c.2326G>C | p.Val776Leu | p.V776L | Q14697 | protein_coding | deleterious(0) | benign(0.407) | TCGA-AC-A23H-01 | Breast | breast invasive carcinoma | Female | >=65 | I/II | Unknown | Unknown | PD | |
| GANAB | SNV | Missense_Mutation | c.388N>T | p.Val130Phe | p.V130F | Q14697 | protein_coding | tolerated(0.1) | benign(0.03) | TCGA-AR-A256-01 | Breast | breast invasive carcinoma | Female | <65 | I/II | Chemotherapy | doxorubicin | PD | |
| GANAB | SNV | Missense_Mutation | novel | c.1878N>G | p.Phe626Leu | p.F626L | Q14697 | protein_coding | deleterious(0) | benign(0.43) | TCGA-BH-A0B6-01 | Breast | breast invasive carcinoma | Female | <65 | I/II | Unknown | Unknown | SD |
| GANAB | SNV | Missense_Mutation | rs140219733 | c.2318N>T | p.Ala773Val | p.A773V | Q14697 | protein_coding | deleterious(0.04) | benign(0.157) | TCGA-BH-A18G-01 | Breast | breast invasive carcinoma | Female | >=65 | I/II | Unknown | Unknown | SD |
| GANAB | SNV | Missense_Mutation | c.1149N>G | p.Ile383Met | p.I383M | Q14697 | protein_coding | deleterious(0) | possibly_damaging(0.563) | TCGA-D8-A1JN-01 | Breast | breast invasive carcinoma | Female | >=65 | III/IV | Hormone Therapy | anastrozolum | SD | |
| GANAB | SNV | Missense_Mutation | rs773537449 | c.812N>T | p.Ser271Phe | p.S271F | Q14697 | protein_coding | deleterious(0) | probably_damaging(0.974) | TCGA-D8-A4Z1-01 | Breast | breast invasive carcinoma | Female | >=65 | I/II | Hormone Therapy | tamoxiphen | SD |
| GANAB | SNV | Missense_Mutation | rs764430907 | c.899G>C | p.Arg300Pro | p.R300P | Q14697 | protein_coding | deleterious(0) | probably_damaging(0.996) | TCGA-E2-A14N-01 | Breast | breast invasive carcinoma | Female | <65 | I/II | Chemotherapy | cyclophosphamide | SD |
| GANAB | insertion | Frame_Shift_Ins | novel | c.891_892insGCTGAGGCAAGAGGATCGCTTGAGGCCAGGAGTTCGAGAC | p.Pro298AlafsTer26 | p.P298Afs*26 | Q14697 | protein_coding | TCGA-BH-A0AY-01 | Breast | breast invasive carcinoma | Female | <65 | I/II | Chemotherapy | SD | |||
| GANAB | SNV | Missense_Mutation | novel | c.1598N>G | p.Asp533Gly | p.D533G | Q14697 | protein_coding | deleterious(0) | probably_damaging(0.997) | TCGA-2W-A8YY-01 | Cervix | cervical & endocervical cancer | Female | <65 | I/II | Chemotherapy | cisplatin | CR |
| GANAB | SNV | Missense_Mutation | novel | c.392C>G | p.Ser131Cys | p.S131C | Q14697 | protein_coding | tolerated(0.2) | possibly_damaging(0.77) | TCGA-DS-A1OB-01 | Cervix | cervical & endocervical cancer | Female | <65 | I/II | Chemotherapy | carboplatin | PD |
| Page: 1 2 3 4 5 6 7 8 9 10 11 |
Top |
Related drugs of malignant transformation related genes |
| Identification of chemicals and drugs interact with genes involved in malignant transfromation |
| (DGIdb 4.0) |
| Entrez ID | Symbol | Category | Interaction Types | Drug Claim Name | Drug Name | PMIDs |
| 23193 | GANAB | DRUGGABLE GENOME, ENZYME | MIGLUSTAT | MIGLUSTAT | 21292481 |
| Page: 1 |

Copyright 2023-Present -The University of Texas Health Science Center at Houston |