
|
|||||
|
 | |
| |
| |
| |
| |
| |
|
Gene: GAMT |
Gene summary for GAMT |
| Gene information | Species | Human | Gene symbol | GAMT | Gene ID | 2593 |
| Gene name | guanidinoacetate N-methyltransferase | |
| Gene Alias | CCDS2 | |
| Cytomap | 19p13.3 | |
| Gene Type | protein-coding | GO ID | GO:0000003 | UniProtAcc | Q14353 |
Top |
Malignant transformation analysis |
| Identification of the aberrant gene expression in precancerous and cancerous lesions by comparing the gene expression of stem-like cells in diseased tissues with normal stem cells |
| Entrez ID | Symbol | Replicates | Species | Organ | Tissue | Adj P-value | Log2FC | Malignancy |
| 2593 | GAMT | GSM4909291 | Human | Breast | IDC | 2.58e-04 | 3.60e-01 | 0.1753 |
| 2593 | GAMT | GSM4909298 | Human | Breast | IDC | 2.19e-03 | 1.39e-01 | 0.1551 |
| 2593 | GAMT | GSM4909304 | Human | Breast | IDC | 1.35e-27 | 6.05e-01 | 0.1636 |
| 2593 | GAMT | GSM4909306 | Human | Breast | IDC | 4.10e-15 | 4.48e-01 | 0.1564 |
| 2593 | GAMT | GSM4909307 | Human | Breast | IDC | 2.54e-12 | 4.07e-01 | 0.1569 |
| 2593 | GAMT | GSM4909308 | Human | Breast | IDC | 2.73e-12 | 4.32e-01 | 0.158 |
| 2593 | GAMT | GSM4909311 | Human | Breast | IDC | 3.96e-04 | 1.35e-02 | 0.1534 |
| 2593 | GAMT | GSM4909315 | Human | Breast | IDC | 1.57e-03 | -1.54e-01 | 0.21 |
| 2593 | GAMT | GSM4909319 | Human | Breast | IDC | 4.50e-11 | 1.34e-01 | 0.1563 |
| 2593 | GAMT | GSM4909321 | Human | Breast | IDC | 1.74e-11 | 4.05e-01 | 0.1559 |
| 2593 | GAMT | DCIS2 | Human | Breast | DCIS | 7.29e-30 | 3.50e-02 | 0.0085 |
| 2593 | GAMT | LZE4T | Human | Esophagus | ESCC | 3.55e-10 | 5.85e-01 | 0.0811 |
| 2593 | GAMT | LZE7T | Human | Esophagus | ESCC | 1.08e-03 | 1.18e-01 | 0.0667 |
| 2593 | GAMT | LZE22D1 | Human | Esophagus | HGIN | 1.03e-02 | 7.21e-02 | 0.0595 |
| 2593 | GAMT | LZE22T | Human | Esophagus | ESCC | 9.05e-05 | 3.49e-01 | 0.068 |
| 2593 | GAMT | LZE24T | Human | Esophagus | ESCC | 6.28e-05 | 2.55e-01 | 0.0596 |
| 2593 | GAMT | LZE21T | Human | Esophagus | ESCC | 8.55e-04 | 5.09e-01 | 0.0655 |
| 2593 | GAMT | P1T-E | Human | Esophagus | ESCC | 1.78e-03 | 4.05e-01 | 0.0875 |
| 2593 | GAMT | P2T-E | Human | Esophagus | ESCC | 1.41e-16 | 4.20e-01 | 0.1177 |
| 2593 | GAMT | P4T-E | Human | Esophagus | ESCC | 1.60e-34 | 8.19e-01 | 0.1323 |
| Page: 1 2 3 4 5 6 |
| Tissue | Expression Dynamics | Abbreviation |
| Breast |  | IDC: Invasive ductal carcinoma |
| DCIS: Ductal carcinoma in situ | ||
| Precancer(BRCA1-mut): Precancerous lesion from BRCA1 mutation carriers | ||
| Esophagus | 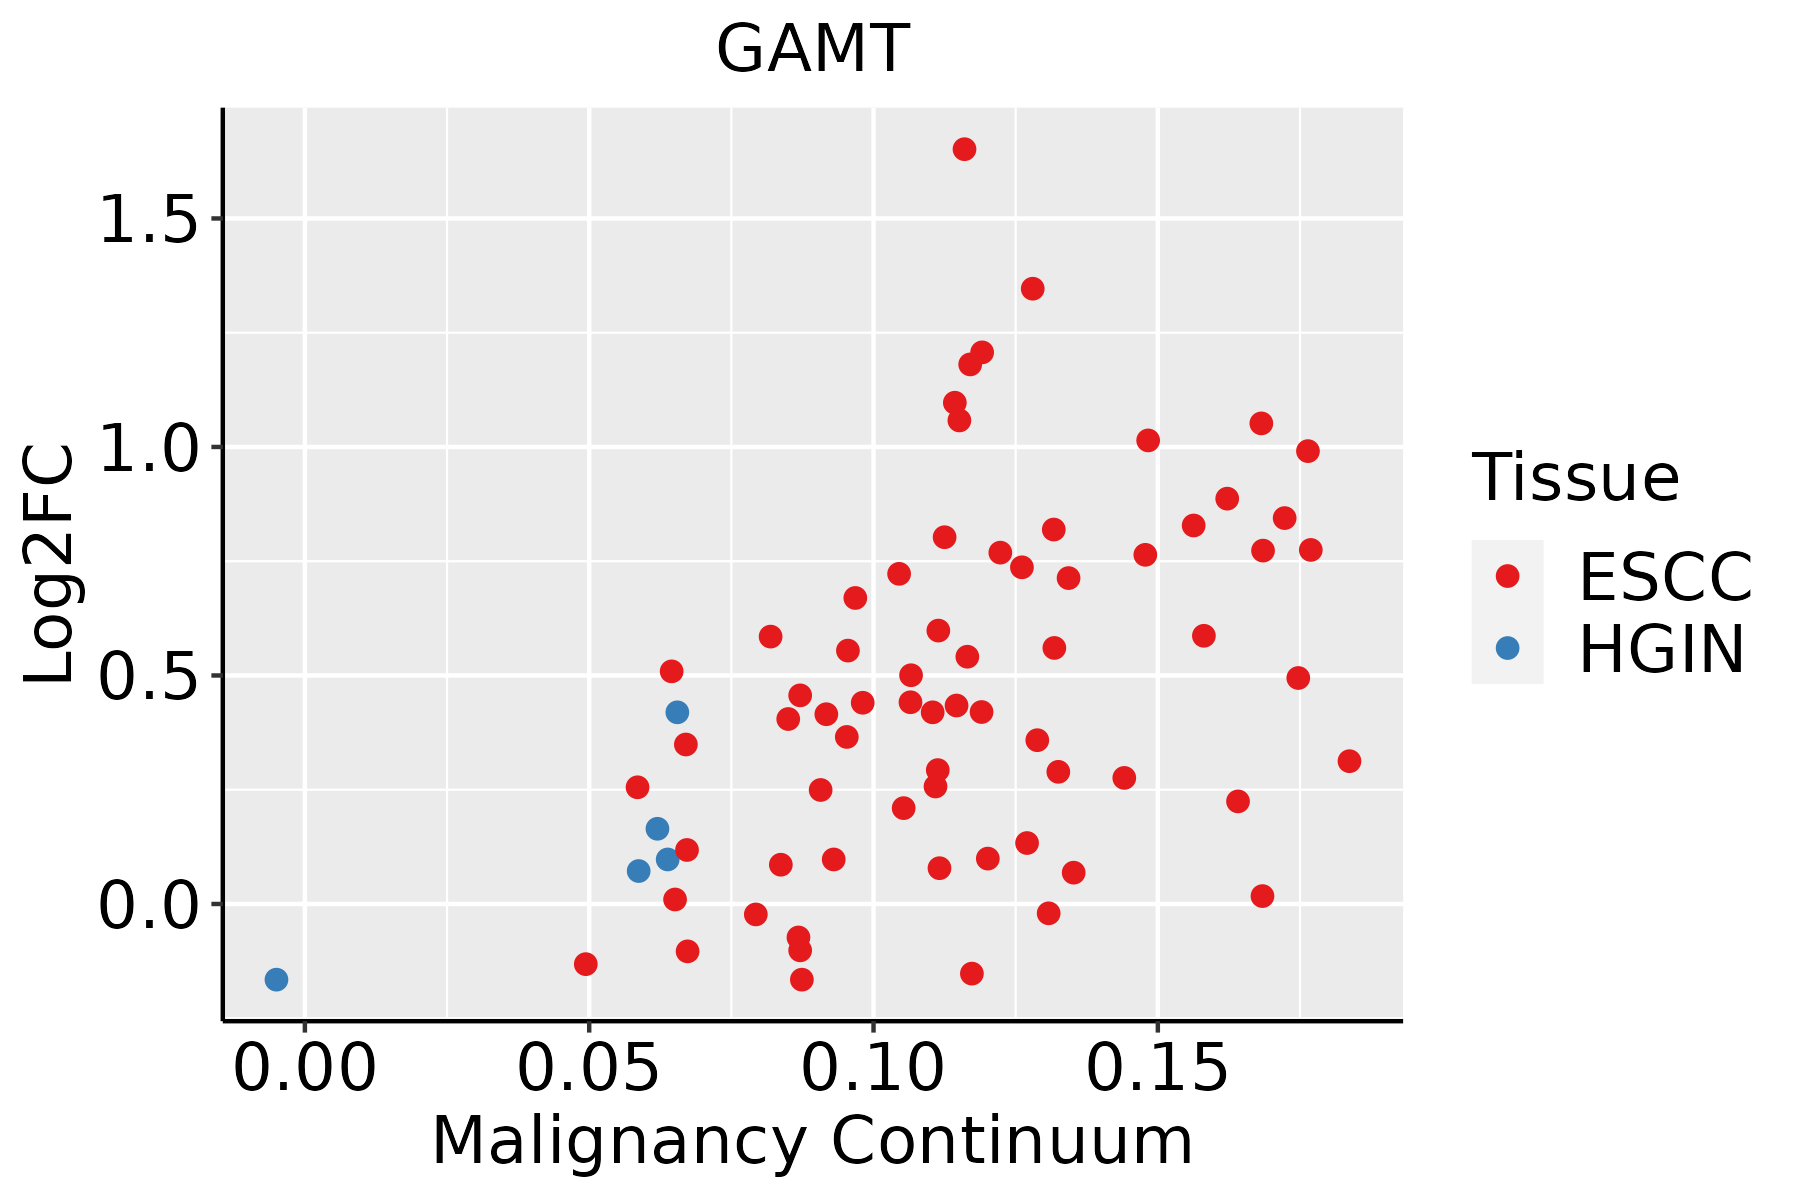 | ESCC: Esophageal squamous cell carcinoma |
| HGIN: High-grade intraepithelial neoplasias | ||
| LGIN: Low-grade intraepithelial neoplasias | ||
| Liver | 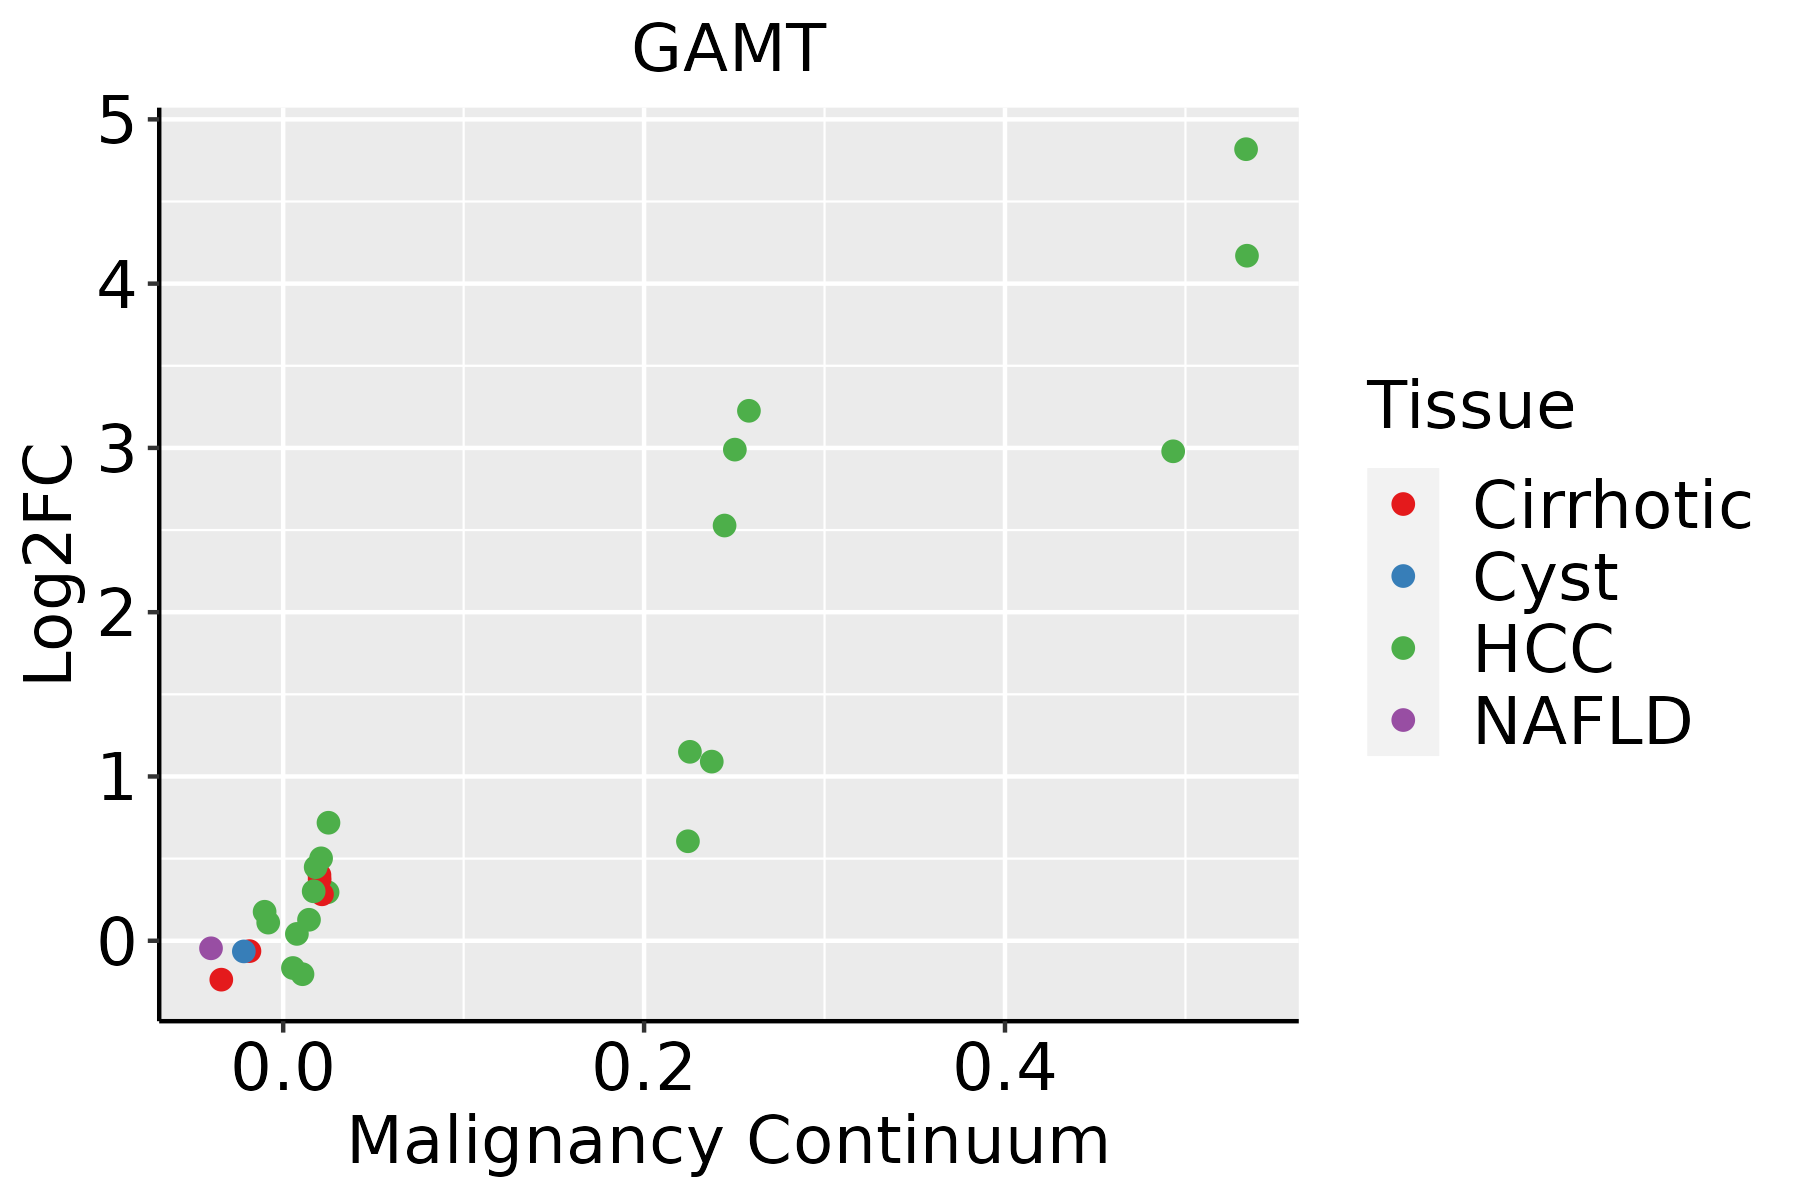 | HCC: Hepatocellular carcinoma |
| NAFLD: Non-alcoholic fatty liver disease | ||
| Oral Cavity | 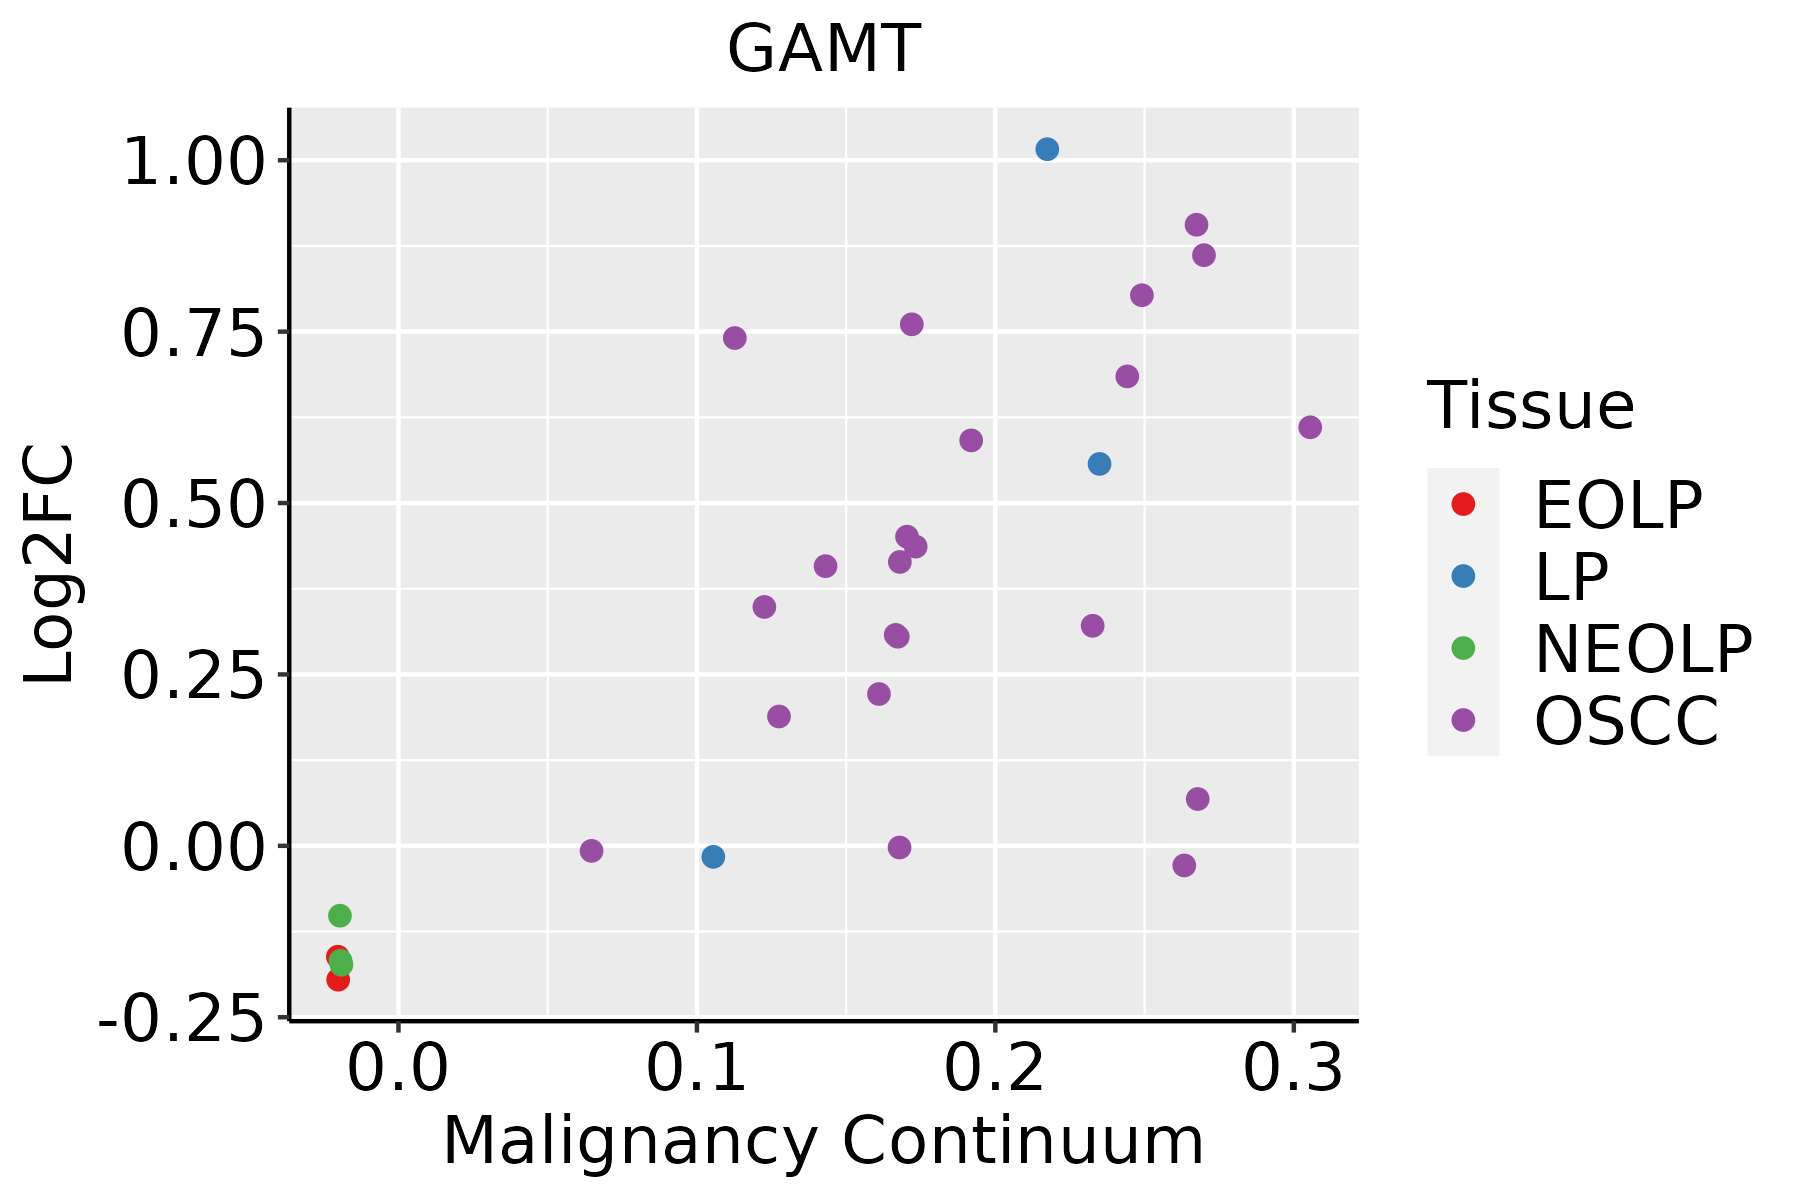 | EOLP: Erosive Oral lichen planus |
| LP: leukoplakia | ||
| NEOLP: Non-erosive oral lichen planus | ||
| OSCC: Oral squamous cell carcinoma | ||
| Prostate | 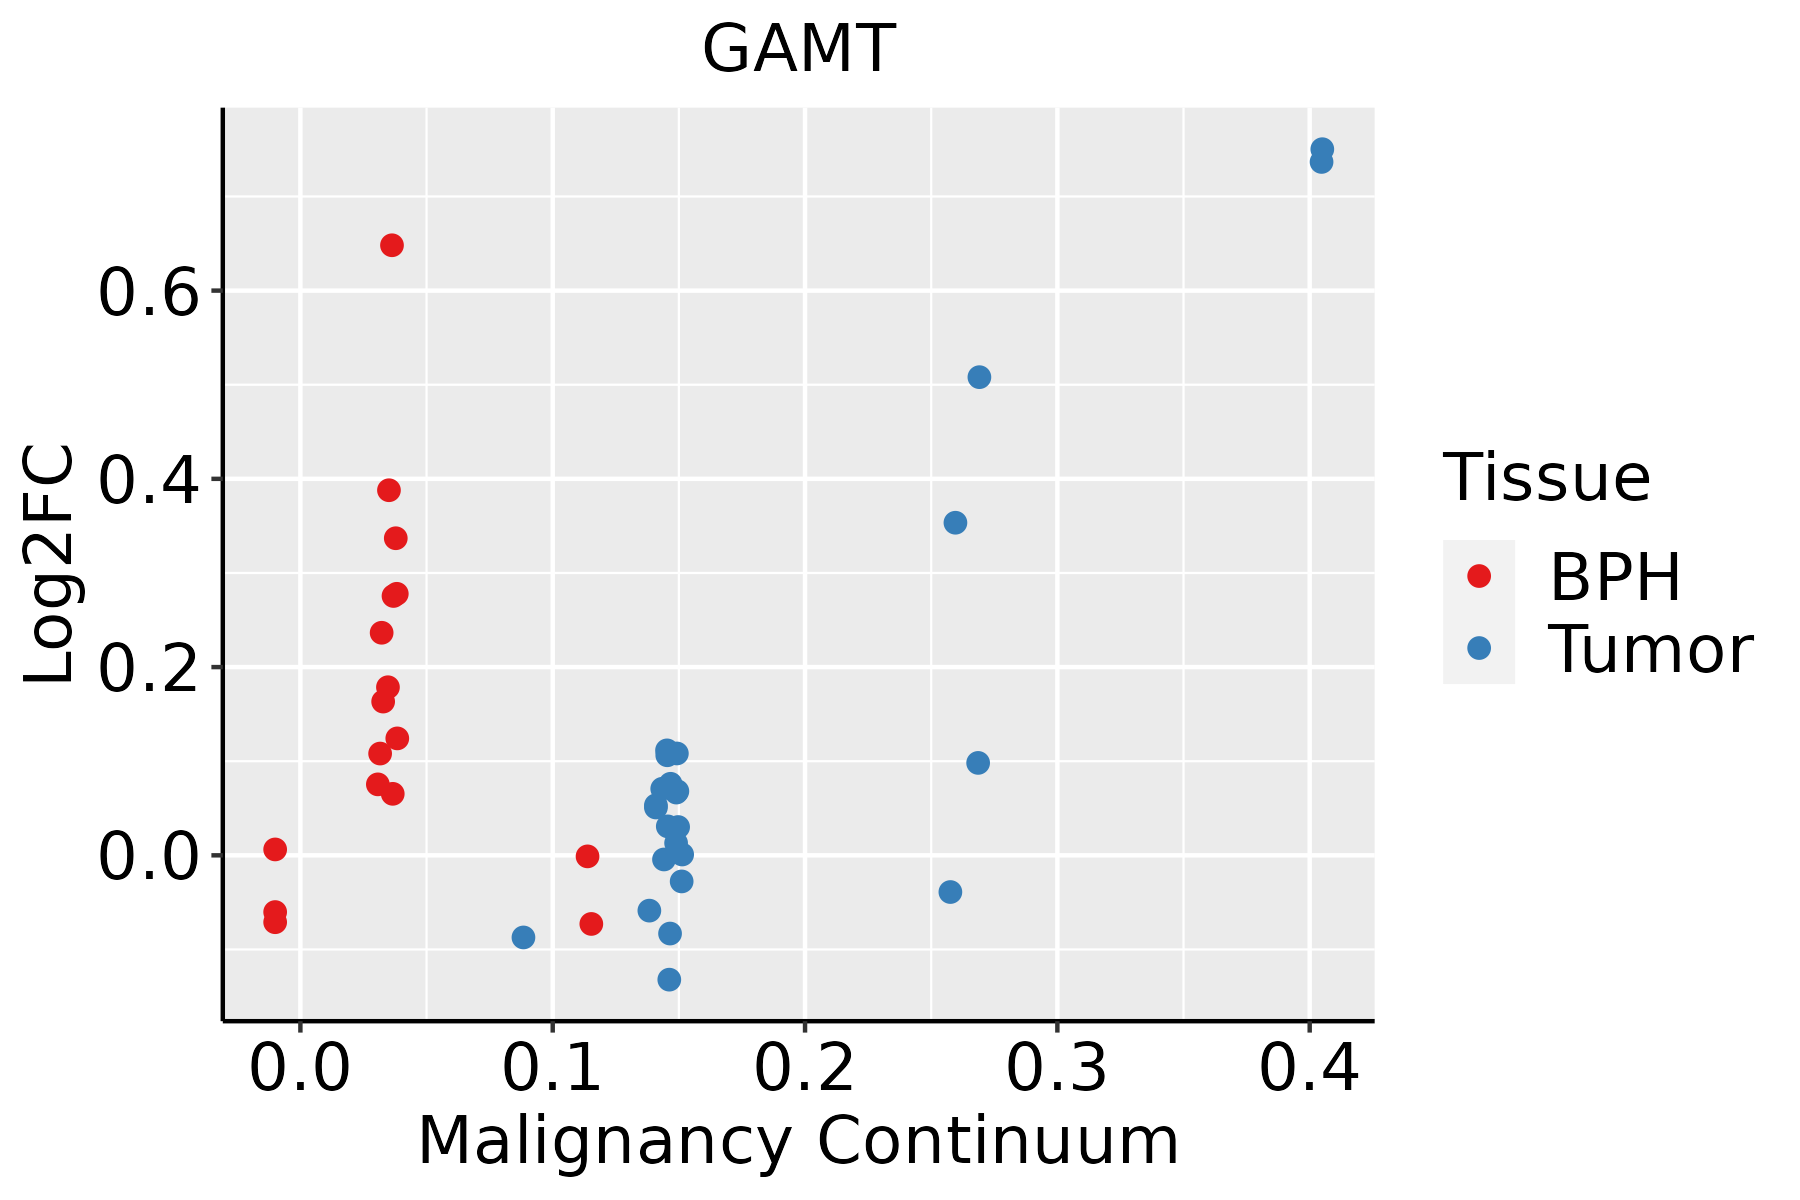 | BPH: Benign Prostatic Hyperplasia |
| Skin |  | AK: Actinic keratosis |
| cSCC: Cutaneous squamous cell carcinoma | ||
| SCCIS:squamous cell carcinoma in situ | ||
| Thyroid | 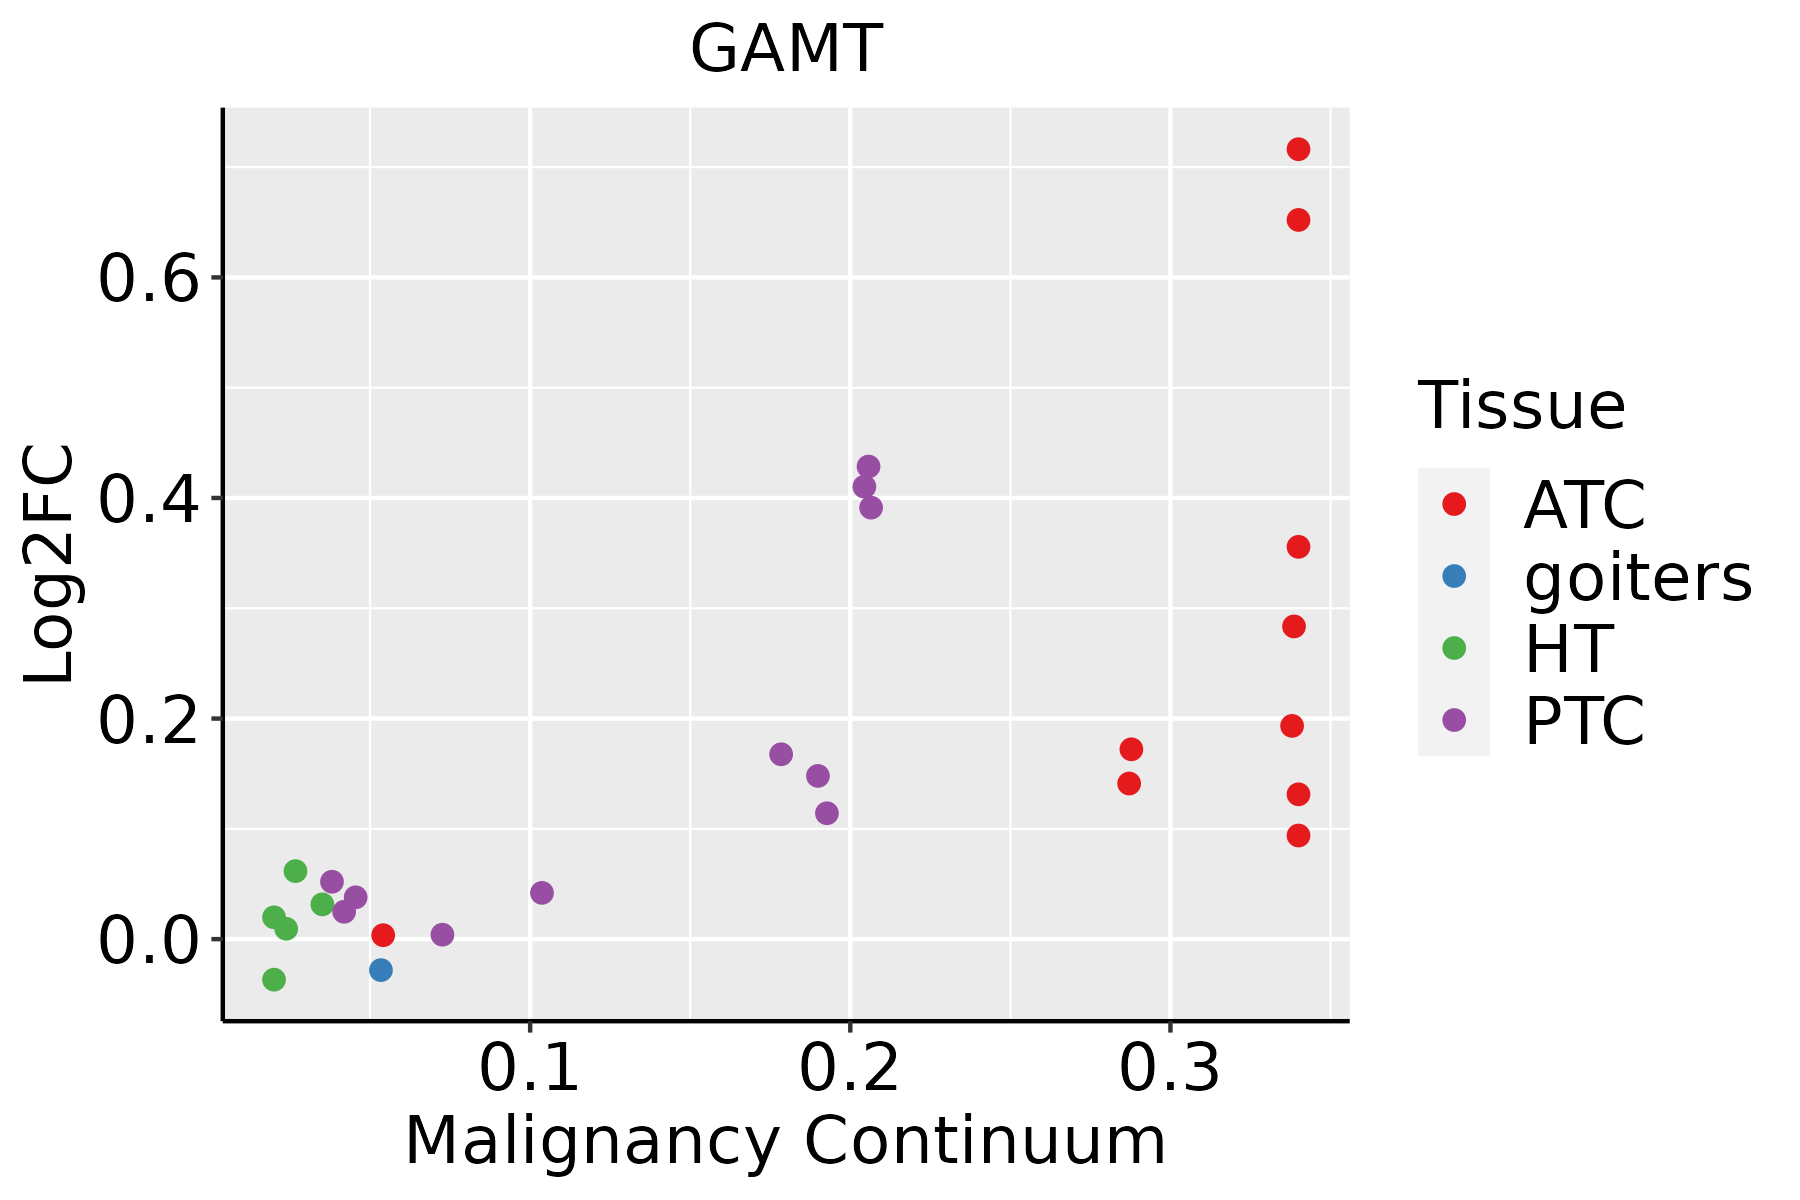 | ATC: Anaplastic thyroid cancer |
| HT: Hashimoto's thyroiditis | ||
| PTC: Papillary thyroid cancer |
| ∗log2FC in expression of this searched gene in stem-like cells from each diseased tissue sample relative to stem-like cells in normal samples in each tissue plotted against the malignancy continuum. Samples are colored based on if they are from different disease stage. |
Top |
Malignant transformation related pathway analysis |
| Find out the enriched GO biological processes and KEGG pathways involved in transition from healthy to precancer to cancer |
| Tissue | Disease Stage | Enriched GO biological Processes |
| Colorectum | AD |  |
| Colorectum | SER |  |
| Colorectum | MSS |  |
| Colorectum | MSI-H |  |
| Colorectum | FAP |  |
| ∗Top 15 enriched GO BP terms are showed in the bar plot of each disease state in each tissue. Each row represents a significant GO biological process which is colored according to the -log10(p.adjust). |
| Page: 1 2 3 4 5 6 7 8 9 |
| GO ID | Tissue | Disease Stage | Description | Gene Ratio | Bg Ratio | pvalue | p.adjust | Count |
| GO:007233012 | Breast | IDC | monocarboxylic acid biosynthetic process | 29/1434 | 214/18723 | 1.91e-03 | 1.83e-02 | 29 |
| GO:001605313 | Breast | IDC | organic acid biosynthetic process | 39/1434 | 316/18723 | 2.13e-03 | 1.99e-02 | 39 |
| GO:004639413 | Breast | IDC | carboxylic acid biosynthetic process | 38/1434 | 314/18723 | 3.39e-03 | 2.83e-02 | 38 |
| GO:00030125 | Breast | IDC | muscle system process | 50/1434 | 452/18723 | 5.52e-03 | 4.05e-02 | 50 |
| GO:001605322 | Breast | DCIS | organic acid biosynthetic process | 38/1390 | 316/18723 | 2.22e-03 | 2.04e-02 | 38 |
| GO:007233022 | Breast | DCIS | monocarboxylic acid biosynthetic process | 28/1390 | 214/18723 | 2.43e-03 | 2.18e-02 | 28 |
| GO:000301212 | Breast | DCIS | muscle system process | 50/1390 | 452/18723 | 3.02e-03 | 2.57e-02 | 50 |
| GO:004639422 | Breast | DCIS | carboxylic acid biosynthetic process | 37/1390 | 314/18723 | 3.56e-03 | 2.92e-02 | 37 |
| GO:00322592 | Esophagus | ESCC | methylation | 222/8552 | 364/18723 | 2.26e-09 | 5.09e-08 | 222 |
| GO:00065757 | Esophagus | ESCC | cellular modified amino acid metabolic process | 112/8552 | 188/18723 | 8.31e-05 | 6.06e-04 | 112 |
| GO:00423986 | Esophagus | ESCC | cellular modified amino acid biosynthetic process | 34/8552 | 46/18723 | 9.39e-05 | 6.70e-04 | 34 |
| GO:00463948 | Esophagus | ESCC | carboxylic acid biosynthetic process | 175/8552 | 314/18723 | 1.98e-04 | 1.26e-03 | 175 |
| GO:00160538 | Esophagus | ESCC | organic acid biosynthetic process | 175/8552 | 316/18723 | 3.04e-04 | 1.82e-03 | 175 |
| GO:00352647 | Esophagus | ESCC | multicellular organism growth | 80/8552 | 132/18723 | 3.84e-04 | 2.22e-03 | 80 |
| GO:001605312 | Liver | Cirrhotic | organic acid biosynthetic process | 139/4634 | 316/18723 | 4.28e-14 | 3.83e-12 | 139 |
| GO:004639412 | Liver | Cirrhotic | carboxylic acid biosynthetic process | 137/4634 | 314/18723 | 1.40e-13 | 1.14e-11 | 137 |
| GO:007233011 | Liver | Cirrhotic | monocarboxylic acid biosynthetic process | 93/4634 | 214/18723 | 1.43e-09 | 6.16e-08 | 93 |
| GO:004239811 | Liver | Cirrhotic | cellular modified amino acid biosynthetic process | 25/4634 | 46/18723 | 1.61e-05 | 2.19e-04 | 25 |
| GO:000657511 | Liver | Cirrhotic | cellular modified amino acid metabolic process | 70/4634 | 188/18723 | 9.04e-05 | 9.69e-04 | 70 |
| GO:003526411 | Liver | Cirrhotic | multicellular organism growth | 47/4634 | 132/18723 | 3.40e-03 | 1.89e-02 | 47 |
| Page: 1 2 3 |
| Pathway ID | Tissue | Disease Stage | Description | Gene Ratio | Bg Ratio | pvalue | p.adjust | qvalue | Count |
| hsa00260 | Liver | Cirrhotic | Glycine, serine and threonine metabolism | 22/2530 | 40/8465 | 7.85e-04 | 4.51e-03 | 2.78e-03 | 22 |
| hsa003308 | Liver | Cirrhotic | Arginine and proline metabolism | 25/2530 | 50/8465 | 2.18e-03 | 9.41e-03 | 5.80e-03 | 25 |
| hsa002601 | Liver | Cirrhotic | Glycine, serine and threonine metabolism | 22/2530 | 40/8465 | 7.85e-04 | 4.51e-03 | 2.78e-03 | 22 |
| hsa0033011 | Liver | Cirrhotic | Arginine and proline metabolism | 25/2530 | 50/8465 | 2.18e-03 | 9.41e-03 | 5.80e-03 | 25 |
| hsa002602 | Liver | HCC | Glycine, serine and threonine metabolism | 28/4020 | 40/8465 | 3.28e-03 | 1.07e-02 | 5.93e-03 | 28 |
| hsa0033021 | Liver | HCC | Arginine and proline metabolism | 33/4020 | 50/8465 | 6.28e-03 | 1.77e-02 | 9.83e-03 | 33 |
| hsa002603 | Liver | HCC | Glycine, serine and threonine metabolism | 28/4020 | 40/8465 | 3.28e-03 | 1.07e-02 | 5.93e-03 | 28 |
| hsa0033031 | Liver | HCC | Arginine and proline metabolism | 33/4020 | 50/8465 | 6.28e-03 | 1.77e-02 | 9.83e-03 | 33 |
| hsa0033010 | Oral cavity | OSCC | Arginine and proline metabolism | 30/3704 | 50/8465 | 1.50e-02 | 3.26e-02 | 1.66e-02 | 30 |
| hsa0033013 | Oral cavity | OSCC | Arginine and proline metabolism | 30/3704 | 50/8465 | 1.50e-02 | 3.26e-02 | 1.66e-02 | 30 |
| hsa0033023 | Oral cavity | LP | Arginine and proline metabolism | 26/2418 | 50/8465 | 3.94e-04 | 2.08e-03 | 1.34e-03 | 26 |
| hsa0033033 | Oral cavity | LP | Arginine and proline metabolism | 26/2418 | 50/8465 | 3.94e-04 | 2.08e-03 | 1.34e-03 | 26 |
| hsa003309 | Prostate | BPH | Arginine and proline metabolism | 18/1718 | 50/8465 | 7.17e-03 | 2.32e-02 | 1.43e-02 | 18 |
| hsa0033012 | Prostate | BPH | Arginine and proline metabolism | 18/1718 | 50/8465 | 7.17e-03 | 2.32e-02 | 1.43e-02 | 18 |
| hsa0033022 | Prostate | Tumor | Arginine and proline metabolism | 19/1791 | 50/8465 | 4.73e-03 | 1.67e-02 | 1.03e-02 | 19 |
| hsa0033032 | Prostate | Tumor | Arginine and proline metabolism | 19/1791 | 50/8465 | 4.73e-03 | 1.67e-02 | 1.03e-02 | 19 |
| Page: 1 |
Top |
Cell-cell communication analysis |
| Identification of potential cell-cell interactions between two cell types and their ligand-receptor pairs for different disease states |
| Ligand | Receptor | LRpair | Pathway | Tissue | Disease Stage |
| Page: 1 |
Top |
Single-cell gene regulatory network inference analysis |
| Find out the significant the regulons (TFs) and the target genes of each regulon across cell types for different disease states |
| TF | Cell Type | Tissue | Disease Stage | Target Gene | RSS | Regulon Activity |
| ∗The dot plots of a searched regulon are shown for all cell subpopulations in each disease state of each tissue based on the regulon specific score inferred using pySCENIC and by calculating the average expression. |
| Page: 1 |
Top |
Somatic mutation of malignant transformation related genes |
| Annotation of somatic variants for genes involved in malignant transformation |
| Hugo Symbol | Variant Class | Variant Classification | dbSNP RS | HGVSc | HGVSp | HGVSp Short | SWISSPROT | BIOTYPE | SIFT | PolyPhen | Tumor Sample Barcode | Tissue | Histology | Sex | Age | Stage | Therapy Types | Drugs | Outcome |
| GAMT | SNV | Missense_Mutation | c.209N>C | p.Gly70Ala | p.G70A | Q14353 | protein_coding | deleterious(0) | probably_damaging(1) | TCGA-B6-A0RU-01 | Breast | breast invasive carcinoma | Female | <65 | I/II | Unknown | Unknown | PD | |
| GAMT | SNV | Missense_Mutation | c.522N>T | p.Trp174Cys | p.W174C | Q14353 | protein_coding | deleterious_low_confidence(0.01) | probably_damaging(0.987) | TCGA-EW-A1J5-01 | Breast | breast invasive carcinoma | Female | <65 | I/II | Chemotherapy | adriamycin | SD | |
| GAMT | SNV | Missense_Mutation | rs121909272 | c.506G>A | p.Cys169Tyr | p.C169Y | Q14353 | protein_coding | tolerated(0.25) | probably_damaging(0.991) | TCGA-AD-5900-01 | Colorectum | colon adenocarcinoma | Male | >=65 | I/II | Unknown | Unknown | SD |
| GAMT | SNV | Missense_Mutation | rs199678332 | c.575N>A | p.Arg192His | p.R192H | Q14353 | protein_coding | tolerated_low_confidence(0.59) | benign(0.365) | TCGA-CK-4951-01 | Colorectum | colon adenocarcinoma | Female | >=65 | I/II | Unknown | Unknown | PD |
| GAMT | SNV | Missense_Mutation | c.457N>G | p.Lys153Glu | p.K153E | Q14353 | protein_coding | tolerated(0.25) | benign(0.253) | TCGA-CK-5916-01 | Colorectum | colon adenocarcinoma | Female | >=65 | I/II | Unknown | Unknown | PD | |
| GAMT | SNV | Missense_Mutation | rs750195151 | c.473N>A | p.Arg158His | p.R158H | Q14353 | protein_coding | deleterious(0.05) | probably_damaging(0.99) | TCGA-CM-6162-01 | Colorectum | colon adenocarcinoma | Female | <65 | III/IV | Chemotherapy | oxaliplatin | SD |
| GAMT | SNV | Missense_Mutation | c.599N>T | p.Ser200Phe | p.S200F | Q14353 | protein_coding | tolerated_low_confidence(0.09) | benign(0.018) | TCGA-DM-A1HB-01 | Colorectum | colon adenocarcinoma | Male | >=65 | III/IV | Unknown | Unknown | SD | |
| GAMT | insertion | Frame_Shift_Ins | rs768985121 | c.491dupG | p.Val165ArgfsTer26 | p.V165Rfs*26 | Q14353 | protein_coding | TCGA-AA-3663-01 | Colorectum | colon adenocarcinoma | Male | <65 | I/II | Unknown | Unknown | SD | ||
| GAMT | insertion | Frame_Shift_Ins | novel | c.64_65insG | p.Ala22GlyfsTer63 | p.A22Gfs*63 | Q14353 | protein_coding | TCGA-NH-A5IV-01 | Colorectum | colon adenocarcinoma | Female | >=65 | I/II | Unknown | Unknown | SD | ||
| GAMT | SNV | Missense_Mutation | rs761599682 | c.485N>T | p.Pro162Leu | p.P162L | Q14353 | protein_coding | deleterious(0.01) | possibly_damaging(0.839) | TCGA-2E-A9G8-01 | Endometrium | uterine corpus endometrioid carcinoma | Female | <65 | III/IV | Chemotherapy | taxol | CR |
| Page: 1 2 |
Top |
Related drugs of malignant transformation related genes |
| Identification of chemicals and drugs interact with genes involved in malignant transfromation |
| (DGIdb 4.0) |
| Entrez ID | Symbol | Category | Interaction Types | Drug Claim Name | Drug Name | PMIDs |
| Page: 1 |

Copyright 2023-Present -The University of Texas Health Science Center at Houston |