
|
|||||
|
 | |
| |
| |
| |
| |
| |
|
Gene: GALNT8 |
Gene summary for GALNT8 |
| Gene information | Species | Human | Gene symbol | GALNT8 | Gene ID | 26290 |
| Gene name | polypeptide N-acetylgalactosaminyltransferase 8 | |
| Gene Alias | GALNAC-T8 | |
| Cytomap | 12p13.32 | |
| Gene Type | protein-coding | GO ID | GO:0006464 | UniProtAcc | Q9NY28 |
Top |
Malignant transformation analysis |
| Identification of the aberrant gene expression in precancerous and cancerous lesions by comparing the gene expression of stem-like cells in diseased tissues with normal stem cells |
| Entrez ID | Symbol | Replicates | Species | Organ | Tissue | Adj P-value | Log2FC | Malignancy |
| 26290 | GALNT8 | HTA11_78_2000001011 | Human | Colorectum | AD | 5.72e-03 | 6.66e-01 | -0.1088 |
| 26290 | GALNT8 | HTA11_696_2000001011 | Human | Colorectum | AD | 1.24e-08 | 5.96e-01 | -0.1464 |
| 26290 | GALNT8 | HTA11_866_2000001011 | Human | Colorectum | AD | 2.49e-08 | 5.90e-01 | -0.1001 |
| 26290 | GALNT8 | A002-C-116 | Human | Colorectum | FAP | 1.27e-03 | 3.69e-01 | -0.0452 |
| 26290 | GALNT8 | C38 | Human | Oral cavity | OSCC | 3.10e-09 | 6.62e-01 | 0.172 |
| 26290 | GALNT8 | C06 | Human | Oral cavity | OSCC | 1.28e-06 | 4.91e-01 | 0.2699 |
| 26290 | GALNT8 | LN38 | Human | Oral cavity | OSCC | 2.78e-08 | 7.90e-01 | 0.168 |
| Page: 1 |
| Tissue | Expression Dynamics | Abbreviation |
| Colorectum (GSE201348) |  | FAP: Familial adenomatous polyposis |
| CRC: Colorectal cancer | ||
| Colorectum (HTA11) |  | AD: Adenomas |
| SER: Sessile serrated lesions | ||
| MSI-H: Microsatellite-high colorectal cancer | ||
| MSS: Microsatellite stable colorectal cancer | ||
| Oral Cavity | 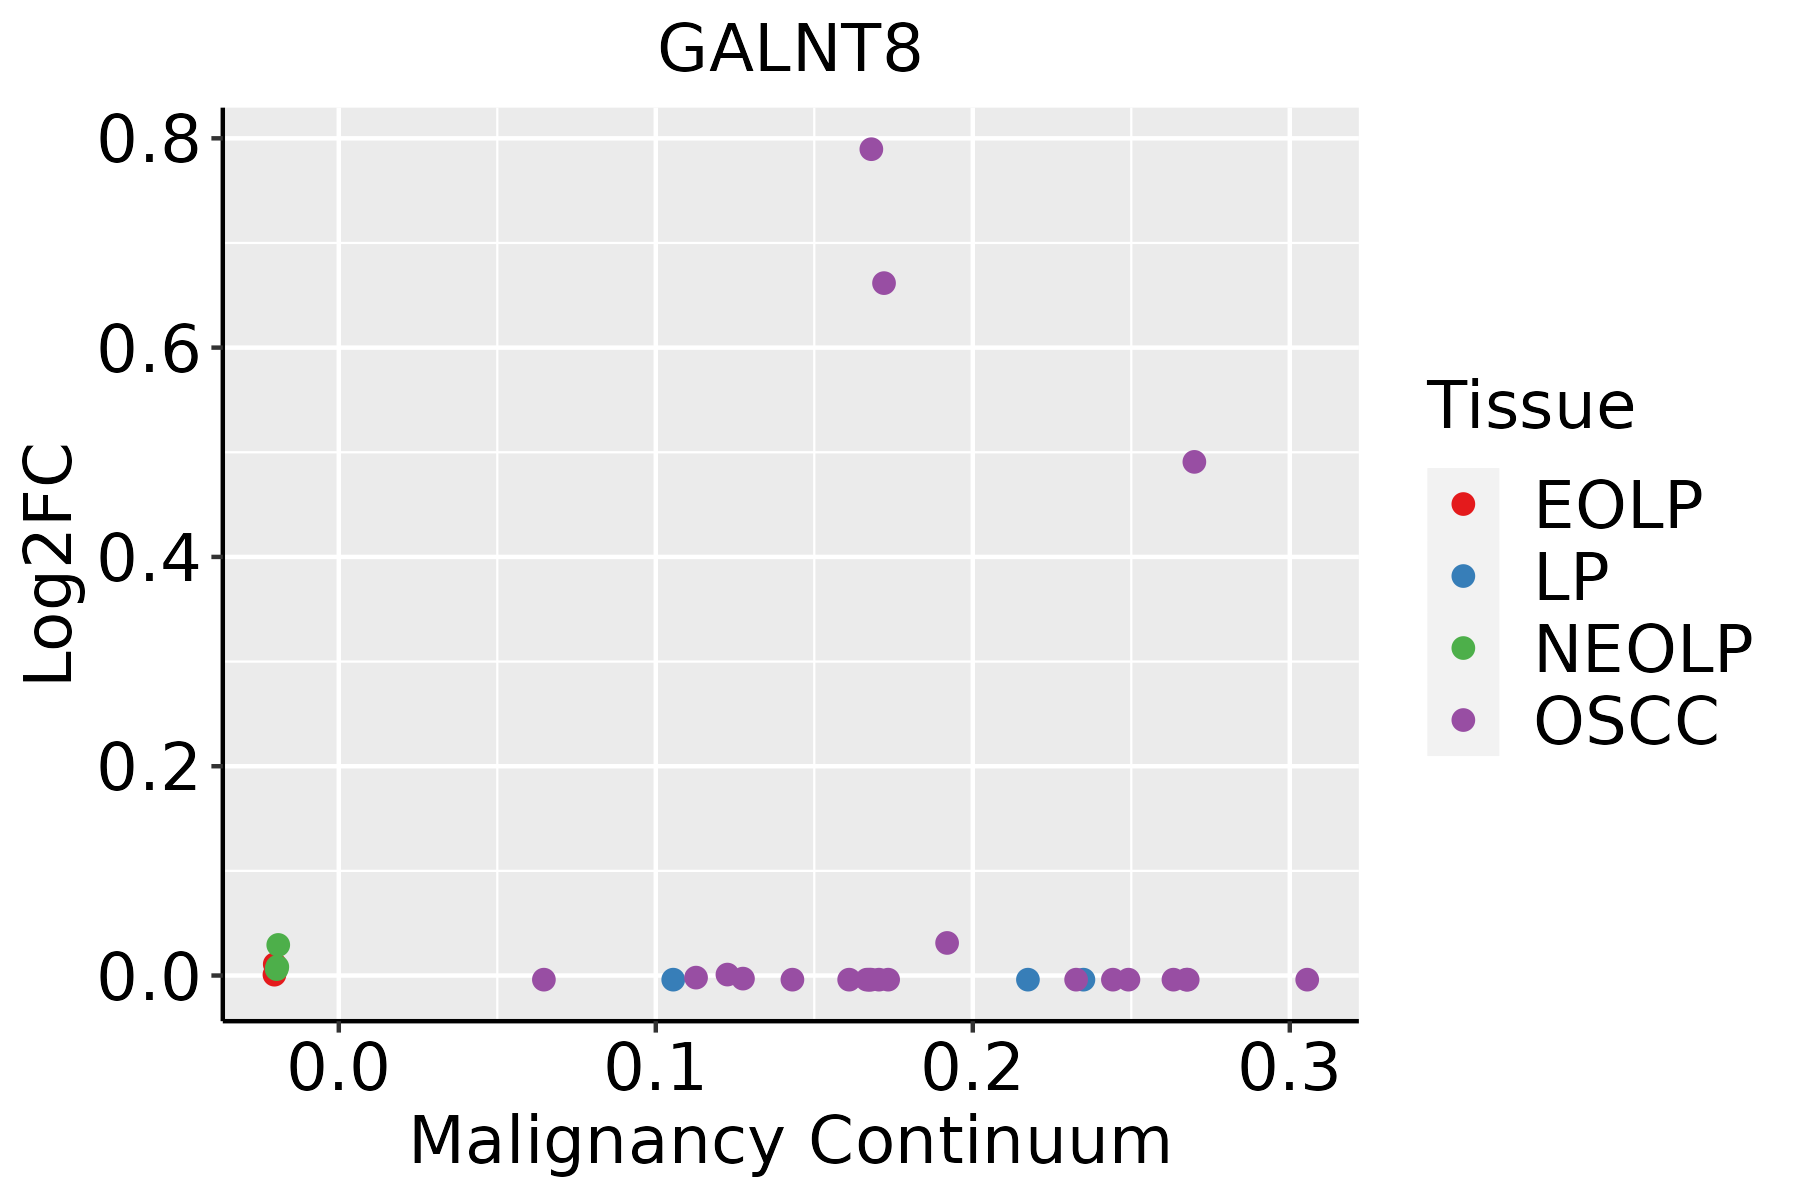 | EOLP: Erosive Oral lichen planus |
| LP: leukoplakia | ||
| NEOLP: Non-erosive oral lichen planus | ||
| OSCC: Oral squamous cell carcinoma |
| ∗log2FC in expression of this searched gene in stem-like cells from each diseased tissue sample relative to stem-like cells in normal samples in each tissue plotted against the malignancy continuum. Samples are colored based on if they are from different disease stage. |
Top |
Malignant transformation related pathway analysis |
| Find out the enriched GO biological processes and KEGG pathways involved in transition from healthy to precancer to cancer |
| Tissue | Disease Stage | Enriched GO biological Processes |
| Colorectum | AD |  |
| Colorectum | SER |  |
| Colorectum | MSS |  |
| Colorectum | MSI-H |  |
| Colorectum | FAP |  |
| ∗Top 15 enriched GO BP terms are showed in the bar plot of each disease state in each tissue. Each row represents a significant GO biological process which is colored according to the -log10(p.adjust). |
| Page: 1 2 3 4 5 6 7 8 9 |
| GO ID | Tissue | Disease Stage | Description | Gene Ratio | Bg Ratio | pvalue | p.adjust | Count |
| GO:0006486 | Colorectum | AD | protein glycosylation | 64/3918 | 226/18723 | 4.86e-03 | 3.27e-02 | 64 |
| GO:0043413 | Colorectum | AD | macromolecule glycosylation | 64/3918 | 226/18723 | 4.86e-03 | 3.27e-02 | 64 |
| GO:0070085 | Colorectum | AD | glycosylation | 67/3918 | 240/18723 | 5.78e-03 | 3.67e-02 | 67 |
| GO:00064861 | Colorectum | FAP | protein glycosylation | 48/2622 | 226/18723 | 1.85e-03 | 1.57e-02 | 48 |
| GO:00434131 | Colorectum | FAP | macromolecule glycosylation | 48/2622 | 226/18723 | 1.85e-03 | 1.57e-02 | 48 |
| GO:00700851 | Colorectum | FAP | glycosylation | 50/2622 | 240/18723 | 2.30e-03 | 1.85e-02 | 50 |
| GO:0009101 | Colorectum | FAP | glycoprotein biosynthetic process | 63/2622 | 317/18723 | 2.31e-03 | 1.86e-02 | 63 |
| GO:00091001 | Oral cavity | OSCC | glycoprotein metabolic process | 185/7305 | 387/18723 | 2.37e-04 | 1.54e-03 | 185 |
| GO:00091011 | Oral cavity | OSCC | glycoprotein biosynthetic process | 151/7305 | 317/18723 | 1.01e-03 | 5.26e-03 | 151 |
| GO:00064864 | Oral cavity | OSCC | protein glycosylation | 111/7305 | 226/18723 | 1.22e-03 | 6.10e-03 | 111 |
| GO:00434134 | Oral cavity | OSCC | macromolecule glycosylation | 111/7305 | 226/18723 | 1.22e-03 | 6.10e-03 | 111 |
| GO:00700853 | Oral cavity | OSCC | glycosylation | 117/7305 | 240/18723 | 1.29e-03 | 6.42e-03 | 117 |
| Page: 1 |
| Pathway ID | Tissue | Disease Stage | Description | Gene Ratio | Bg Ratio | pvalue | p.adjust | qvalue | Count |
| Page: 1 |
Top |
Cell-cell communication analysis |
| Identification of potential cell-cell interactions between two cell types and their ligand-receptor pairs for different disease states |
| Ligand | Receptor | LRpair | Pathway | Tissue | Disease Stage |
| Page: 1 |
Top |
Single-cell gene regulatory network inference analysis |
| Find out the significant the regulons (TFs) and the target genes of each regulon across cell types for different disease states |
| TF | Cell Type | Tissue | Disease Stage | Target Gene | RSS | Regulon Activity |
| ∗The dot plots of a searched regulon are shown for all cell subpopulations in each disease state of each tissue based on the regulon specific score inferred using pySCENIC and by calculating the average expression. |
| Page: 1 |
Top |
Somatic mutation of malignant transformation related genes |
| Annotation of somatic variants for genes involved in malignant transformation |
| Hugo Symbol | Variant Class | Variant Classification | dbSNP RS | HGVSc | HGVSp | HGVSp Short | SWISSPROT | BIOTYPE | SIFT | PolyPhen | Tumor Sample Barcode | Tissue | Histology | Sex | Age | Stage | Therapy Types | Drugs | Outcome |
| GALNT8 | SNV | Missense_Mutation | c.931C>G | p.Arg311Gly | p.R311G | Q9NY28 | protein_coding | tolerated(0.11) | benign(0.097) | TCGA-A7-A6VX-01 | Breast | breast invasive carcinoma | Female | >=65 | I/II | Chemotherapy | docetaxel | CR | |
| GALNT8 | SNV | Missense_Mutation | rs757089155 | c.500N>A | p.Arg167Gln | p.R167Q | Q9NY28 | protein_coding | deleterious(0.02) | probably_damaging(0.998) | TCGA-AC-A5XS-01 | Breast | breast invasive carcinoma | Female | >=65 | I/II | Hormone Therapy | femara | SD |
| GALNT8 | SNV | Missense_Mutation | c.324G>C | p.Glu108Asp | p.E108D | Q9NY28 | protein_coding | tolerated(0.13) | benign(0.105) | TCGA-AO-A0JC-01 | Breast | breast invasive carcinoma | Female | <65 | I/II | Chemotherapy | fluorouracil | SD | |
| GALNT8 | SNV | Missense_Mutation | c.394C>T | p.Leu132Phe | p.L132F | Q9NY28 | protein_coding | deleterious(0) | probably_damaging(0.999) | TCGA-BH-A0BA-01 | Breast | breast invasive carcinoma | Female | <65 | III/IV | Chemotherapy | cytoxan | SD | |
| GALNT8 | SNV | Missense_Mutation | novel | c.1603N>C | p.Tyr535His | p.Y535H | Q9NY28 | protein_coding | deleterious(0.01) | probably_damaging(1) | TCGA-BH-A0E0-01 | Breast | breast invasive carcinoma | Female | <65 | III/IV | Chemotherapy | docetaxel | SD |
| GALNT8 | SNV | Missense_Mutation | rs766726075 | c.1267N>A | p.Ala423Thr | p.A423T | Q9NY28 | protein_coding | tolerated(0.39) | benign(0.014) | TCGA-BH-A18G-01 | Breast | breast invasive carcinoma | Female | >=65 | I/II | Unknown | Unknown | SD |
| GALNT8 | SNV | Missense_Mutation | c.835N>T | p.Ala279Ser | p.A279S | Q9NY28 | protein_coding | deleterious(0) | probably_damaging(0.994) | TCGA-D8-A1J9-01 | Breast | breast invasive carcinoma | Female | <65 | I/II | Unknown | Unknown | SD | |
| GALNT8 | SNV | Missense_Mutation | c.1882N>C | p.Val628Leu | p.V628L | Q9NY28 | protein_coding | tolerated(0.49) | benign(0.001) | TCGA-E2-A1IG-01 | Breast | breast invasive carcinoma | Female | <65 | I/II | Chemotherapy | cyclophosphamide | SD | |
| GALNT8 | SNV | Missense_Mutation | c.1331T>C | p.Val444Ala | p.V444A | Q9NY28 | protein_coding | deleterious(0) | probably_damaging(0.973) | TCGA-EW-A1IZ-01 | Breast | breast invasive carcinoma | Female | <65 | III/IV | Chemotherapy | taxotere | SD | |
| GALNT8 | SNV | Missense_Mutation | rs756053265 | c.1664N>A | p.Arg555His | p.R555H | Q9NY28 | protein_coding | tolerated(0.17) | benign(0.04) | TCGA-EW-A1P5-01 | Breast | breast invasive carcinoma | Female | >=65 | I/II | Hormone Therapy | anastrozole | SD |
| Page: 1 2 3 4 5 6 7 8 9 10 11 12 |
Top |
Related drugs of malignant transformation related genes |
| Identification of chemicals and drugs interact with genes involved in malignant transfromation |
| (DGIdb 4.0) |
| Entrez ID | Symbol | Category | Interaction Types | Drug Claim Name | Drug Name | PMIDs |
| Page: 1 |

Copyright 2023-Present -The University of Texas Health Science Center at Houston |