
|
|||||
|
 | |
| |
| |
| |
| |
| |
|
Gene: GALNT7 |
Gene summary for GALNT7 |
| Gene information | Species | Human | Gene symbol | GALNT7 | Gene ID | 51809 |
| Gene name | polypeptide N-acetylgalactosaminyltransferase 7 | |
| Gene Alias | GALNAC-T7 | |
| Cytomap | 4q34.1 | |
| Gene Type | protein-coding | GO ID | GO:0005975 | UniProtAcc | Q86SF2 |
Top |
Malignant transformation analysis |
| Identification of the aberrant gene expression in precancerous and cancerous lesions by comparing the gene expression of stem-like cells in diseased tissues with normal stem cells |
| Entrez ID | Symbol | Replicates | Species | Organ | Tissue | Adj P-value | Log2FC | Malignancy |
| 51809 | GALNT7 | CCI_1 | Human | Cervix | CC | 5.78e-14 | 1.16e+00 | 0.528 |
| 51809 | GALNT7 | CCI_2 | Human | Cervix | CC | 2.11e-03 | 5.00e-01 | 0.5249 |
| 51809 | GALNT7 | CCI_3 | Human | Cervix | CC | 9.78e-04 | 4.96e-01 | 0.516 |
| 51809 | GALNT7 | H2 | Human | Cervix | HSIL_HPV | 7.66e-06 | 3.56e-01 | 0.0632 |
| 51809 | GALNT7 | HTA11_3410_2000001011 | Human | Colorectum | AD | 9.79e-22 | -6.92e-01 | 0.0155 |
| 51809 | GALNT7 | HTA11_2951_2000001011 | Human | Colorectum | AD | 4.86e-02 | -7.69e-01 | 0.0216 |
| 51809 | GALNT7 | HTA11_3361_2000001011 | Human | Colorectum | AD | 5.14e-07 | -5.92e-01 | -0.1207 |
| 51809 | GALNT7 | HTA11_866_2000001011 | Human | Colorectum | AD | 1.07e-03 | -2.78e-01 | -0.1001 |
| 51809 | GALNT7 | HTA11_9341_2000001011 | Human | Colorectum | SER | 3.24e-02 | -8.71e-01 | -0.00410000000000005 |
| 51809 | GALNT7 | HTA11_866_3004761011 | Human | Colorectum | AD | 2.07e-14 | -6.74e-01 | 0.096 |
| 51809 | GALNT7 | HTA11_8622_2000001021 | Human | Colorectum | SER | 2.56e-04 | -6.54e-01 | 0.0528 |
| 51809 | GALNT7 | HTA11_10711_2000001011 | Human | Colorectum | AD | 3.46e-04 | -5.09e-01 | 0.0338 |
| 51809 | GALNT7 | HTA11_7696_3000711011 | Human | Colorectum | AD | 1.18e-19 | -5.91e-01 | 0.0674 |
| 51809 | GALNT7 | HTA11_99999970781_79442 | Human | Colorectum | MSS | 1.28e-15 | -4.85e-01 | 0.294 |
| 51809 | GALNT7 | HTA11_99999971662_82457 | Human | Colorectum | MSS | 2.79e-15 | -5.32e-01 | 0.3859 |
| 51809 | GALNT7 | HTA11_99999973899_84307 | Human | Colorectum | MSS | 8.92e-08 | -7.35e-01 | 0.2585 |
| 51809 | GALNT7 | HTA11_99999974143_84620 | Human | Colorectum | MSS | 5.81e-28 | -7.33e-01 | 0.3005 |
| 51809 | GALNT7 | F007 | Human | Colorectum | FAP | 7.57e-09 | -6.21e-01 | 0.1176 |
| 51809 | GALNT7 | A001-C-207 | Human | Colorectum | FAP | 3.88e-02 | -2.25e-01 | 0.1278 |
| 51809 | GALNT7 | A015-C-203 | Human | Colorectum | FAP | 2.77e-35 | -5.76e-01 | -0.1294 |
| Page: 1 2 3 4 5 6 7 8 9 |
| Tissue | Expression Dynamics | Abbreviation |
| Cervix |  | CC: Cervix cancer |
| HSIL_HPV: HPV-infected high-grade squamous intraepithelial lesions | ||
| N_HPV: HPV-infected normal cervix | ||
| Colorectum (GSE201348) |  | FAP: Familial adenomatous polyposis |
| CRC: Colorectal cancer | ||
| Colorectum (HTA11) |  | AD: Adenomas |
| SER: Sessile serrated lesions | ||
| MSI-H: Microsatellite-high colorectal cancer | ||
| MSS: Microsatellite stable colorectal cancer | ||
| Endometrium |  | AEH: Atypical endometrial hyperplasia |
| EEC: Endometrioid Cancer | ||
| Esophagus | 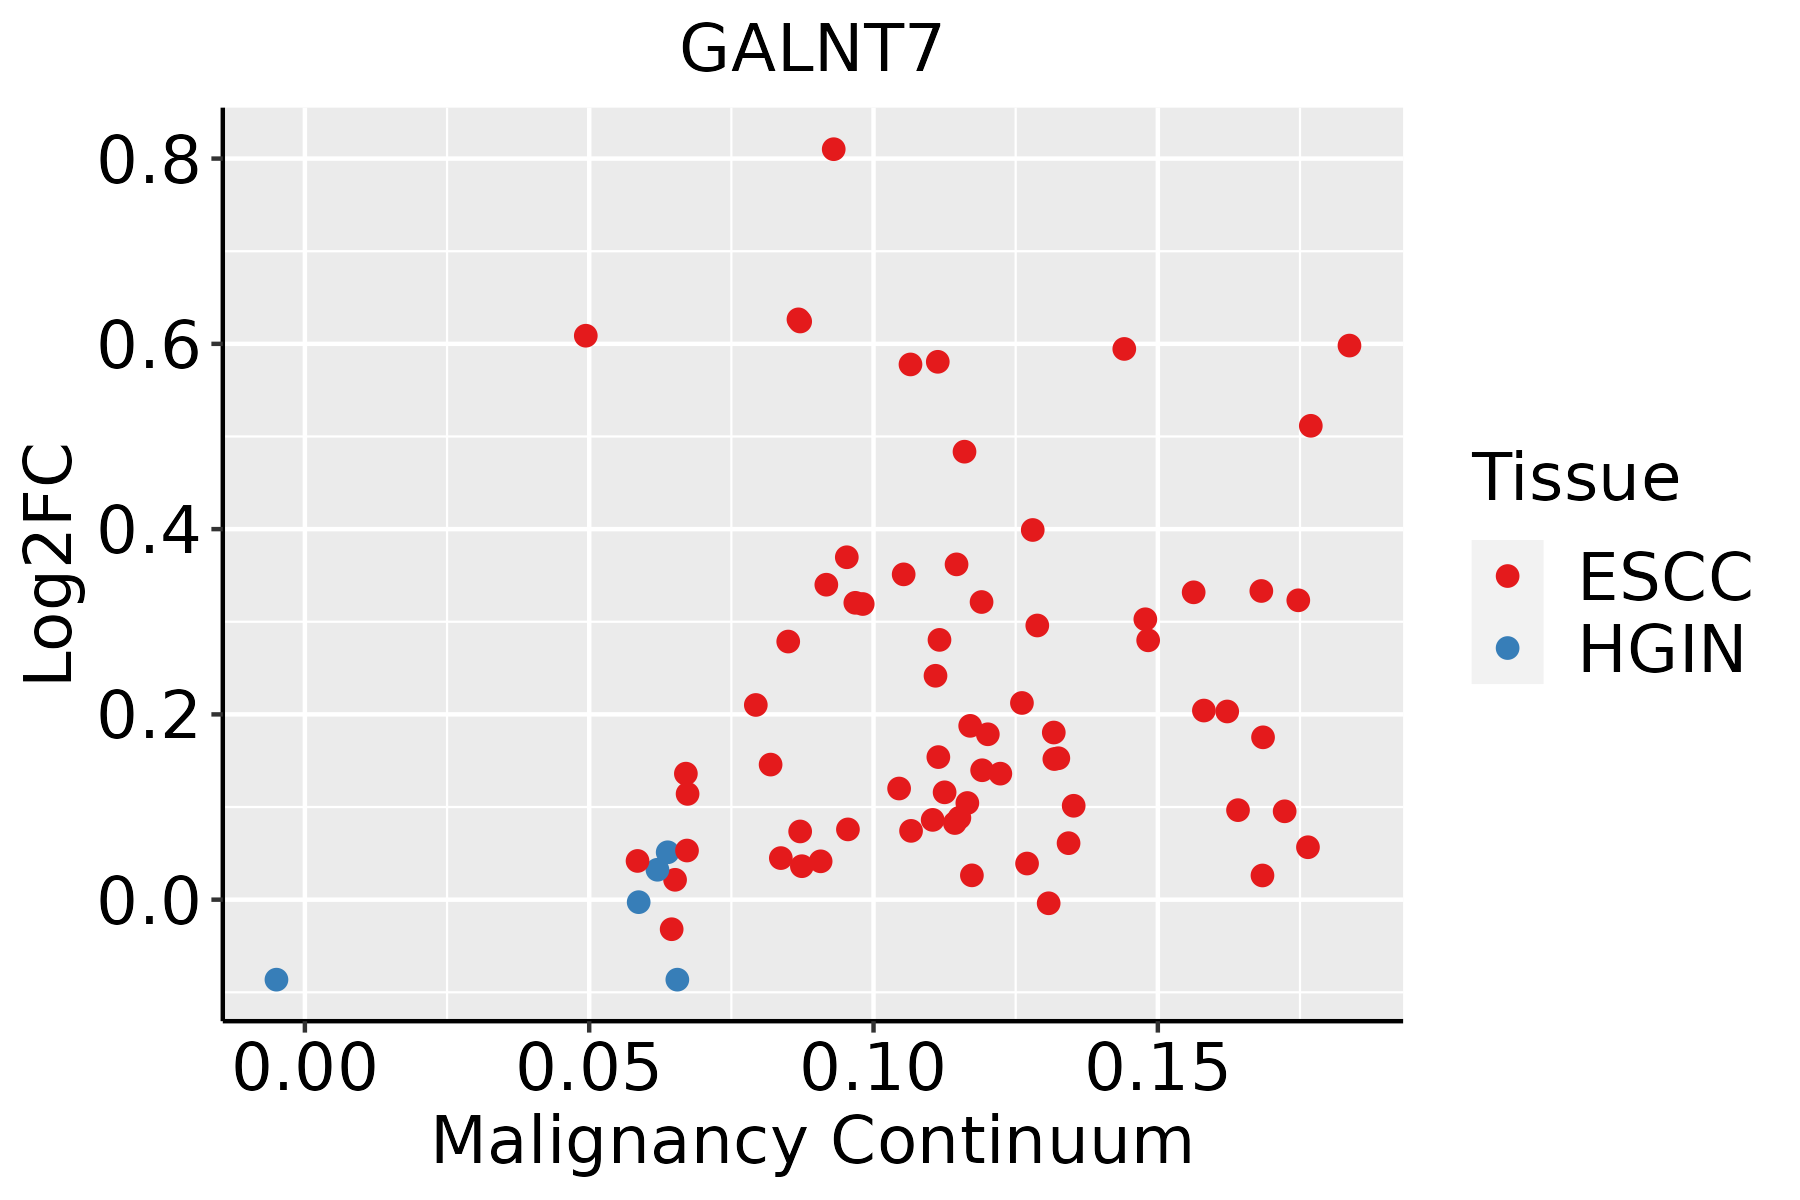 | ESCC: Esophageal squamous cell carcinoma |
| HGIN: High-grade intraepithelial neoplasias | ||
| LGIN: Low-grade intraepithelial neoplasias | ||
| Lung |  | AAH: Atypical adenomatous hyperplasia |
| AIS: Adenocarcinoma in situ | ||
| IAC: Invasive lung adenocarcinoma | ||
| MIA: Minimally invasive adenocarcinoma | ||
| Oral Cavity | 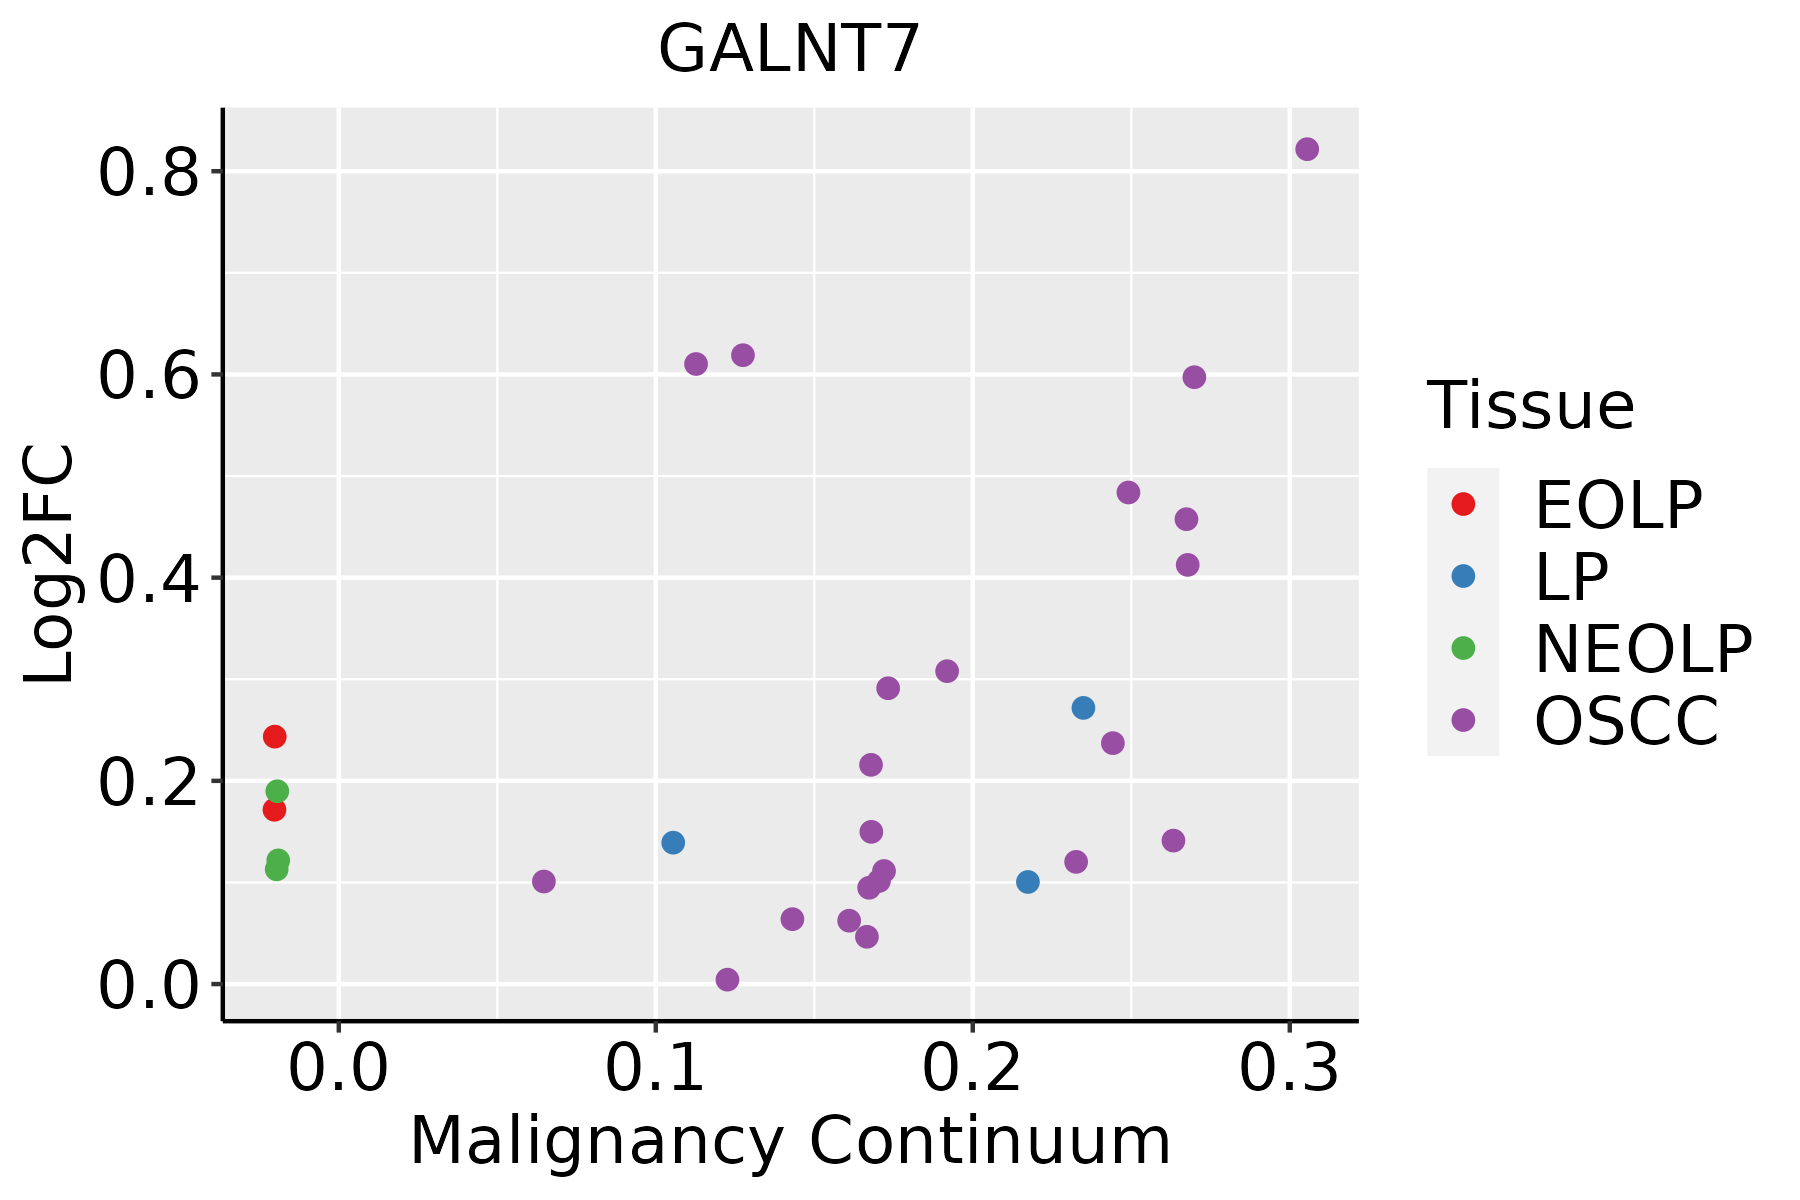 | EOLP: Erosive Oral lichen planus |
| LP: leukoplakia | ||
| NEOLP: Non-erosive oral lichen planus | ||
| OSCC: Oral squamous cell carcinoma | ||
| Prostate |  | BPH: Benign Prostatic Hyperplasia |
| Thyroid |  | ATC: Anaplastic thyroid cancer |
| HT: Hashimoto's thyroiditis | ||
| PTC: Papillary thyroid cancer |
| ∗log2FC in expression of this searched gene in stem-like cells from each diseased tissue sample relative to stem-like cells in normal samples in each tissue plotted against the malignancy continuum. Samples are colored based on if they are from different disease stage. |
Top |
Malignant transformation related pathway analysis |
| Find out the enriched GO biological processes and KEGG pathways involved in transition from healthy to precancer to cancer |
| Tissue | Disease Stage | Enriched GO biological Processes |
| Colorectum | AD |  |
| Colorectum | SER |  |
| Colorectum | MSS |  |
| Colorectum | MSI-H |  |
| Colorectum | FAP |  |
| ∗Top 15 enriched GO BP terms are showed in the bar plot of each disease state in each tissue. Each row represents a significant GO biological process which is colored according to the -log10(p.adjust). |
| Page: 1 2 3 4 5 6 7 8 9 |
| GO ID | Tissue | Disease Stage | Description | Gene Ratio | Bg Ratio | pvalue | p.adjust | Count |
| GO:0006486 | Colorectum | AD | protein glycosylation | 64/3918 | 226/18723 | 4.86e-03 | 3.27e-02 | 64 |
| GO:0043413 | Colorectum | AD | macromolecule glycosylation | 64/3918 | 226/18723 | 4.86e-03 | 3.27e-02 | 64 |
| GO:0070085 | Colorectum | AD | glycosylation | 67/3918 | 240/18723 | 5.78e-03 | 3.67e-02 | 67 |
| GO:00064861 | Colorectum | FAP | protein glycosylation | 48/2622 | 226/18723 | 1.85e-03 | 1.57e-02 | 48 |
| GO:00434131 | Colorectum | FAP | macromolecule glycosylation | 48/2622 | 226/18723 | 1.85e-03 | 1.57e-02 | 48 |
| GO:00700851 | Colorectum | FAP | glycosylation | 50/2622 | 240/18723 | 2.30e-03 | 1.85e-02 | 50 |
| GO:0009101 | Colorectum | FAP | glycoprotein biosynthetic process | 63/2622 | 317/18723 | 2.31e-03 | 1.86e-02 | 63 |
| GO:00091002 | Esophagus | ESCC | glycoprotein metabolic process | 226/8552 | 387/18723 | 2.64e-07 | 3.94e-06 | 226 |
| GO:00700854 | Esophagus | ESCC | glycosylation | 144/8552 | 240/18723 | 5.12e-06 | 5.38e-05 | 144 |
| GO:00064865 | Esophagus | ESCC | protein glycosylation | 135/8552 | 226/18723 | 1.36e-05 | 1.24e-04 | 135 |
| GO:00434135 | Esophagus | ESCC | macromolecule glycosylation | 135/8552 | 226/18723 | 1.36e-05 | 1.24e-04 | 135 |
| GO:00091012 | Esophagus | ESCC | glycoprotein biosynthetic process | 181/8552 | 317/18723 | 2.54e-05 | 2.15e-04 | 181 |
| GO:00064931 | Esophagus | ESCC | protein O-linked glycosylation | 51/8552 | 86/18723 | 7.54e-03 | 2.70e-02 | 51 |
| GO:0006493 | Lung | AIS | protein O-linked glycosylation | 17/1849 | 86/18723 | 4.04e-03 | 3.65e-02 | 17 |
| GO:00064863 | Lung | AIS | protein glycosylation | 35/1849 | 226/18723 | 4.93e-03 | 4.27e-02 | 35 |
| GO:00434133 | Lung | AIS | macromolecule glycosylation | 35/1849 | 226/18723 | 4.93e-03 | 4.27e-02 | 35 |
| GO:00091001 | Oral cavity | OSCC | glycoprotein metabolic process | 185/7305 | 387/18723 | 2.37e-04 | 1.54e-03 | 185 |
| GO:00091011 | Oral cavity | OSCC | glycoprotein biosynthetic process | 151/7305 | 317/18723 | 1.01e-03 | 5.26e-03 | 151 |
| GO:00064864 | Oral cavity | OSCC | protein glycosylation | 111/7305 | 226/18723 | 1.22e-03 | 6.10e-03 | 111 |
| GO:00434134 | Oral cavity | OSCC | macromolecule glycosylation | 111/7305 | 226/18723 | 1.22e-03 | 6.10e-03 | 111 |
| Page: 1 2 |
| Pathway ID | Tissue | Disease Stage | Description | Gene Ratio | Bg Ratio | pvalue | p.adjust | qvalue | Count |
| Page: 1 |
Top |
Cell-cell communication analysis |
| Identification of potential cell-cell interactions between two cell types and their ligand-receptor pairs for different disease states |
| Ligand | Receptor | LRpair | Pathway | Tissue | Disease Stage |
| Page: 1 |
Top |
Single-cell gene regulatory network inference analysis |
| Find out the significant the regulons (TFs) and the target genes of each regulon across cell types for different disease states |
| TF | Cell Type | Tissue | Disease Stage | Target Gene | RSS | Regulon Activity |
| ∗The dot plots of a searched regulon are shown for all cell subpopulations in each disease state of each tissue based on the regulon specific score inferred using pySCENIC and by calculating the average expression. |
| Page: 1 |
Top |
Somatic mutation of malignant transformation related genes |
| Annotation of somatic variants for genes involved in malignant transformation |
| Hugo Symbol | Variant Class | Variant Classification | dbSNP RS | HGVSc | HGVSp | HGVSp Short | SWISSPROT | BIOTYPE | SIFT | PolyPhen | Tumor Sample Barcode | Tissue | Histology | Sex | Age | Stage | Therapy Types | Drugs | Outcome |
| GALNT7 | SNV | Missense_Mutation | rs777199234 | c.1355N>T | p.Pro452Leu | p.P452L | Q86SF2 | protein_coding | deleterious(0.04) | benign(0.223) | TCGA-4H-AAAK-01 | Breast | breast invasive carcinoma | Female | <65 | III/IV | Chemotherapy | cyclophosphamide | CR |
| GALNT7 | SNV | Missense_Mutation | c.548N>A | p.Ile183Asn | p.I183N | Q86SF2 | protein_coding | deleterious(0) | probably_damaging(0.985) | TCGA-D8-A1JD-01 | Breast | breast invasive carcinoma | Female | <65 | I/II | Chemotherapy | adriamycin | SD | |
| GALNT7 | SNV | Missense_Mutation | c.244T>A | p.Leu82Ile | p.L82I | Q86SF2 | protein_coding | deleterious(0.01) | benign(0.123) | TCGA-E9-A1NC-01 | Breast | breast invasive carcinoma | Female | <65 | I/II | Chemotherapy | doxorubicin | CR | |
| GALNT7 | insertion | Frame_Shift_Ins | novel | c.1355_1356insTTTCC | p.Pro453PhefsTer12 | p.P453Ffs*12 | Q86SF2 | protein_coding | TCGA-A1-A0SO-01 | Breast | breast invasive carcinoma | Female | >=65 | I/II | Chemotherapy | SD | |||
| GALNT7 | insertion | Frame_Shift_Ins | novel | c.1020_1021insATACCCC | p.Gln343HisfsTer7 | p.Q343Hfs*7 | Q86SF2 | protein_coding | TCGA-BH-A0AU-01 | Breast | breast invasive carcinoma | Female | <65 | I/II | Unknown | Unknown | SD | ||
| GALNT7 | SNV | Missense_Mutation | novel | c.1475A>G | p.Tyr492Cys | p.Y492C | Q86SF2 | protein_coding | tolerated(0.09) | benign(0.08) | TCGA-2W-A8YY-01 | Cervix | cervical & endocervical cancer | Female | <65 | I/II | Chemotherapy | cisplatin | CR |
| GALNT7 | SNV | Missense_Mutation | c.1259N>T | p.Ser420Leu | p.S420L | Q86SF2 | protein_coding | deleterious(0.01) | probably_damaging(1) | TCGA-EK-A2PM-01 | Cervix | cervical & endocervical cancer | Female | >=65 | I/II | Unknown | Unknown | SD | |
| GALNT7 | SNV | Missense_Mutation | c.1882N>T | p.Arg628Cys | p.R628C | Q86SF2 | protein_coding | tolerated(0.17) | probably_damaging(0.939) | TCGA-AA-3984-01 | Colorectum | colon adenocarcinoma | Female | <65 | I/II | Unknown | Unknown | SD | |
| GALNT7 | SNV | Missense_Mutation | c.1121N>G | p.Leu374Arg | p.L374R | Q86SF2 | protein_coding | tolerated(0.94) | benign(0.001) | TCGA-AD-5900-01 | Colorectum | colon adenocarcinoma | Male | >=65 | I/II | Unknown | Unknown | SD | |
| GALNT7 | SNV | Missense_Mutation | rs755005166 | c.1934C>T | p.Thr645Met | p.T645M | Q86SF2 | protein_coding | tolerated(0.16) | benign(0.003) | TCGA-AM-5821-01 | Colorectum | colon adenocarcinoma | Female | >=65 | I/II | Unknown | Unknown | SD |
| Page: 1 2 3 4 5 6 7 8 |
Top |
Related drugs of malignant transformation related genes |
| Identification of chemicals and drugs interact with genes involved in malignant transfromation |
| (DGIdb 4.0) |
| Entrez ID | Symbol | Category | Interaction Types | Drug Claim Name | Drug Name | PMIDs |
| Page: 1 |

Copyright 2023-Present -The University of Texas Health Science Center at Houston |