
|
|||||
|
 | |
| |
| |
| |
| |
| |
|
Gene: GALNT3 |
Gene summary for GALNT3 |
| Gene information | Species | Human | Gene symbol | GALNT3 | Gene ID | 2591 |
| Gene name | polypeptide N-acetylgalactosaminyltransferase 3 | |
| Gene Alias | GalNAc-T3 | |
| Cytomap | 2q24.3 | |
| Gene Type | protein-coding | GO ID | GO:0005975 | UniProtAcc | Q14435 |
Top |
Malignant transformation analysis |
| Identification of the aberrant gene expression in precancerous and cancerous lesions by comparing the gene expression of stem-like cells in diseased tissues with normal stem cells |
| Entrez ID | Symbol | Replicates | Species | Organ | Tissue | Adj P-value | Log2FC | Malignancy |
| 2591 | GALNT3 | HTA11_78_2000001011 | Human | Colorectum | AD | 1.46e-09 | 5.51e-01 | -0.1088 |
| 2591 | GALNT3 | A015-C-203 | Human | Colorectum | FAP | 3.67e-08 | -1.15e-01 | -0.1294 |
| 2591 | GALNT3 | A001-C-108 | Human | Colorectum | FAP | 2.61e-03 | -5.63e-02 | -0.0272 |
| 2591 | GALNT3 | A002-C-205 | Human | Colorectum | FAP | 2.51e-03 | -1.56e-01 | -0.1236 |
| 2591 | GALNT3 | A015-C-006 | Human | Colorectum | FAP | 8.74e-03 | -2.43e-01 | -0.0994 |
| 2591 | GALNT3 | A015-C-106 | Human | Colorectum | FAP | 5.35e-05 | -1.48e-01 | -0.0511 |
| 2591 | GALNT3 | A015-C-104 | Human | Colorectum | FAP | 4.63e-11 | -1.94e-01 | -0.1899 |
| 2591 | GALNT3 | A001-C-014 | Human | Colorectum | FAP | 2.02e-04 | -1.50e-01 | 0.0135 |
| 2591 | GALNT3 | A002-C-016 | Human | Colorectum | FAP | 1.47e-04 | -1.27e-01 | 0.0521 |
| 2591 | GALNT3 | A002-C-116 | Human | Colorectum | FAP | 1.64e-10 | -1.71e-01 | -0.0452 |
| 2591 | GALNT3 | A018-E-020 | Human | Colorectum | FAP | 4.98e-03 | -1.40e-01 | -0.2034 |
| 2591 | GALNT3 | F034 | Human | Colorectum | FAP | 3.00e-04 | -1.29e-01 | -0.0665 |
| 2591 | GALNT3 | LZE2T | Human | Esophagus | ESCC | 3.24e-03 | 5.13e-01 | 0.082 |
| 2591 | GALNT3 | LZE4T | Human | Esophagus | ESCC | 1.26e-13 | 1.83e-01 | 0.0811 |
| 2591 | GALNT3 | LZE5T | Human | Esophagus | ESCC | 2.17e-05 | 4.29e-01 | 0.0514 |
| 2591 | GALNT3 | LZE7T | Human | Esophagus | ESCC | 4.43e-05 | 4.75e-01 | 0.0667 |
| 2591 | GALNT3 | LZE8T | Human | Esophagus | ESCC | 1.81e-07 | 4.16e-02 | 0.067 |
| 2591 | GALNT3 | LZE20T | Human | Esophagus | ESCC | 1.88e-05 | 1.57e-01 | 0.0662 |
| 2591 | GALNT3 | LZE24T | Human | Esophagus | ESCC | 3.35e-17 | 4.00e-01 | 0.0596 |
| 2591 | GALNT3 | LZE6T | Human | Esophagus | ESCC | 2.91e-03 | 1.18e-02 | 0.0845 |
| Page: 1 2 3 4 5 6 |
| Tissue | Expression Dynamics | Abbreviation |
| Colorectum (GSE201348) |  | FAP: Familial adenomatous polyposis |
| CRC: Colorectal cancer | ||
| Colorectum (HTA11) |  | AD: Adenomas |
| SER: Sessile serrated lesions | ||
| MSI-H: Microsatellite-high colorectal cancer | ||
| MSS: Microsatellite stable colorectal cancer | ||
| Esophagus | 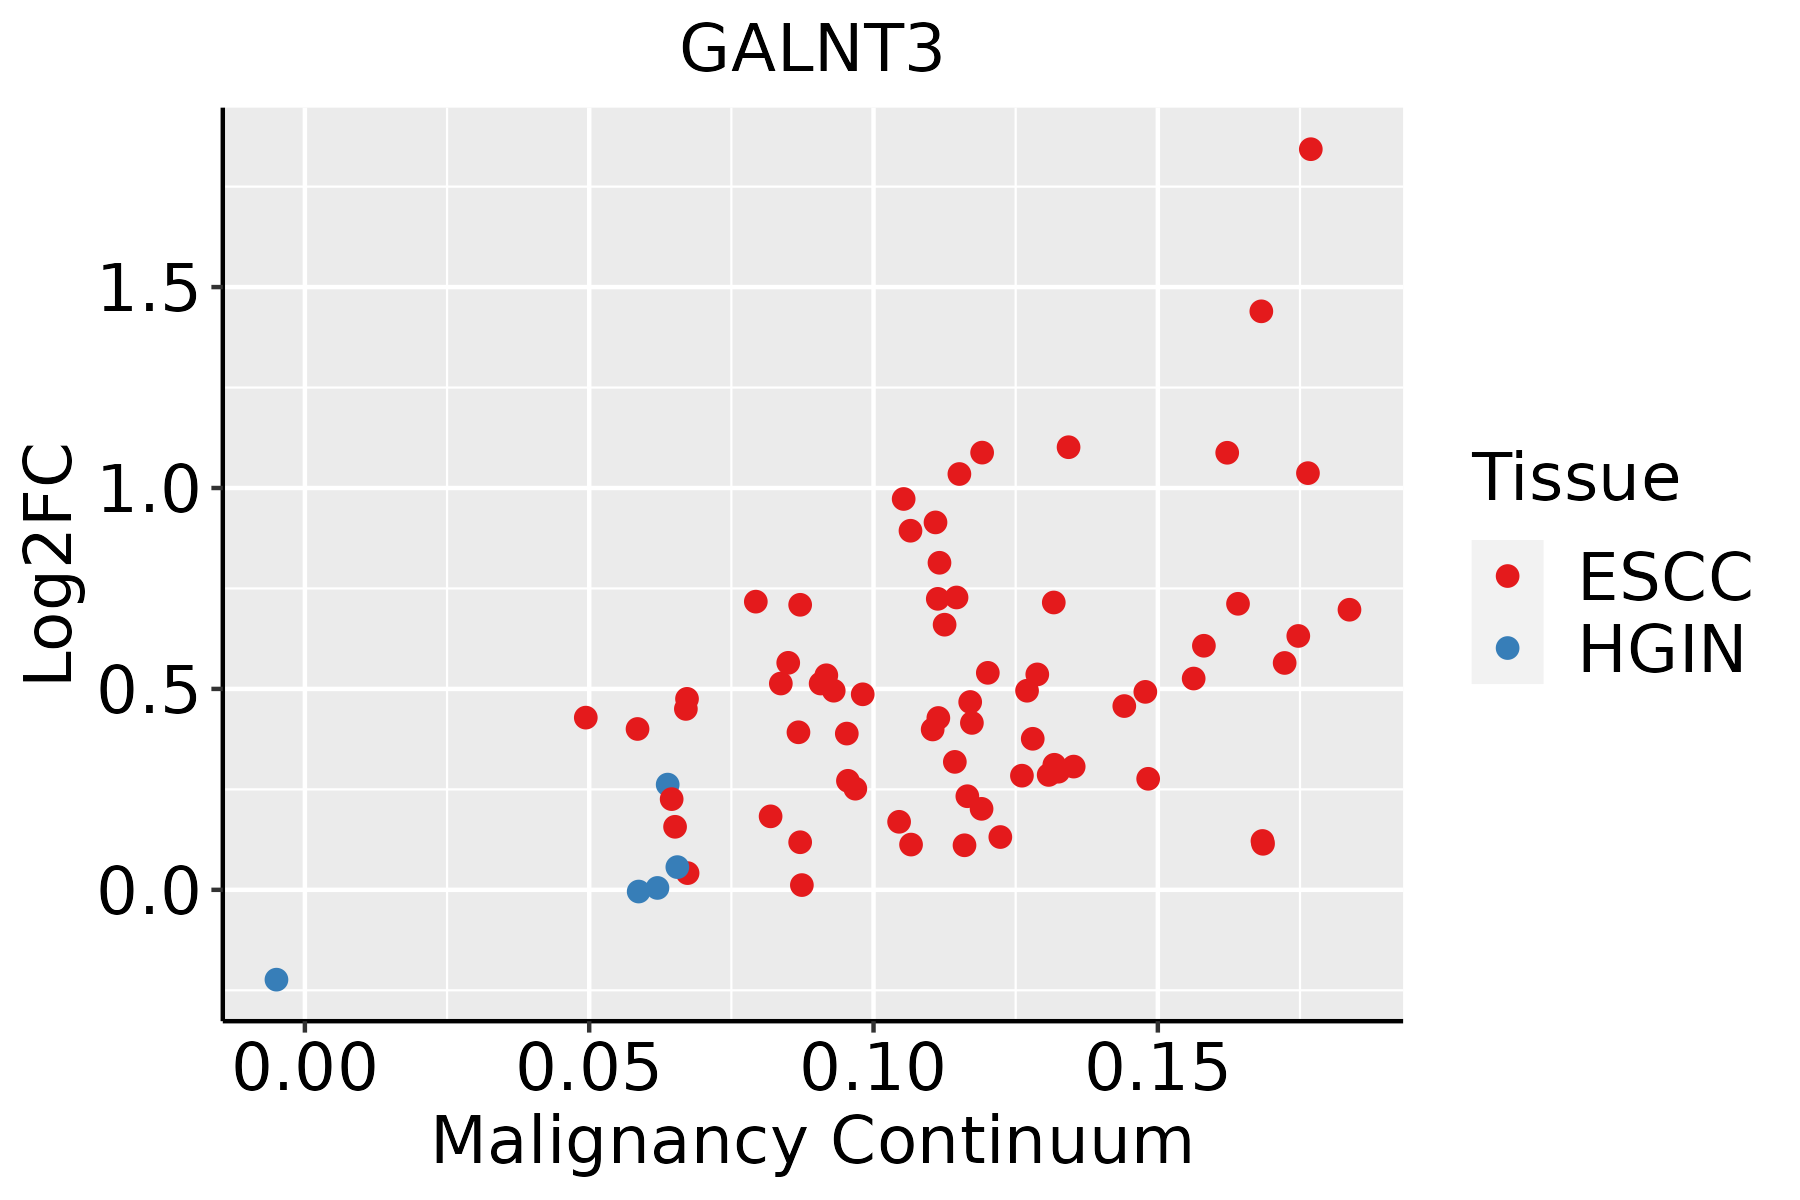 | ESCC: Esophageal squamous cell carcinoma |
| HGIN: High-grade intraepithelial neoplasias | ||
| LGIN: Low-grade intraepithelial neoplasias | ||
| Oral Cavity | 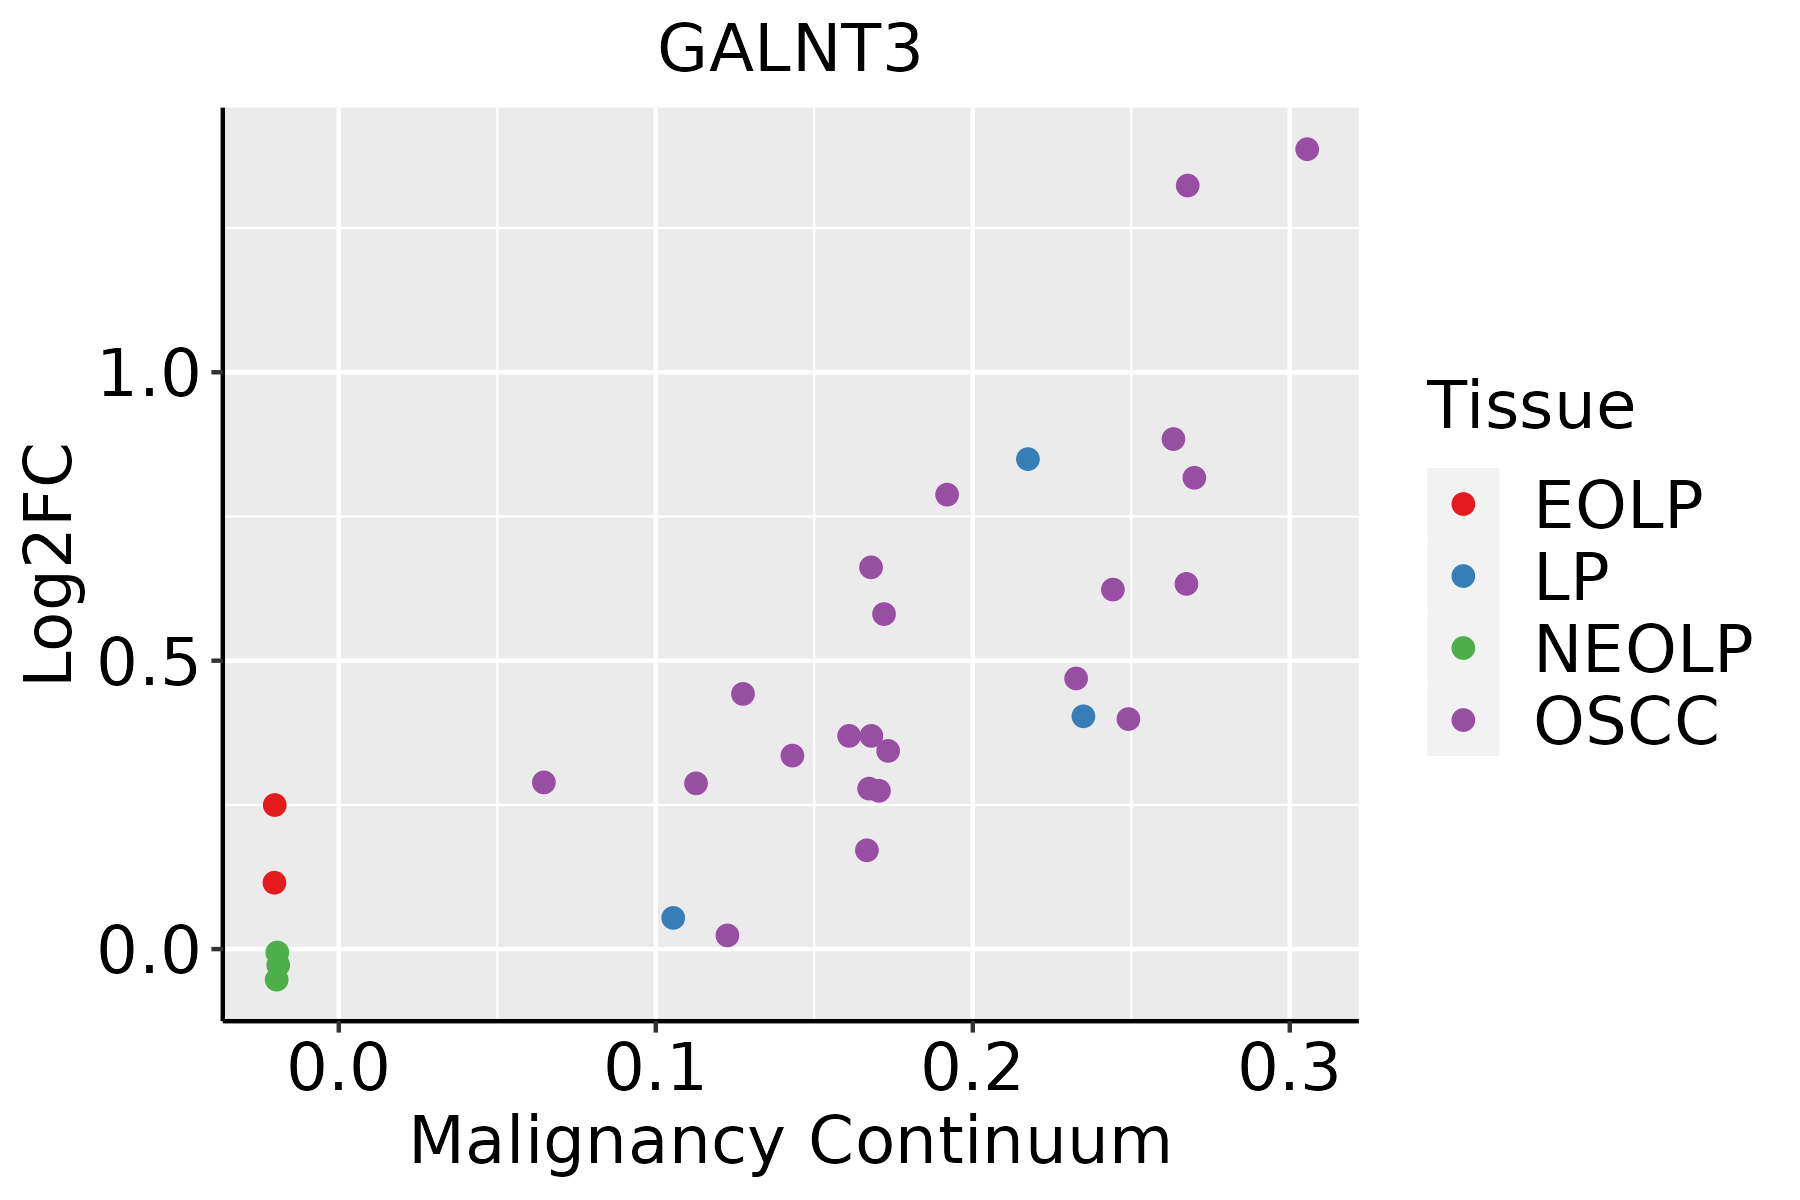 | EOLP: Erosive Oral lichen planus |
| LP: leukoplakia | ||
| NEOLP: Non-erosive oral lichen planus | ||
| OSCC: Oral squamous cell carcinoma | ||
| Prostate | 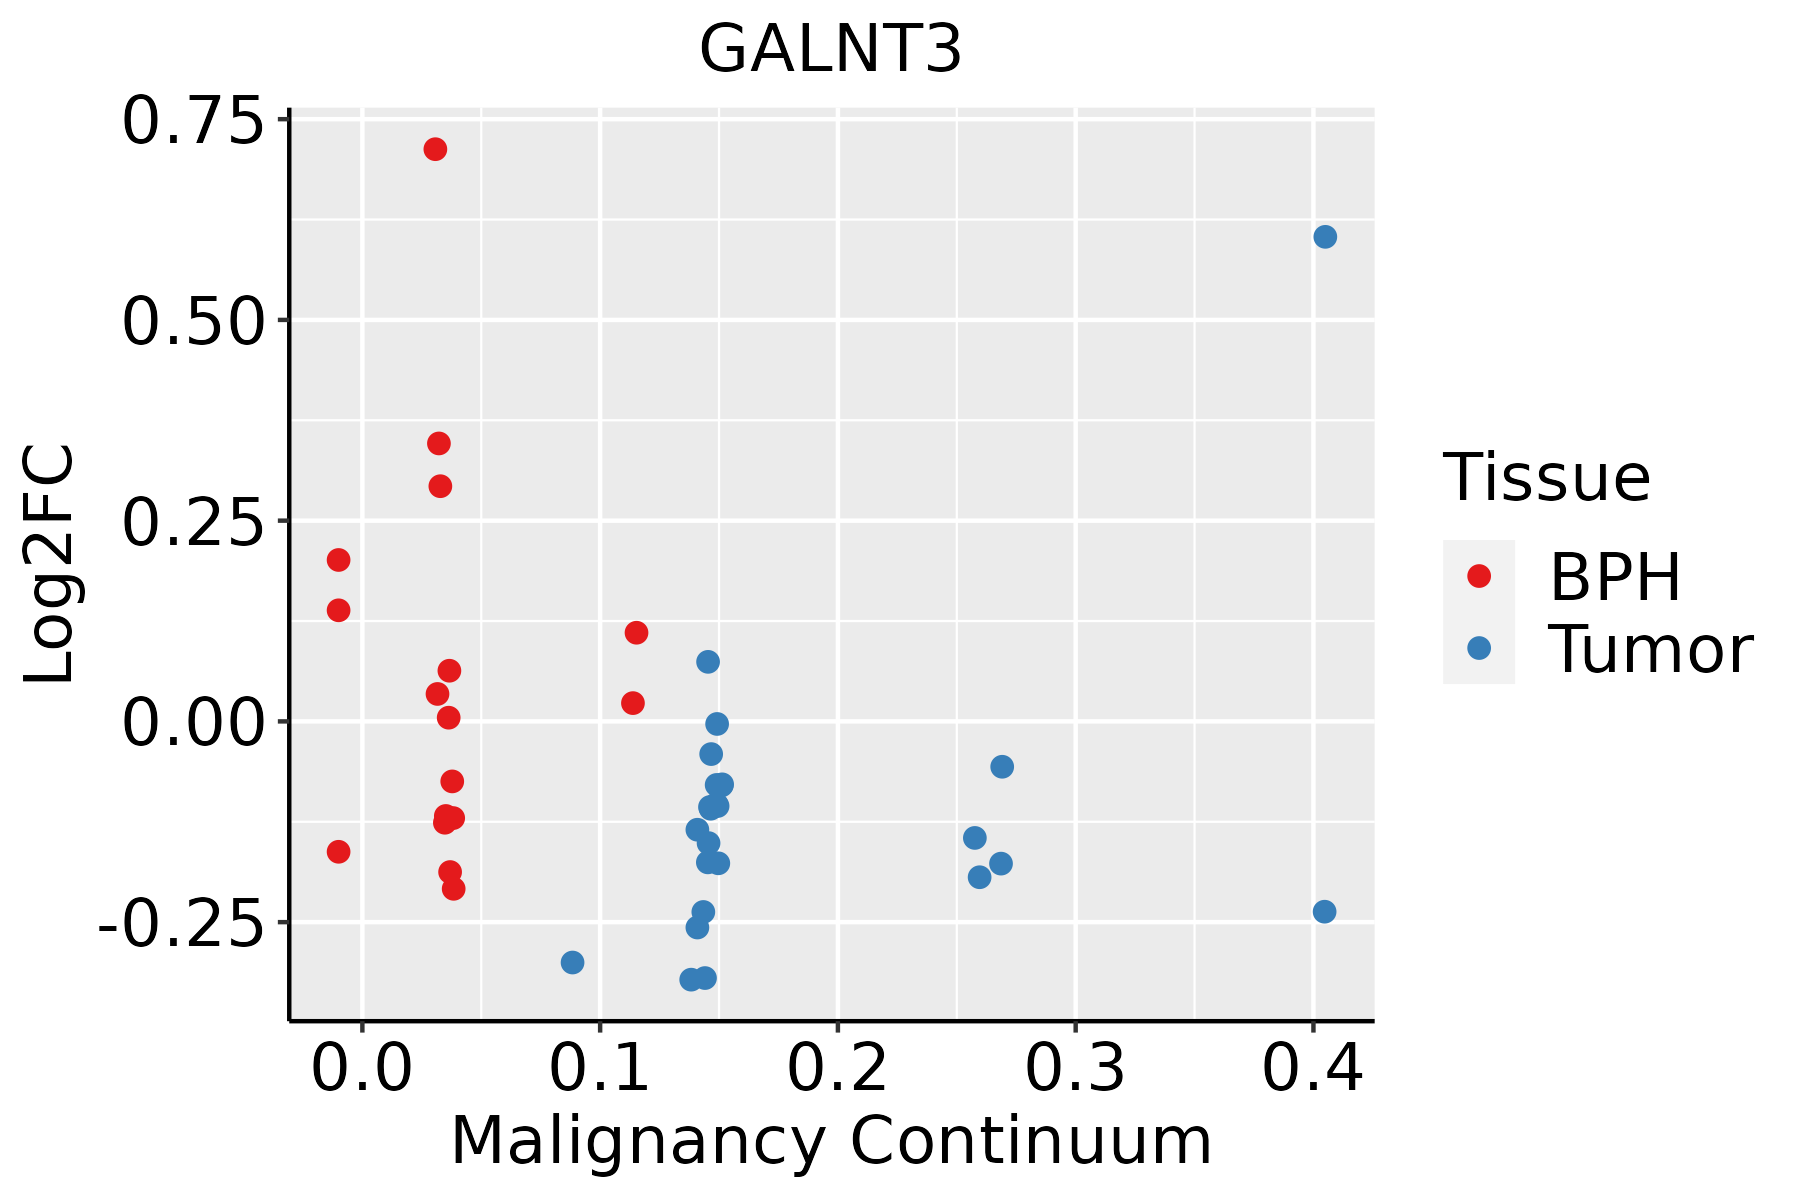 | BPH: Benign Prostatic Hyperplasia |
| Skin | 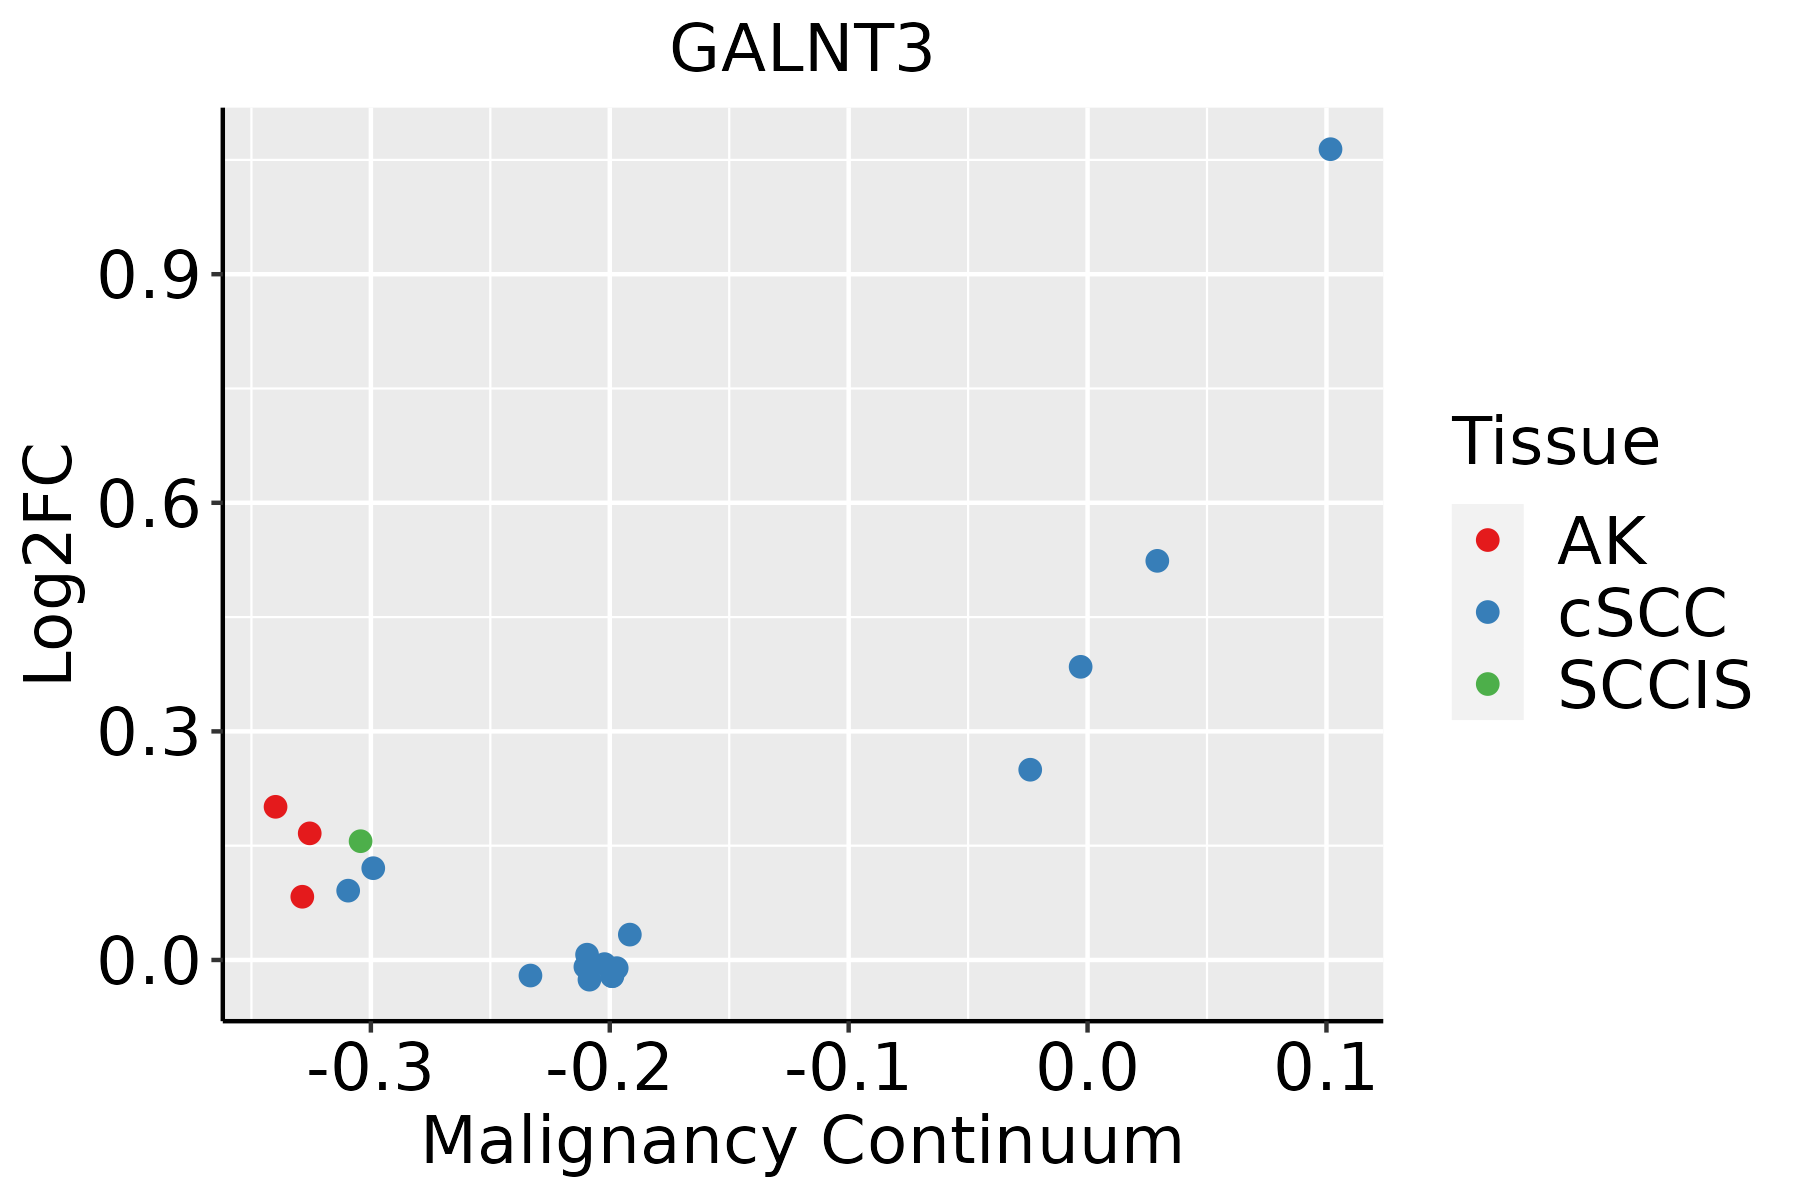 | AK: Actinic keratosis |
| cSCC: Cutaneous squamous cell carcinoma | ||
| SCCIS:squamous cell carcinoma in situ | ||
| Thyroid | 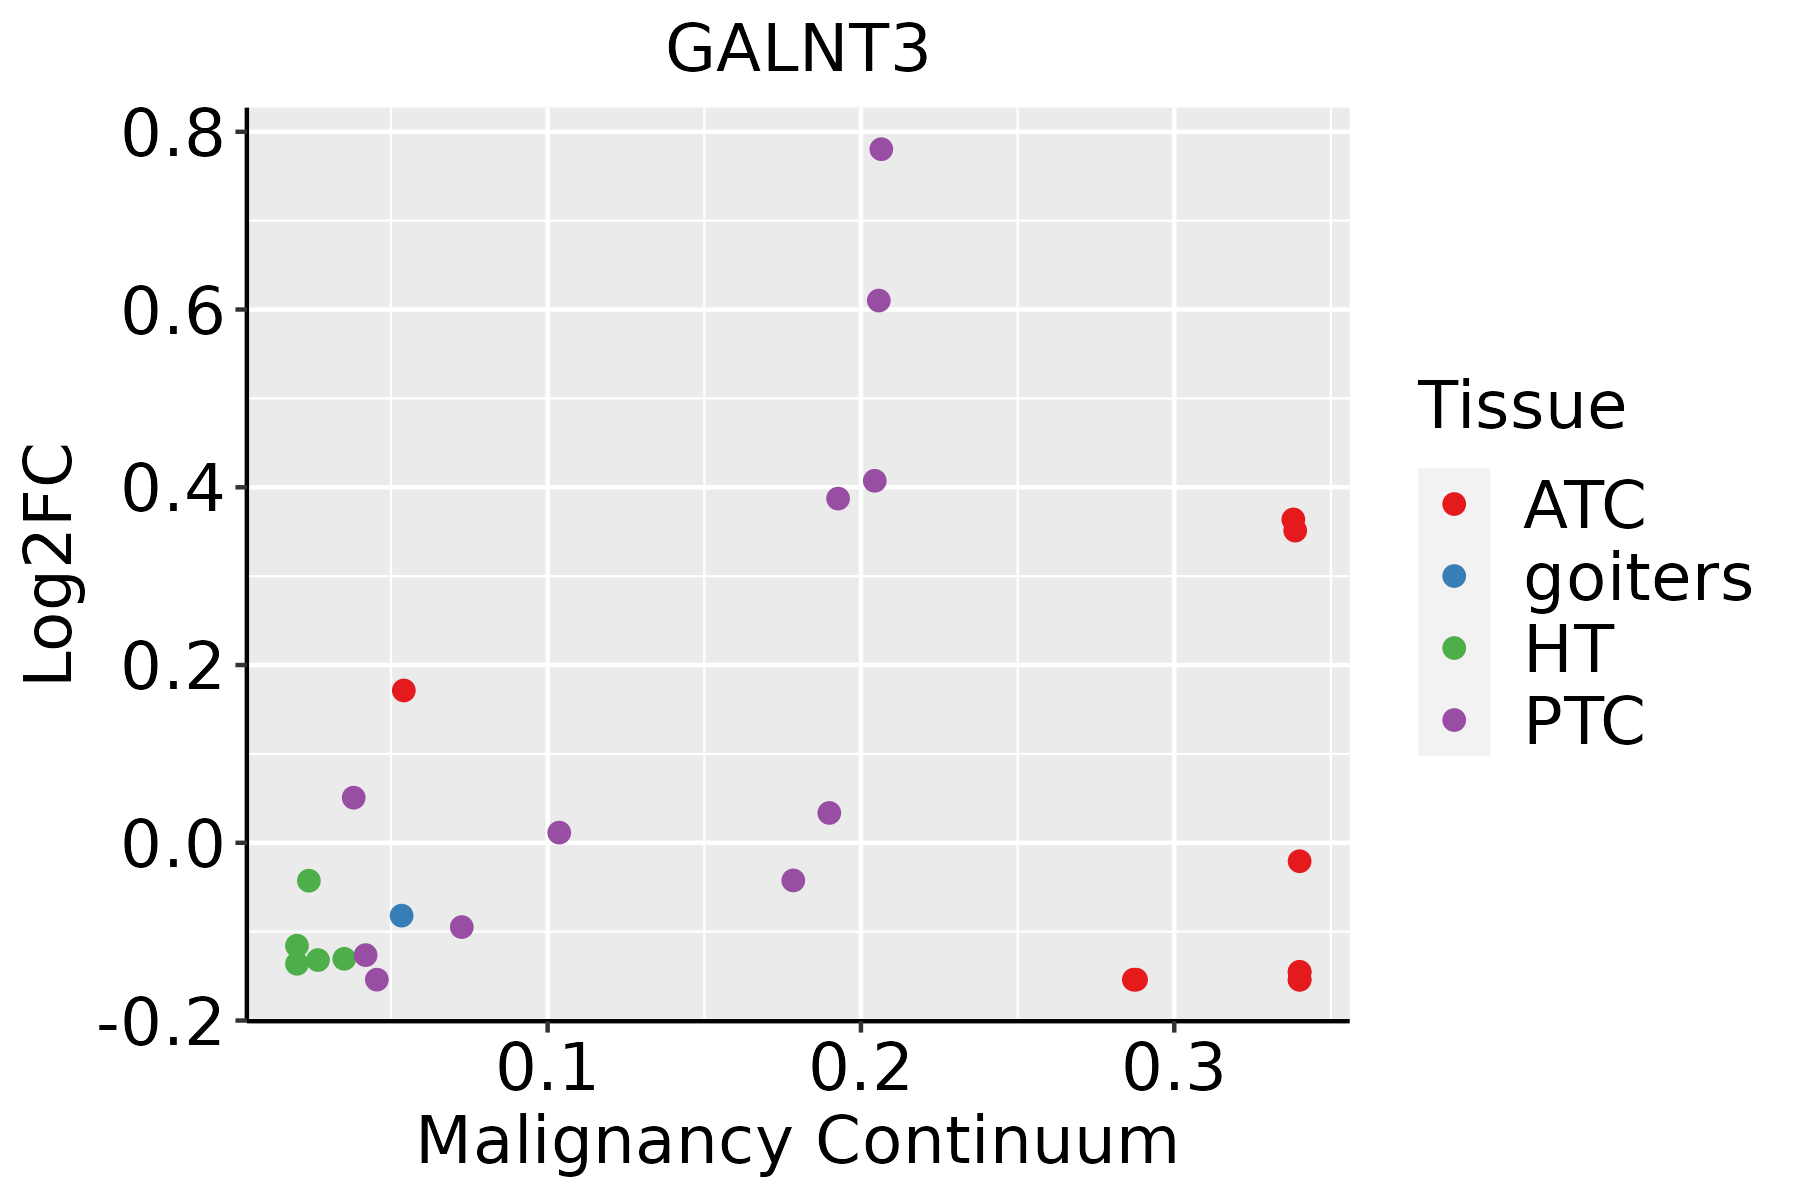 | ATC: Anaplastic thyroid cancer |
| HT: Hashimoto's thyroiditis | ||
| PTC: Papillary thyroid cancer |
| ∗log2FC in expression of this searched gene in stem-like cells from each diseased tissue sample relative to stem-like cells in normal samples in each tissue plotted against the malignancy continuum. Samples are colored based on if they are from different disease stage. |
Top |
Malignant transformation related pathway analysis |
| Find out the enriched GO biological processes and KEGG pathways involved in transition from healthy to precancer to cancer |
| Tissue | Disease Stage | Enriched GO biological Processes |
| Colorectum | AD |  |
| Colorectum | SER |  |
| Colorectum | MSS |  |
| Colorectum | MSI-H |  |
| Colorectum | FAP |  |
| ∗Top 15 enriched GO BP terms are showed in the bar plot of each disease state in each tissue. Each row represents a significant GO biological process which is colored according to the -log10(p.adjust). |
| Page: 1 2 3 4 5 6 7 8 9 |
| GO ID | Tissue | Disease Stage | Description | Gene Ratio | Bg Ratio | pvalue | p.adjust | Count |
| GO:0018210 | Colorectum | AD | peptidyl-threonine modification | 40/3918 | 125/18723 | 2.44e-03 | 1.88e-02 | 40 |
| GO:0018209 | Colorectum | AD | peptidyl-serine modification | 92/3918 | 338/18723 | 3.19e-03 | 2.36e-02 | 92 |
| GO:0006486 | Colorectum | AD | protein glycosylation | 64/3918 | 226/18723 | 4.86e-03 | 3.27e-02 | 64 |
| GO:0043413 | Colorectum | AD | macromolecule glycosylation | 64/3918 | 226/18723 | 4.86e-03 | 3.27e-02 | 64 |
| GO:0070085 | Colorectum | AD | glycosylation | 67/3918 | 240/18723 | 5.78e-03 | 3.67e-02 | 67 |
| GO:00182092 | Colorectum | FAP | peptidyl-serine modification | 73/2622 | 338/18723 | 8.47e-05 | 1.51e-03 | 73 |
| GO:00182102 | Colorectum | FAP | peptidyl-threonine modification | 31/2622 | 125/18723 | 8.93e-04 | 9.08e-03 | 31 |
| GO:00064861 | Colorectum | FAP | protein glycosylation | 48/2622 | 226/18723 | 1.85e-03 | 1.57e-02 | 48 |
| GO:00434131 | Colorectum | FAP | macromolecule glycosylation | 48/2622 | 226/18723 | 1.85e-03 | 1.57e-02 | 48 |
| GO:00700851 | Colorectum | FAP | glycosylation | 50/2622 | 240/18723 | 2.30e-03 | 1.85e-02 | 50 |
| GO:0009101 | Colorectum | FAP | glycoprotein biosynthetic process | 63/2622 | 317/18723 | 2.31e-03 | 1.86e-02 | 63 |
| GO:00091002 | Esophagus | ESCC | glycoprotein metabolic process | 226/8552 | 387/18723 | 2.64e-07 | 3.94e-06 | 226 |
| GO:00182099 | Esophagus | ESCC | peptidyl-serine modification | 196/8552 | 338/18723 | 3.07e-06 | 3.47e-05 | 196 |
| GO:00700854 | Esophagus | ESCC | glycosylation | 144/8552 | 240/18723 | 5.12e-06 | 5.38e-05 | 144 |
| GO:00064865 | Esophagus | ESCC | protein glycosylation | 135/8552 | 226/18723 | 1.36e-05 | 1.24e-04 | 135 |
| GO:00434135 | Esophagus | ESCC | macromolecule glycosylation | 135/8552 | 226/18723 | 1.36e-05 | 1.24e-04 | 135 |
| GO:00091012 | Esophagus | ESCC | glycoprotein biosynthetic process | 181/8552 | 317/18723 | 2.54e-05 | 2.15e-04 | 181 |
| GO:00064931 | Esophagus | ESCC | protein O-linked glycosylation | 51/8552 | 86/18723 | 7.54e-03 | 2.70e-02 | 51 |
| GO:001821010 | Esophagus | ESCC | peptidyl-threonine modification | 70/8552 | 125/18723 | 1.29e-02 | 4.25e-02 | 70 |
| GO:00182098 | Oral cavity | OSCC | peptidyl-serine modification | 175/7305 | 338/18723 | 1.09e-06 | 1.46e-05 | 175 |
| Page: 1 2 3 |
| Pathway ID | Tissue | Disease Stage | Description | Gene Ratio | Bg Ratio | pvalue | p.adjust | qvalue | Count |
| Page: 1 |
Top |
Cell-cell communication analysis |
| Identification of potential cell-cell interactions between two cell types and their ligand-receptor pairs for different disease states |
| Ligand | Receptor | LRpair | Pathway | Tissue | Disease Stage |
| Page: 1 |
Top |
Single-cell gene regulatory network inference analysis |
| Find out the significant the regulons (TFs) and the target genes of each regulon across cell types for different disease states |
| TF | Cell Type | Tissue | Disease Stage | Target Gene | RSS | Regulon Activity |
| ∗The dot plots of a searched regulon are shown for all cell subpopulations in each disease state of each tissue based on the regulon specific score inferred using pySCENIC and by calculating the average expression. |
| Page: 1 |
Top |
Somatic mutation of malignant transformation related genes |
| Annotation of somatic variants for genes involved in malignant transformation |
| Hugo Symbol | Variant Class | Variant Classification | dbSNP RS | HGVSc | HGVSp | HGVSp Short | SWISSPROT | BIOTYPE | SIFT | PolyPhen | Tumor Sample Barcode | Tissue | Histology | Sex | Age | Stage | Therapy Types | Drugs | Outcome |
| GALNT3 | SNV | Missense_Mutation | novel | c.1082N>A | p.Thr361Asn | p.T361N | Q14435 | protein_coding | deleterious(0) | probably_damaging(0.999) | TCGA-A7-A6VX-01 | Breast | breast invasive carcinoma | Female | >=65 | I/II | Chemotherapy | docetaxel | CR |
| GALNT3 | SNV | Missense_Mutation | c.1432N>T | p.His478Tyr | p.H478Y | Q14435 | protein_coding | deleterious(0) | benign(0.065) | TCGA-BH-A0BZ-01 | Breast | breast invasive carcinoma | Female | <65 | III/IV | Chemotherapy | doxorubicin | CR | |
| GALNT3 | insertion | Nonsense_Mutation | novel | c.335_336insAAAATAAAATACCA | p.Asp112GlufsTer3 | p.D112Efs*3 | Q14435 | protein_coding | TCGA-A8-A06P-01 | Breast | breast invasive carcinoma | Female | <65 | III/IV | Unspecific | SD | |||
| GALNT3 | insertion | Frame_Shift_Ins | novel | c.601_602insCCCAAAG | p.Leu201SerfsTer5 | p.L201Sfs*5 | Q14435 | protein_coding | TCGA-AO-A128-01 | Breast | breast invasive carcinoma | Female | <65 | I/II | Chemotherapy | doxorubicin | SD | ||
| GALNT3 | SNV | Missense_Mutation | rs547467910 | c.533N>G | p.Phe178Cys | p.F178C | Q14435 | protein_coding | deleterious(0) | probably_damaging(0.96) | TCGA-FU-A3HZ-01 | Cervix | cervical & endocervical cancer | Female | <65 | I/II | Chemotherapy | cisplatin | CR |
| GALNT3 | SNV | Missense_Mutation | c.953A>C | p.Lys318Thr | p.K318T | Q14435 | protein_coding | tolerated(0.23) | benign(0.215) | TCGA-AA-3864-01 | Colorectum | colon adenocarcinoma | Male | >=65 | I/II | Unknown | Unknown | SD | |
| GALNT3 | SNV | Missense_Mutation | rs752243721 | c.802N>A | p.Ala268Thr | p.A268T | Q14435 | protein_coding | deleterious(0.04) | probably_damaging(0.972) | TCGA-CA-6717-01 | Colorectum | colon adenocarcinoma | Male | <65 | I/II | Chemotherapy | oxaliplatin | CR |
| GALNT3 | SNV | Missense_Mutation | c.1699N>T | p.Gly567Cys | p.G567C | Q14435 | protein_coding | deleterious(0) | possibly_damaging(0.823) | TCGA-CK-4951-01 | Colorectum | colon adenocarcinoma | Female | >=65 | I/II | Unknown | Unknown | PD | |
| GALNT3 | SNV | Missense_Mutation | c.1831N>C | p.Glu611Gln | p.E611Q | Q14435 | protein_coding | tolerated(0.43) | benign(0.027) | TCGA-CK-4952-01 | Colorectum | colon adenocarcinoma | Female | <65 | III/IV | Unknown | Unknown | SD | |
| GALNT3 | SNV | Missense_Mutation | rs773423949 | c.1486G>T | p.Val496Leu | p.V496L | Q14435 | protein_coding | tolerated(1) | benign(0) | TCGA-D5-6541-01 | Colorectum | colon adenocarcinoma | Male | <65 | I/II | Unknown | Unknown | SD |
| Page: 1 2 3 4 5 6 7 8 9 |
Top |
Related drugs of malignant transformation related genes |
| Identification of chemicals and drugs interact with genes involved in malignant transfromation |
| (DGIdb 4.0) |
| Entrez ID | Symbol | Category | Interaction Types | Drug Claim Name | Drug Name | PMIDs |
| Page: 1 |

Copyright 2023-Present -The University of Texas Health Science Center at Houston |